
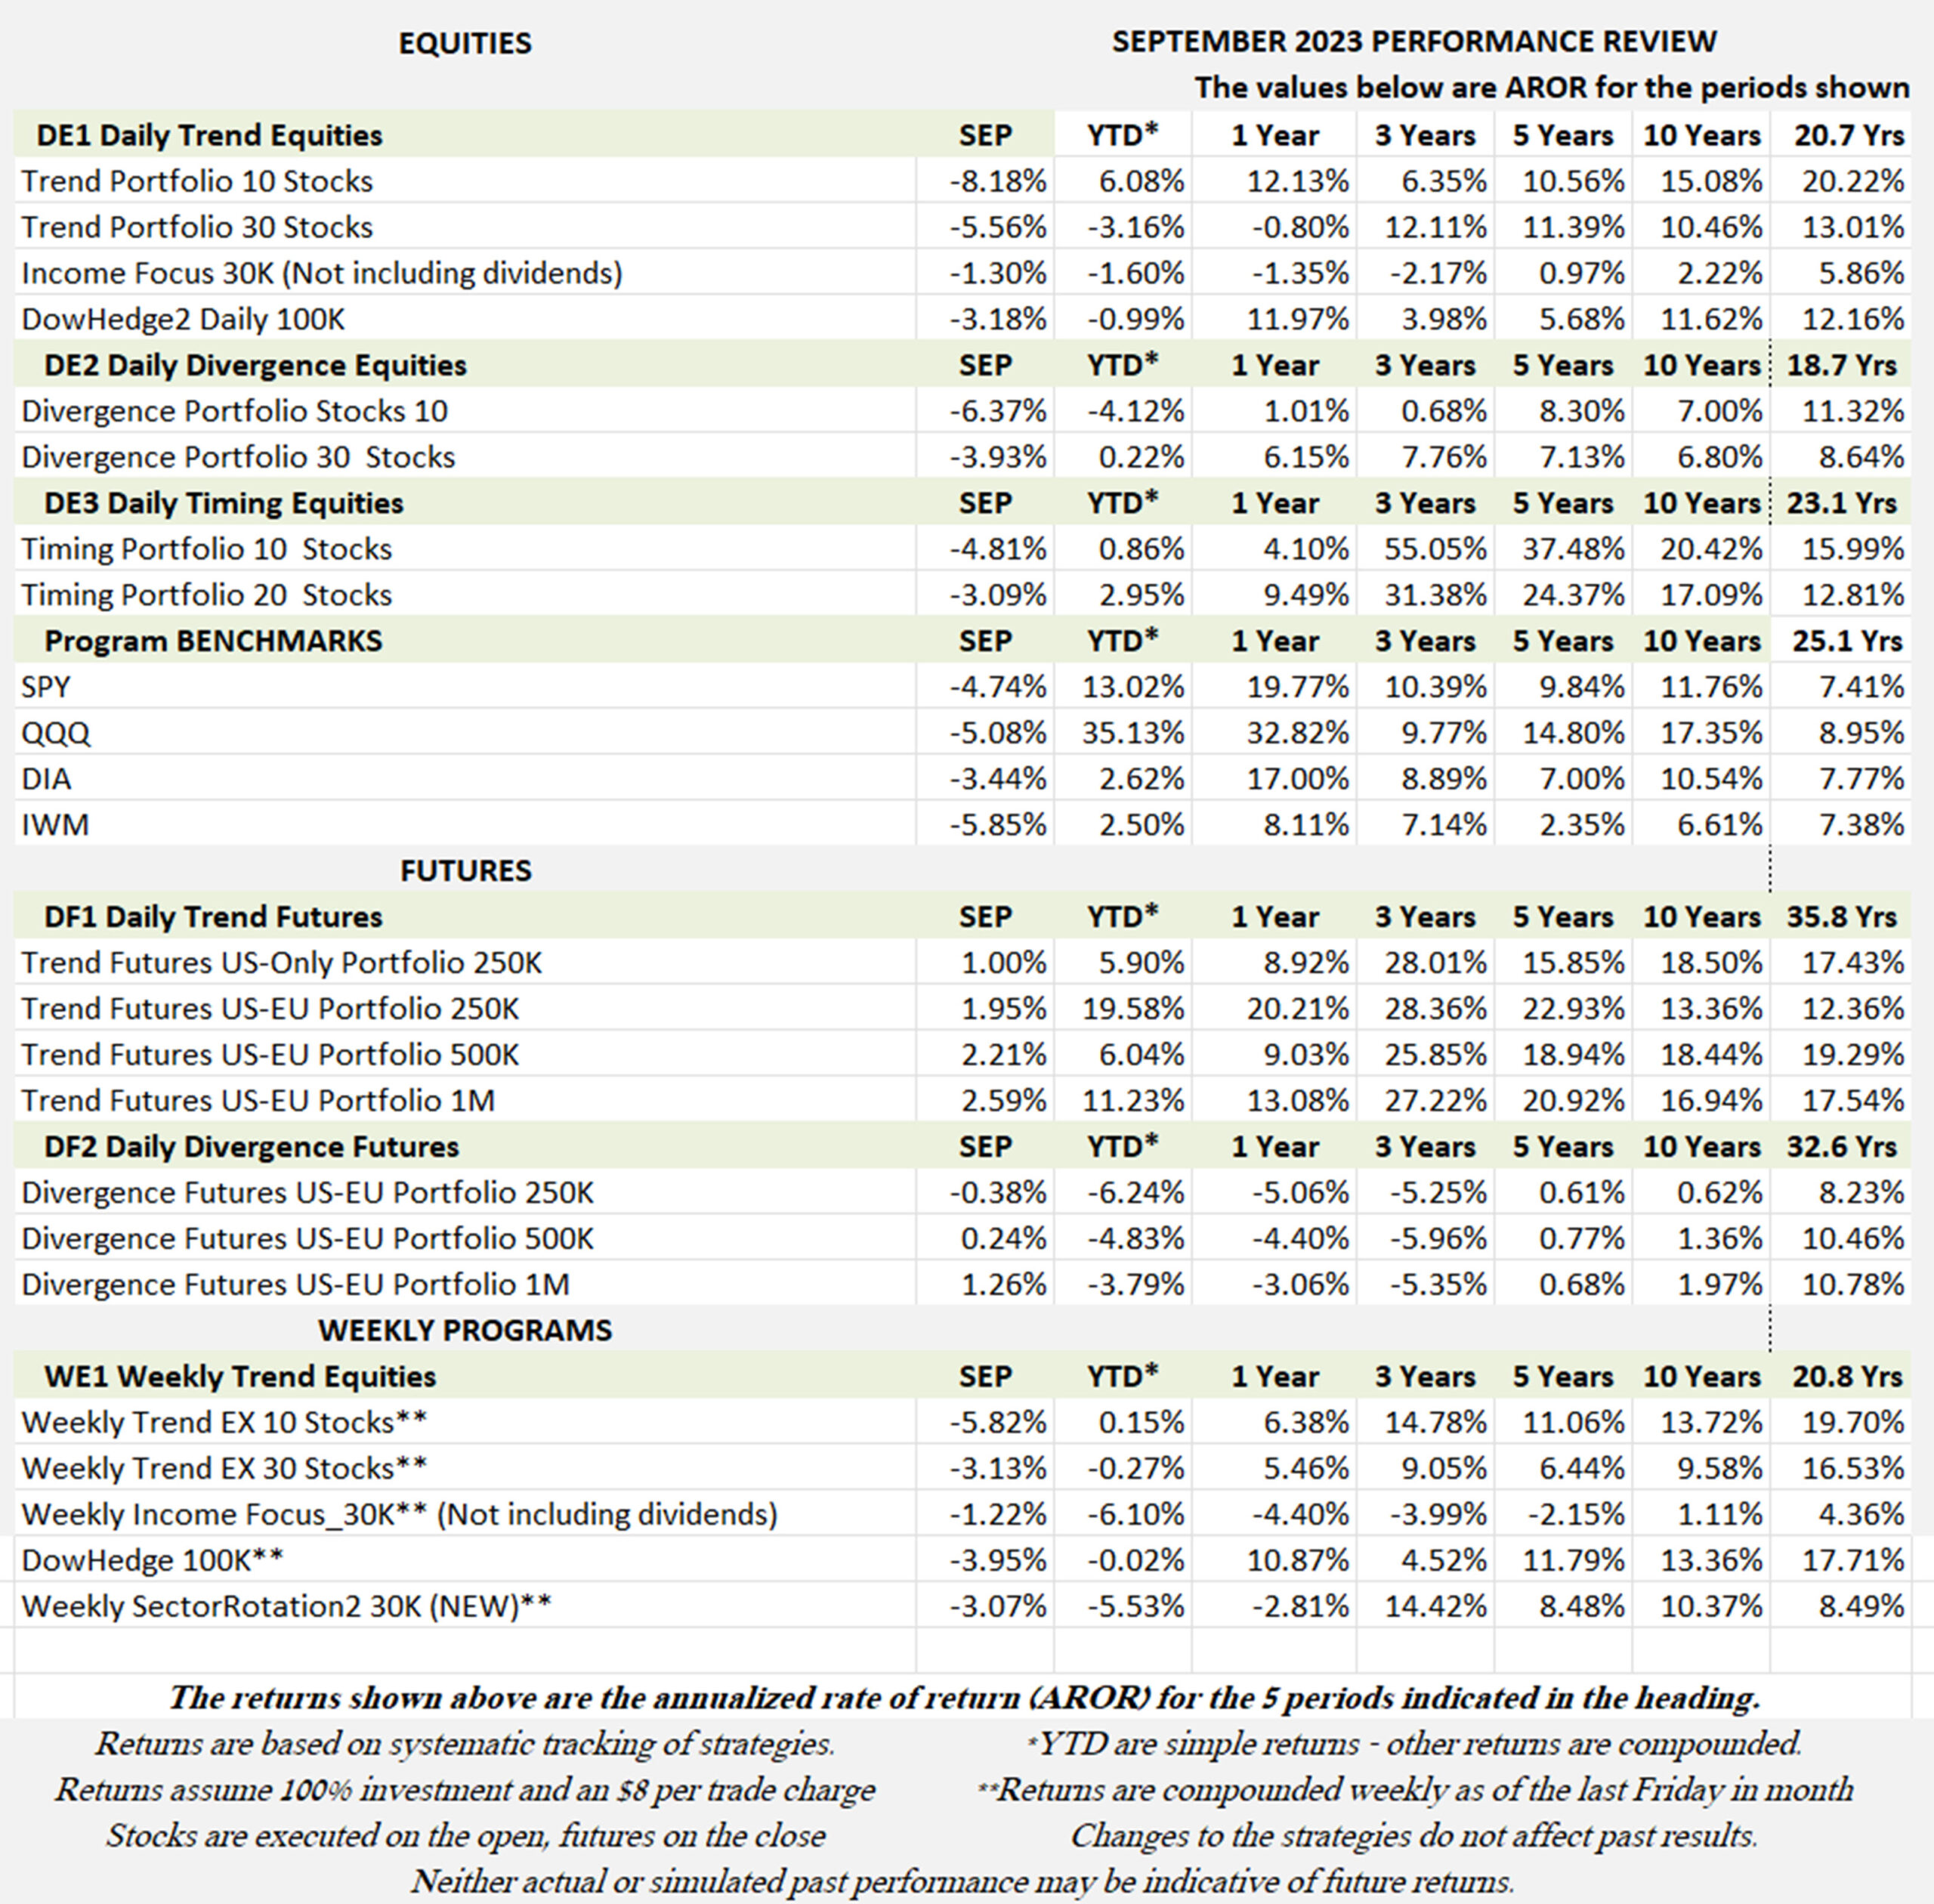
Industry Benchmark Performance
Early reporting shows small losses in equities and small gains in futures. However, both remain positive for the year. Most profits occur when there are strong trends, but this has not been the pattern for the past year. The Industry is holding its own, waiting for better times. That may be as much as we can ask.

Kaufman’sMost Popular Books (available on Amazon)
Trading Systems and Methods, 6th Edition. The complete guide to trading systems, with more than 250 programs and spreadsheets. The most important book for a system developer.
Kaufman Constructs Trading Systems. A step-by-step manual on how to develop, test, and trade an algorithmic system.
Learn To Trade. Written for both serious beginners and practiced traders, this book includes chart formations, trends, indicators, trading rules, risk, and portfolio management. You can find it in color on Amazon.
You can also find these books on our website, www.kaufmansignals.com.
There is a good website for trading books, www.Shepherd.com. Well-known traders recommend books and explain why.
Blogs and Recent Publications
Find Mr. Kaufman’s other recent publications and seminars at the end of this report. We post new interviews, seminars, and reference new articles by Mr. Kaufman each month.
September Performance in Brief
With the exception of Futures, most of our programs took a beating in September. We all know why. The Fed seems to say that it will pause rate hikes, then decides that “one more should be enough.” The market is having a difficult time dealing with that. Most of the equity ETFs failed at previous highs and slumped on disappointment.
However, investors are ever hopeful that this is the bottom. The market will adjust to higher interest rates and after a few weeks, equities should start moving higher. When just never know when.
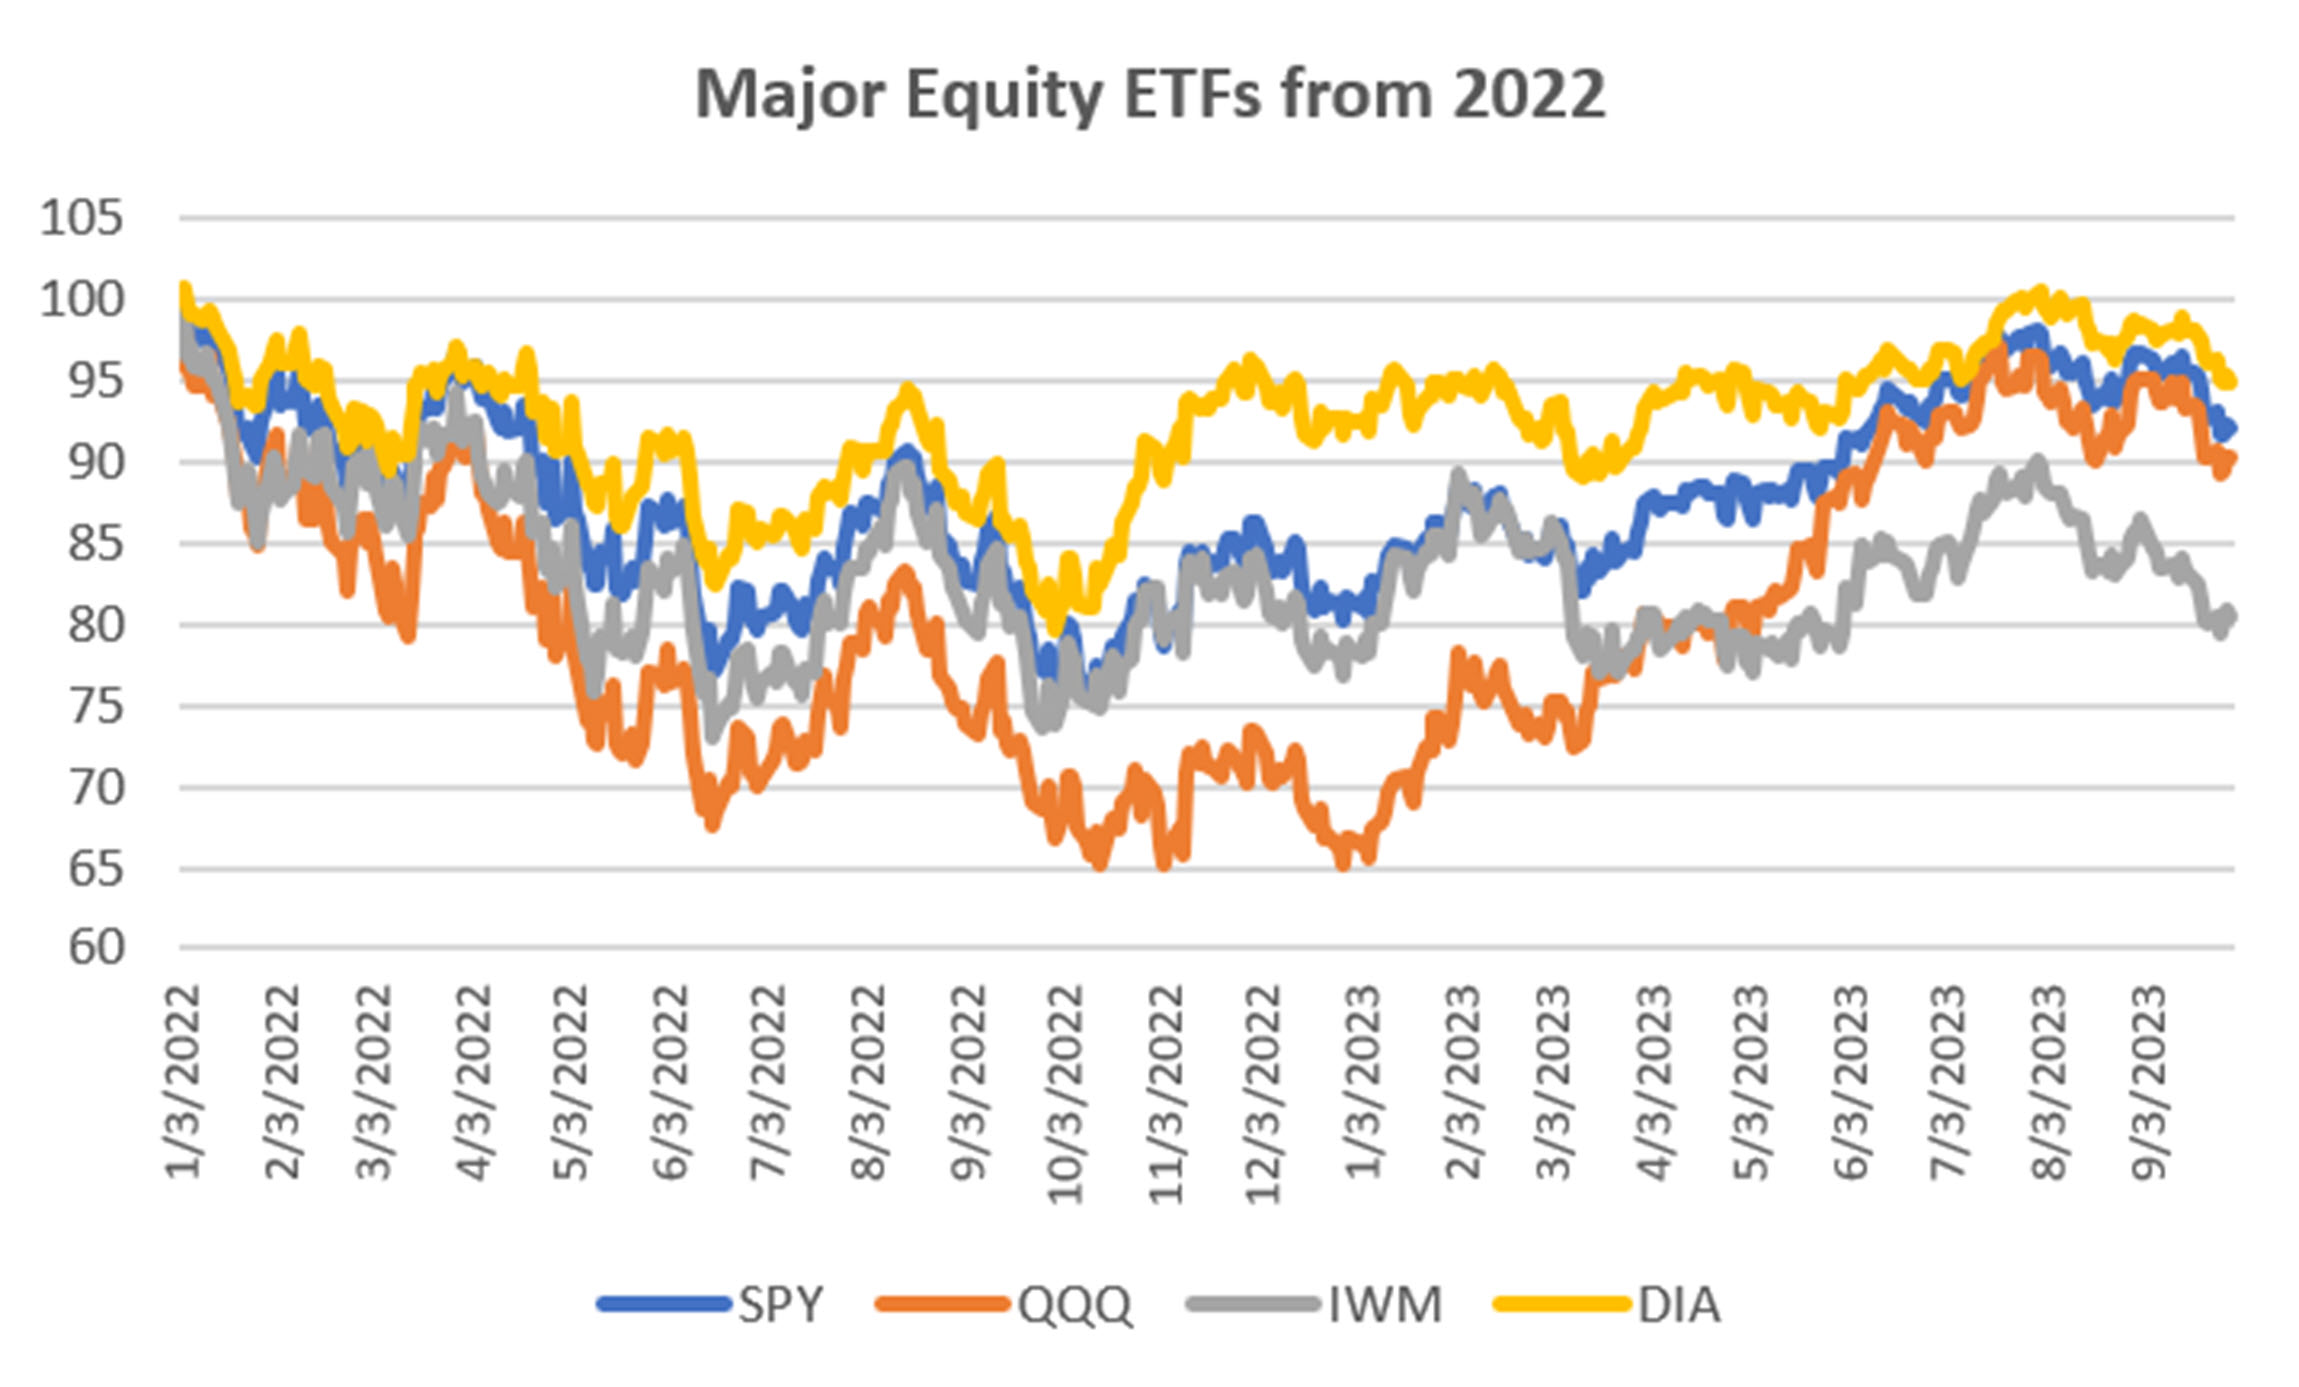
Major Equity ETFs
A 5% loss is pretty big for the equity index markets, but a clear sign of disappointment. We keep waiting for a positive message from the Fed but have not yet received it. Perhaps that is the plan. They don’t need to keep raising rates as long as they keep threatening to do it.
CLOSE-UP: The Case for High-Yield Bonds and Munis
I am writing about high-yield bonds and munis because they offer a good return with low risk. Given the state of the equities market, this could appeal to conservative investors and offer an interesting alternative to diversifying.
I had the pleasure of interviewing Herb Friedman for Technical Analysis of Stocks & Commodities, in the coming November issue. He is a specialist in high-yield interest rates. KaufmanSignals also has a weekly and daily program called Income Focus that trades high-yield bonds (JNK), preferred stocks (PFF), and municipal bonds (MUB), called “munis.” Our program shows the returns of the ETFs without the dividend income, therefore, it understates the total return by quite a lot.
We have left it up to the investor to understand that the returns are actually much higher than shown because the dividends are paid in cash and not reflected in the price series. In this article I will show the approximate returns with and without dividends, although our performance posting will still show returns without dividends.
Since 2007, when these ETFs started trading, dividends have added about 5% per year to the returns.
Some Background on Interest Rates
We should all know that bonds, CDs, and other interest rates that offer higher returns always come with higher risk. The only no-risk investments (theoretically) are U.S. bonds. Corporate bonds vary with the credibility of the company, and municipal bonds with the solvency of the municipality. These can vary considerably. At one time New York City bonds were very high risk. Now they are conservative. Times change.
How Bonds are Rated (from Investopedia)
Rating agencies use several metrics in determining their rating score for a particular issuer's bonds. A firm's balance sheet, profit outlook, competition, and macroeconomic factors determine a credit rating.
Bond ratings are expressed as letters ranging from “AAA”, which is the highest grade, to “D”, which is the lowest grade. Different rating services use the same letter grades but use various combinations of upper- and lower-case letters and modifiers to differentiate themselves.
Yield
The effective yield is the return on a bond that has its interest payments (or coupons) reinvested at the same rate by the bondholder. Effective yield is the total yield an investor receives, in contrast to the nominal yield – which is the stated interest rate of the bond's coupon. Effective yield takes into account the power of compounding on investment returns, while nominal yield does not.
Preferred stocks pay a fixed dividend to shareholders, are prioritized in the event of bankruptcy, and are less impacted by market fluctuations than common stock. Preferred stocks are typically purchased for their consistent dividend payments, which offer less financial risk to shareholders than common stock.
Tax Implications
There are “tax-free” bonds, “triple-tax-free,” etc., depending on where you live and who issues the bond. But we are using ETFs and are only interested in the total return which is the underlying price plus the dividends earned. You will need to refer to a CPA for your tax advice.
Creating the Total Return Price Series
If you download data from Yahoo Finance, you can see the underlying price series and the same series including dividends. When dividends are included, we call that the “total return series.” Chart 1 shows those two series for MUB.
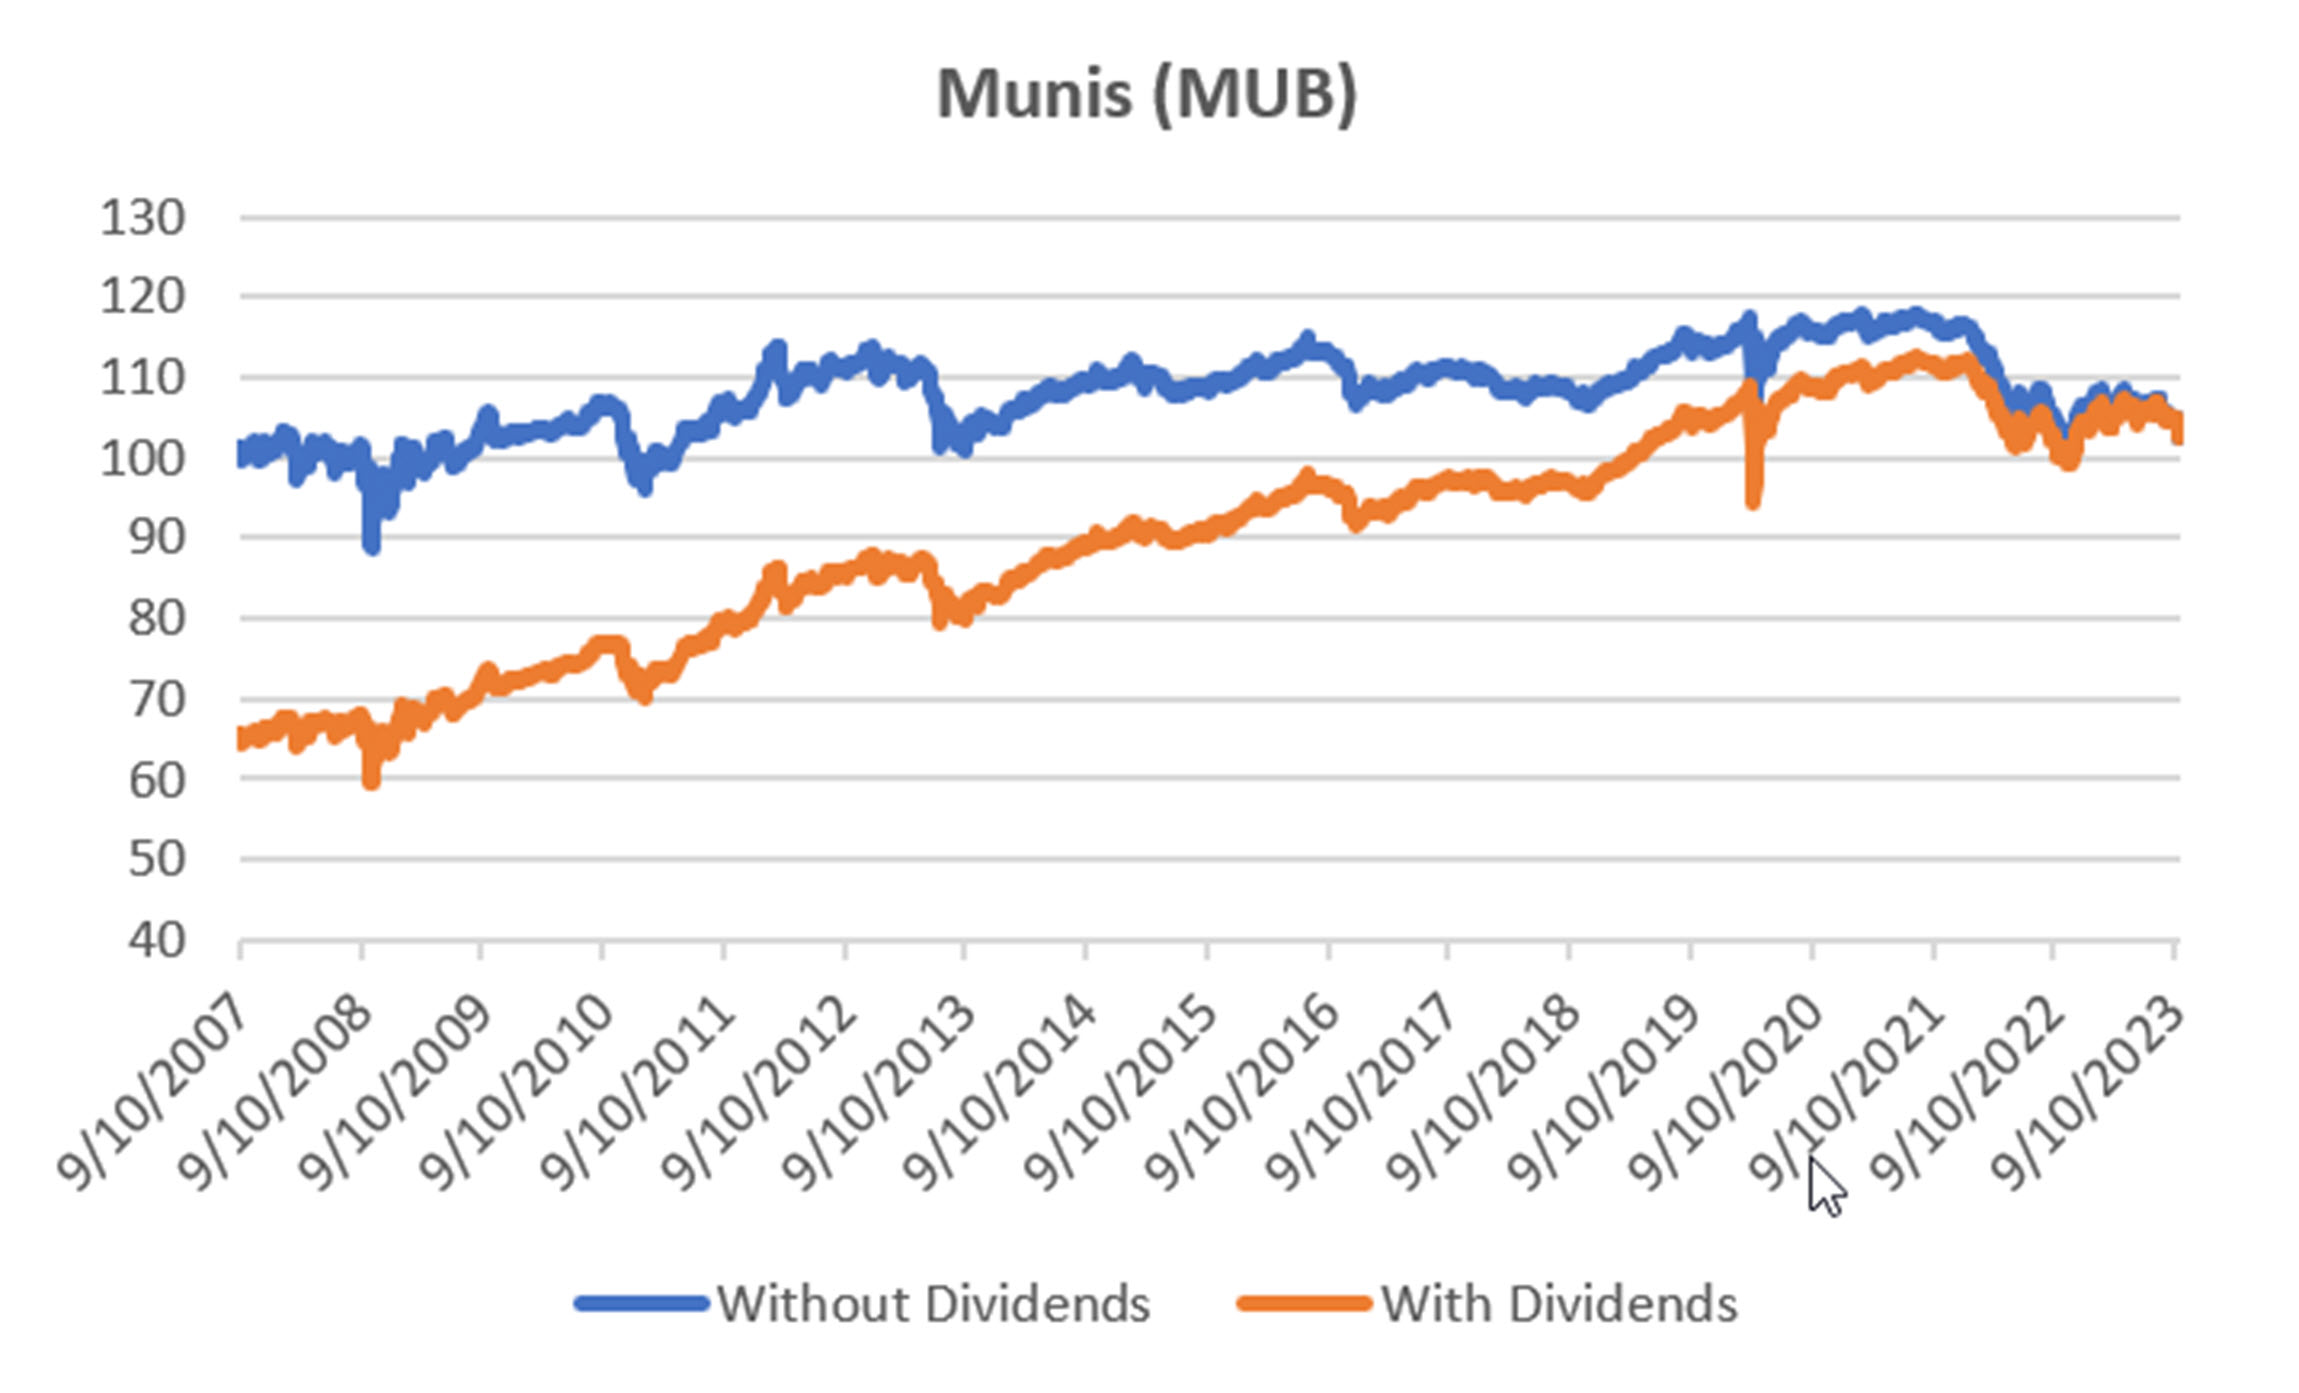
Chart 1. Munis with and without dividend income.
The series including dividends is back-adjusted so the current price is the same as the traded price (without dividends). It is clear that adding dividends gives the series a strong upwards trend and less volatility. Although dividends are received quarterly, the dividend series posts a daily dividend to make the series smooth and avoid quarterly price spikes. Those dividends are shown in Chart 2.

Chart 2. MUB dividends only posted daily.
These charts would look very similar for JNK as well as PFF.
Our Strategy
Our strategy is simple. We use a medium speed moving average and apply that to each of the three interest rates, MUB, JNK, and PFF. Each is allocated $10,000 for a total of $30,000. We take a long position in the ETF when the trend is up. We allocate the full investment equally among whichever ETFs are trending up and go to money market when all the ETFs are trending down. Therefore, we are using all the funds whenever there is at least one ETF trending higher. We apply this approach to the original price series without dividends.
Applying the Dividends to the Strategy After-the-Fact is Tricky
The way in which I have applied the dividends to the strategy is not perfect. Dividends can be applied only when there is a long position. That’s easy. But to get the dividend you must hold a long position on the day it is issued.
Because we are trading, we may enter a long position after the dividend is issued. At other times we might get the full dividend then exit the trade. So the results that I show will not be perfectly accurate, but in my estimate, the results will be close. To make them perfect would take an extraordinary amount of time. So bear with me.
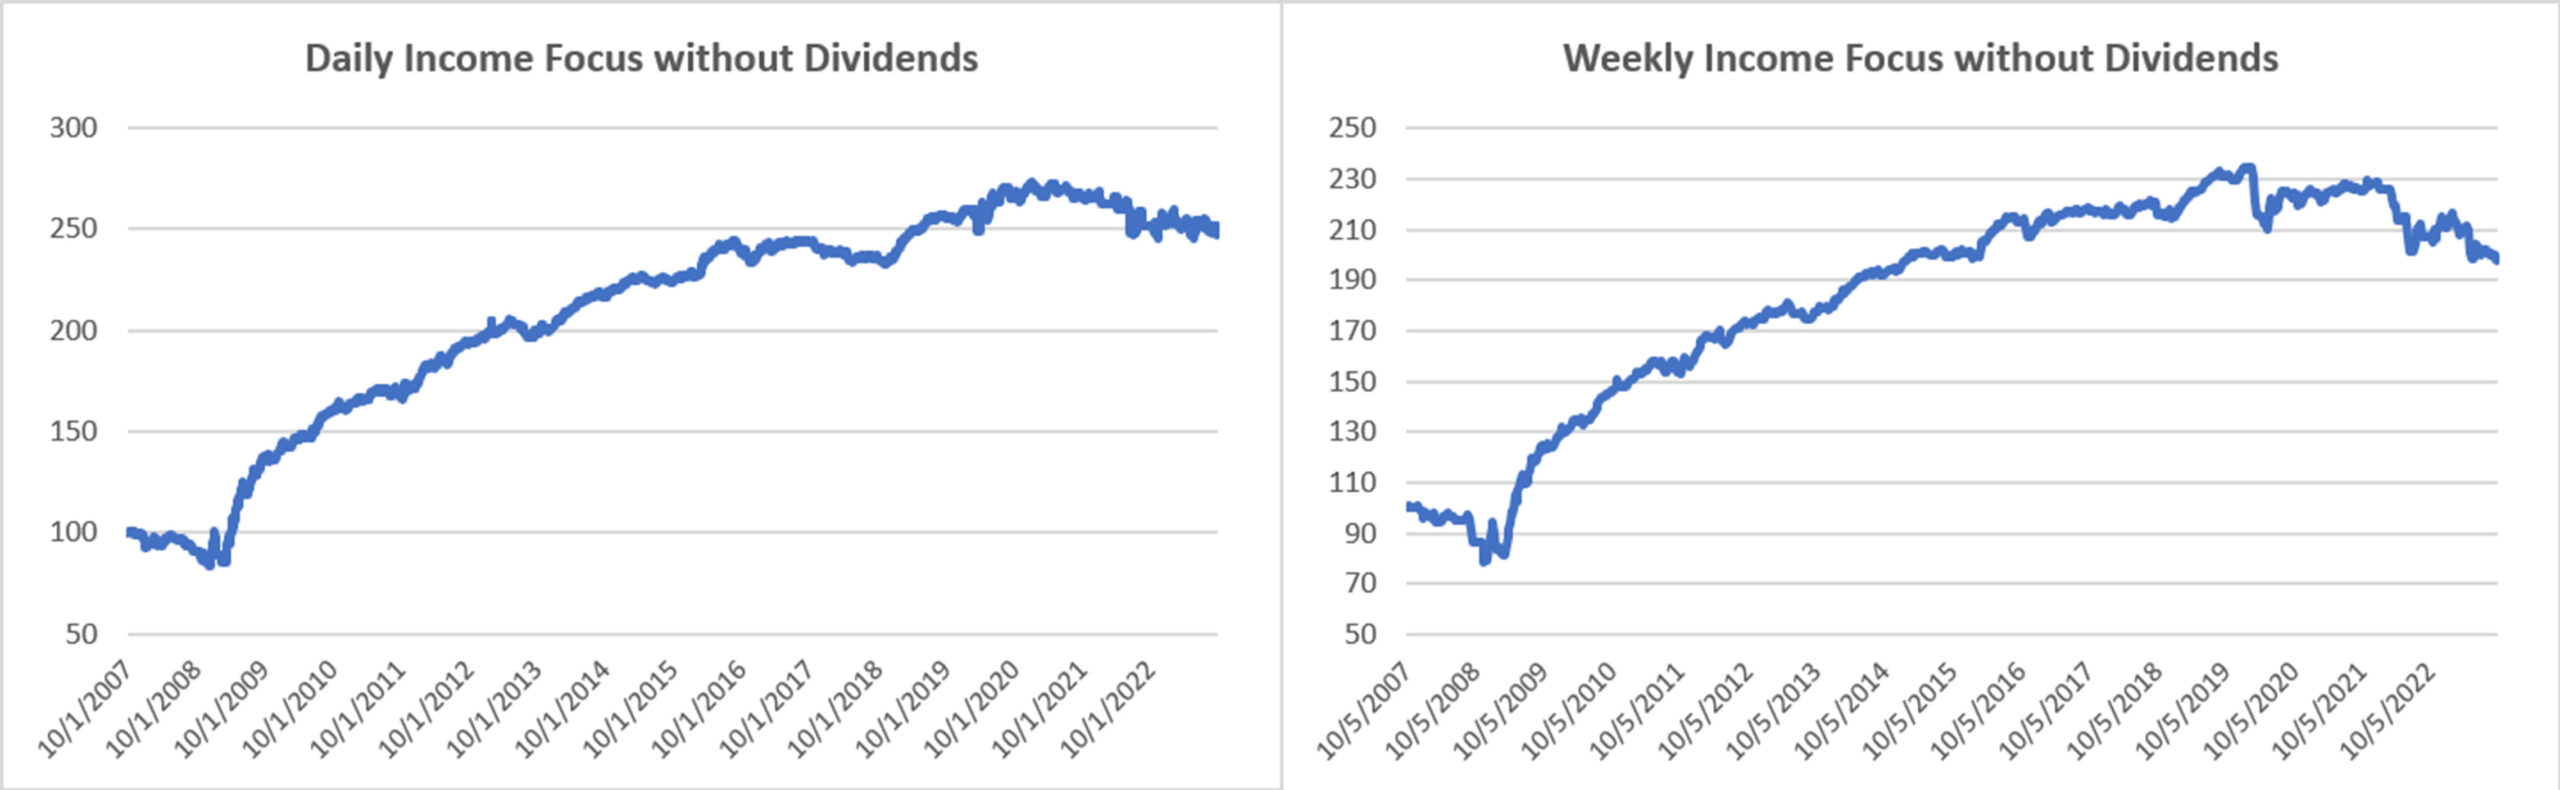
Chart 3 shows the prices series of the three interest rates ETFs without dividends. As you can see, the returns are minimal. MUB shows an annualized return of only 15 basis points (0.0015). When we apply our moving-average strategy it increases to 2.8%. When we add dividends, it goes to about 7.8%. With the strategy applied the volatility is 1.84%, giving it a very position information ratio even before dividends.
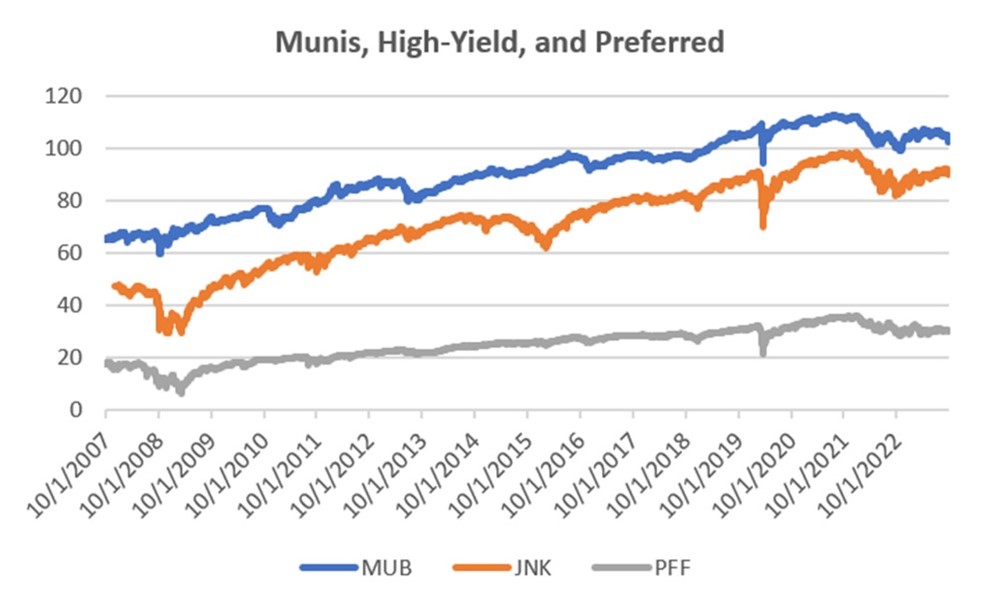
Chart 3. Underlying prices for the ETFs.
Daily Income Focus Estimated Results
I will first apply the dividends to the Daily Income Focus returns. If you have been reading these monthly reports you will be familiar with the return series, shown in Chart 4. The blue line shows the performance of the strategy without dividends. The orange line adds dividends only when we hold a long position regardless of whether we held that position on the day the dividend was issued.
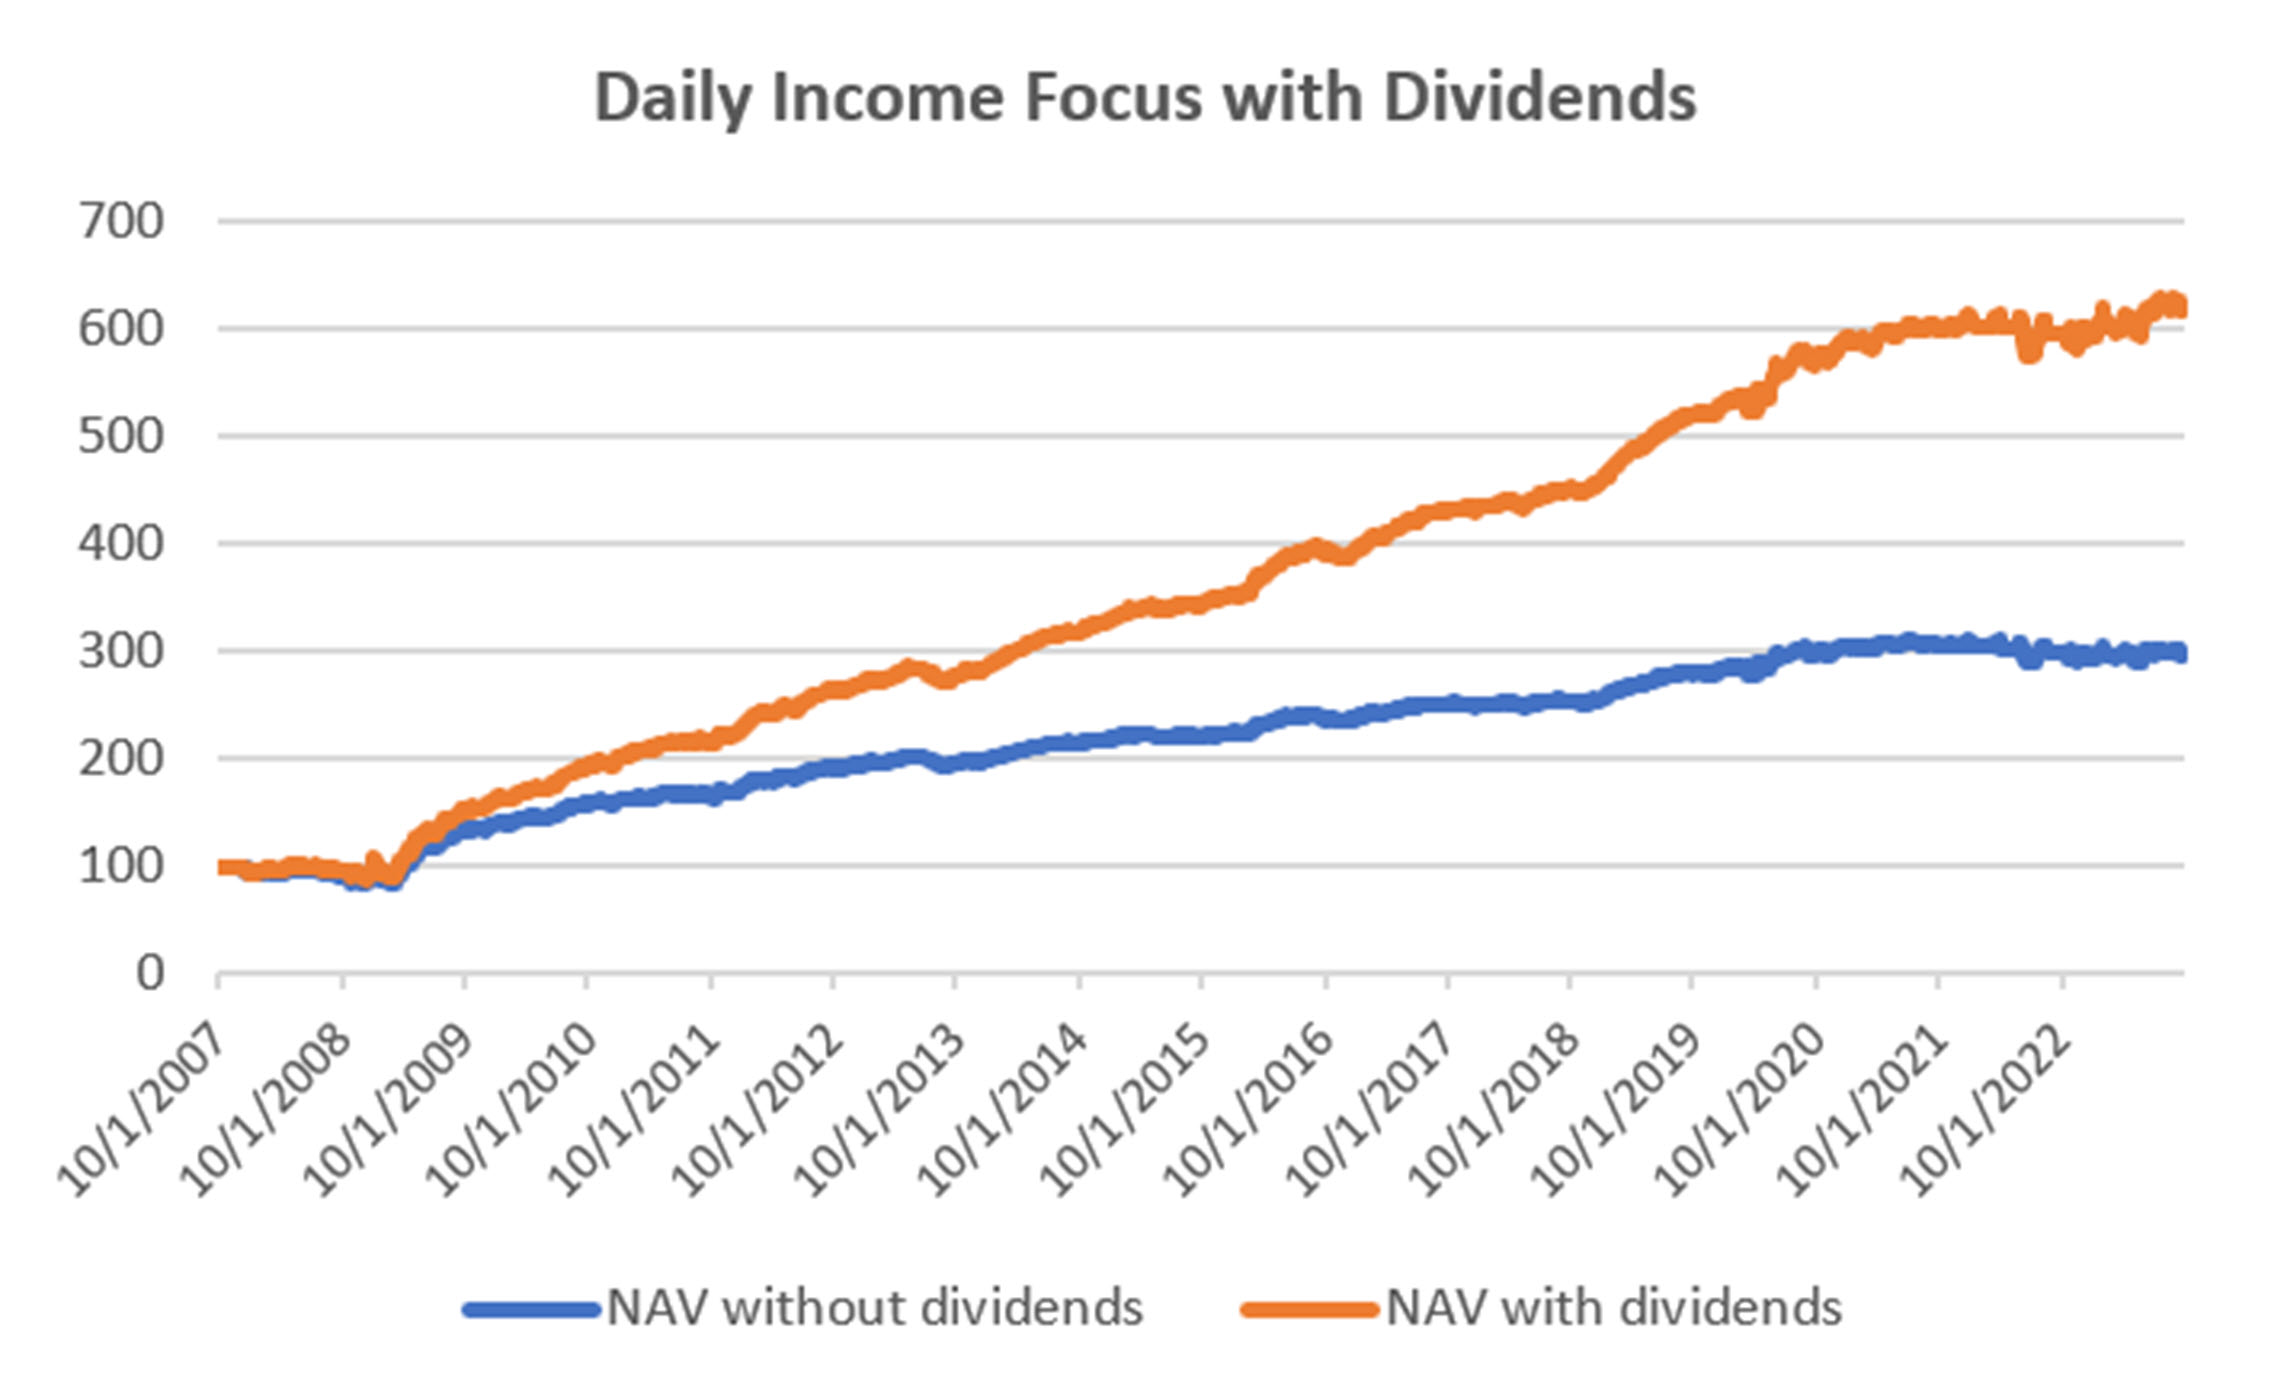
Chart 4. The Daily Income Focus returns with and without dividends.
Looking at the numbers, the original returns show a 7.05% return since 2007, which an annualized volatility of 6.25%. That gives an information ratio of 1.12.
When dividends are added, the returns go to 12.0% with volatility of 6.48% and a ratio of 1.86. You can see that the drawdowns are small because of the nature of the interest rate ETFs and the addition of dividends.
Note that in our performance table, our tracking returns charge $8 per trade, so results are slightly lower.
Weekly Income Focus Results
The Weekly Income Focus program has not performed quite as well as the daily program. Still, the returns and risk are very good. It is even harder to translate the quarterly dividends into weekly dividends and we still have the problem of deciding if we were holding a long position on the day dividends were issued.
Instead, I have simply assumed an average dividend of 5% (as estimated for the daily program) and applied that whenever we held a long position. The result is shown in Chart 5.
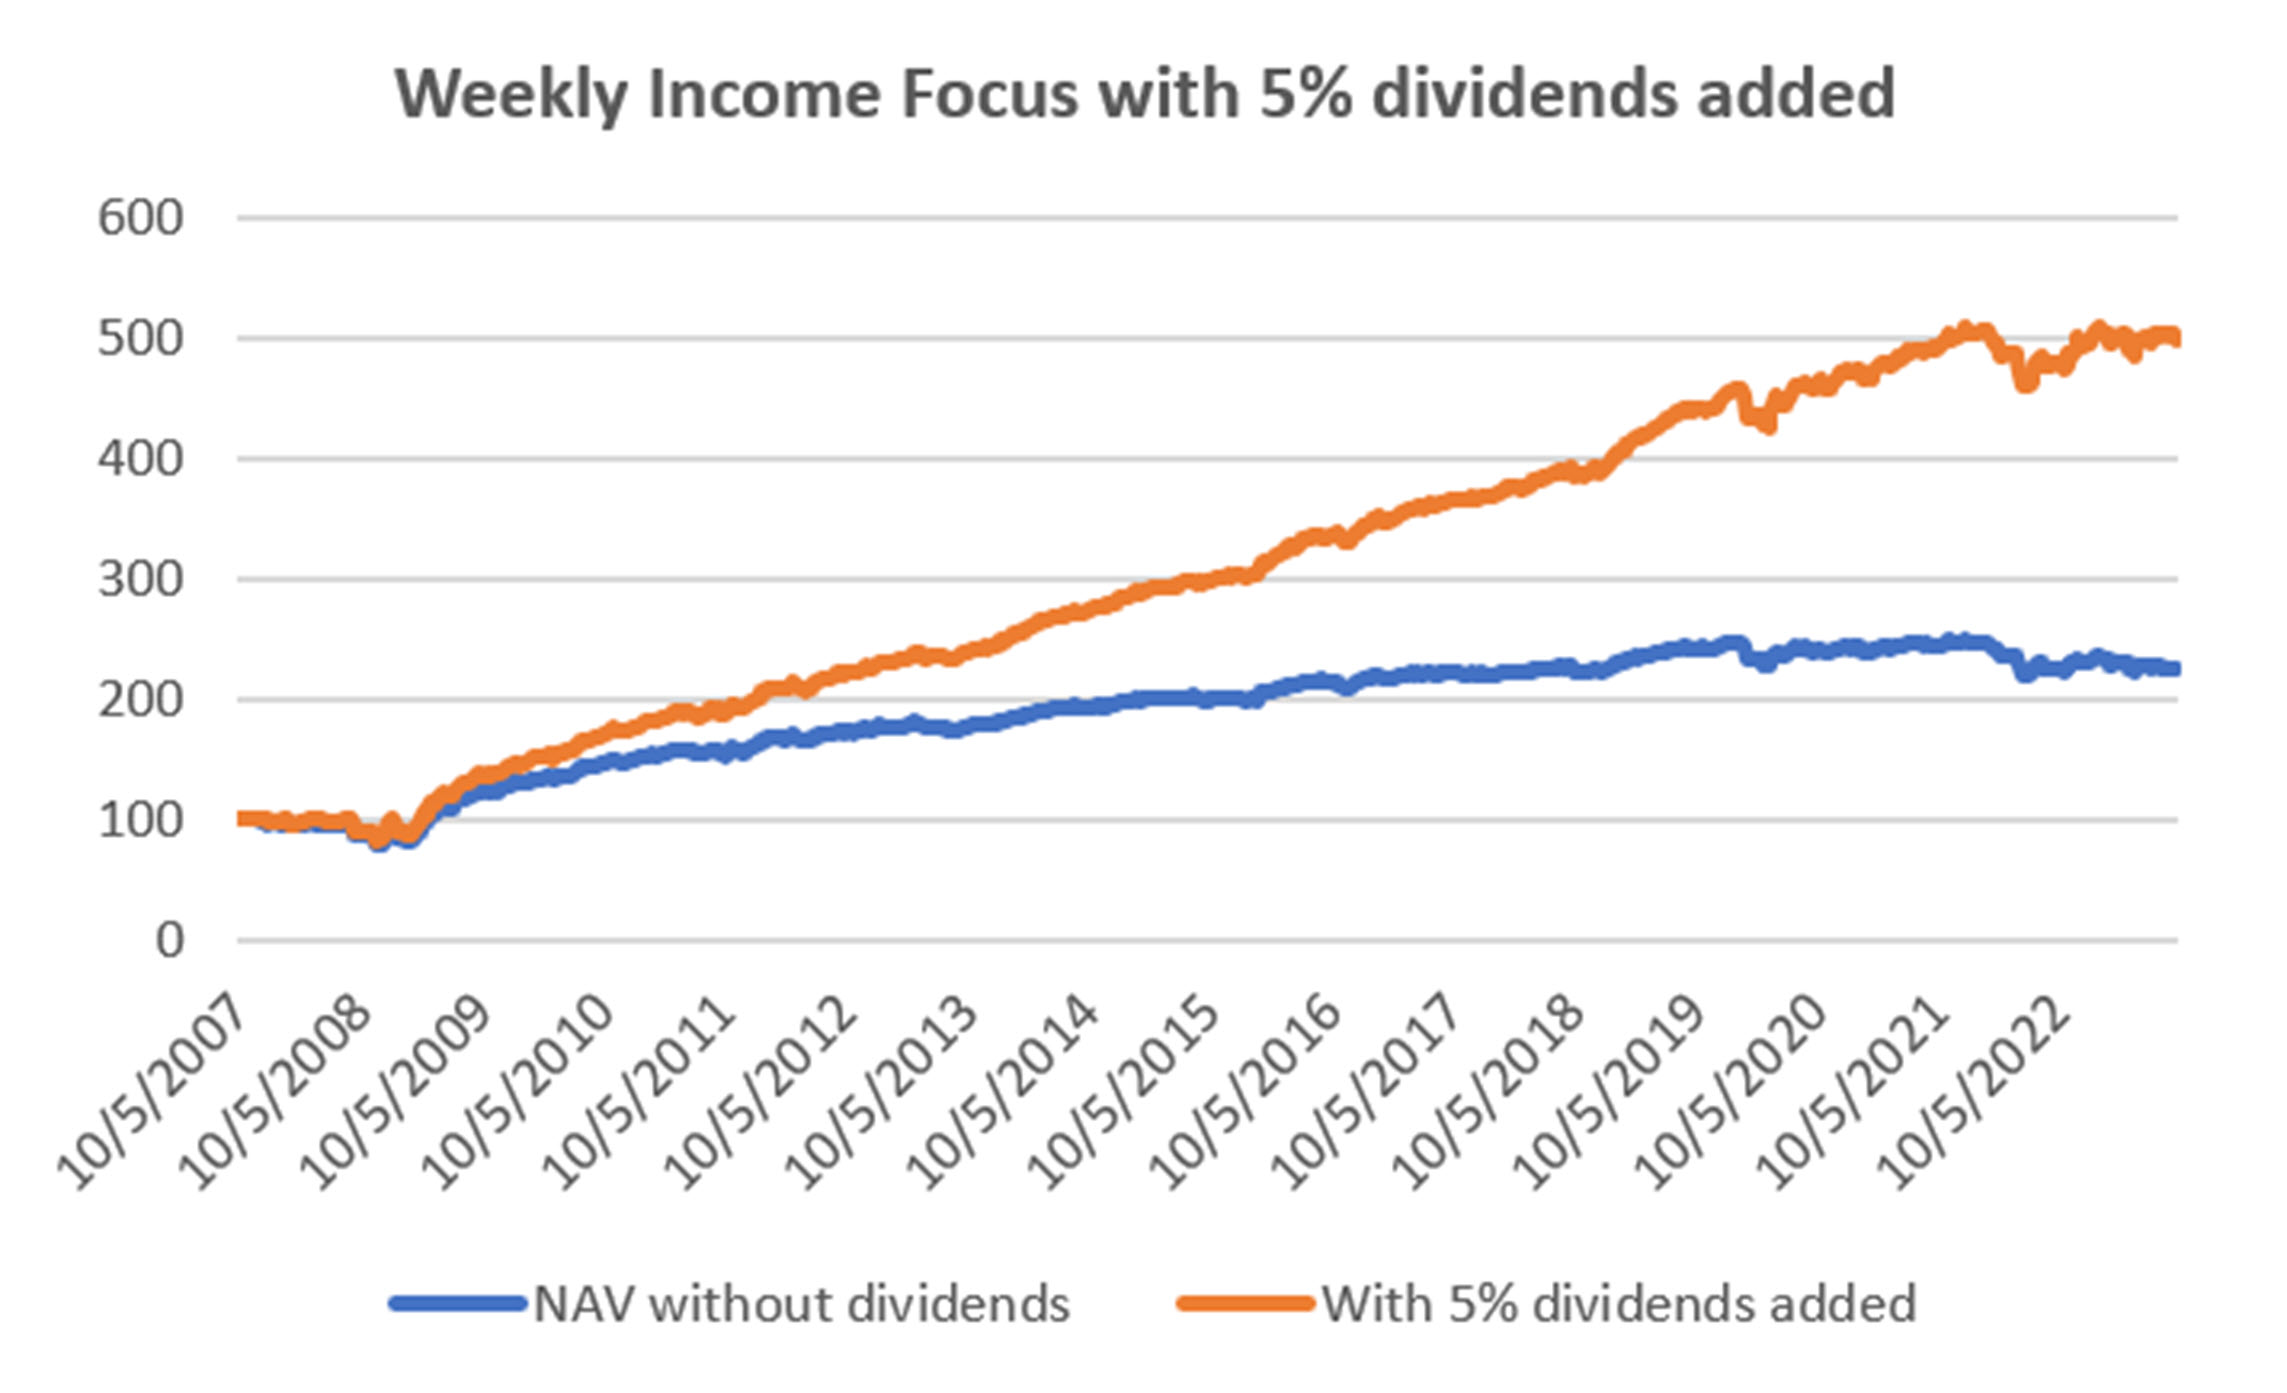
Chart 5. 5% Dividend added to the returns of the Weekly Income Focus Program.
You can see that the Weekly program has been more volatile than the daily program during the past two years, but adding dividends has held returns near their highs.
Summary
Conservative investments deserve a place in a diversified portfolio, more so now that the equity markets are volatile and uncertain. While we cannot show the total returns of the Income Focus programs, conservative investors will find that the returns and risk are very appealing.
A Standing Note on Short Sales
Note that the “All Signals” reports show short sales in stocks and ETFs, even though short positions are not executed in the equity portfolios. Our work over the years shows that downturns in the stock market are most often short-lived and it is difficult to capture with a longer-term trend. The upwards bias also works against shorter-term systems unless using futures, which allows leverage. Our decision has been to take only long positions in equities and control the risk by exiting many of the portfolios when there is extreme volatility and/or an indication of a severe downturn.
PORTFOLIO METHODOLOGY IN BRIEF
Both equity and futures programs use the same basic portfolio technology. They all exploit the persistence of performance, that is, they seek those markets with good long-term and short-term returns on the specific system, rank them, then choose the best, subject to liquidity, an existing current signal, with limitations on how many can be chosen from each sector. If there are not enough stocks or futures markets that satisfy all the conditions, then the portfolio holds fewer assets. In general, these portfolios are high beta, showing higher returns and higher risk, but have had a history of consistently outperforming the broad market index in all traditional measures.
PERFORMANCE BY GROUP
NOTE that the charts show below represent performance “tracking,” that is, the oldest results since are simulated but the returns from 2013 are the systematic daily performance added day by day. Any changes to the strategies do not affect the past performance, unless noted. The system assumes 100% investment and stocks are executed on the open, futures on the close of the trading day following the signals. From time to time we make logic changes to the strategies and show how the new model performs.
Groups DE1 and WE1: Daily and Weekly Trend Program for Stocks, including Income Focus, DowHedge, and the new Sector Rotation
The Trend program seeks long-term directional changes in markets and the portfolios choose stocks that have realized profitable performance over many years combined with good short-term returns. It will hold fewer stocks when they do not meet our condition and exit the entire portfolio when there is extreme risk or a significant downturn.
A larger loss than usual, but still holding gains for the year. The charts show a clear upward bias in performance, but the Fed is not cooperating, trying to discourage business activity. As we mentioned earlier, the Fed is trying to dampen inflation by intimidation, but it’s not working well.

Income Focus and Sector Rotation
Note that the performance shown does not include dividends, which are an important part of the total returns. These results should be added to the dividend income to get the total return. Dividends increase the returns considerably and are the main objective for this strategy. We estimate, in the long-term, that dividends add about 5% per annum to the returns of this strategy.
The chart below shows the difference between the price series for the Municipal Bond ETF with and without dividends for the period from January 1, 2023 through August 31, 2023, eight months. The returns including dividends have netted a gain of about 1% while without dividends there was a loss of nearly 1%. Then trading this program would have added up to 2% through August of this year based on how often the system was long the interest rate ETFs. Since 2007, the system would have been mostly long.
To understand these returns, please read this month’s Close-Up, which explains the way we present the Income Focus returns.
Losses of more than 1% for both the Daily and Weekly Income Focus as rates fluctuate with more volatility than usual. It remains a struggle between investor optimism and a Fed determined to bring inflation down to 2%. That is getting harder with labor unions looking for large increases in salaries, and companies raising prices to offset costs. It seems like a difficult cycle to break.
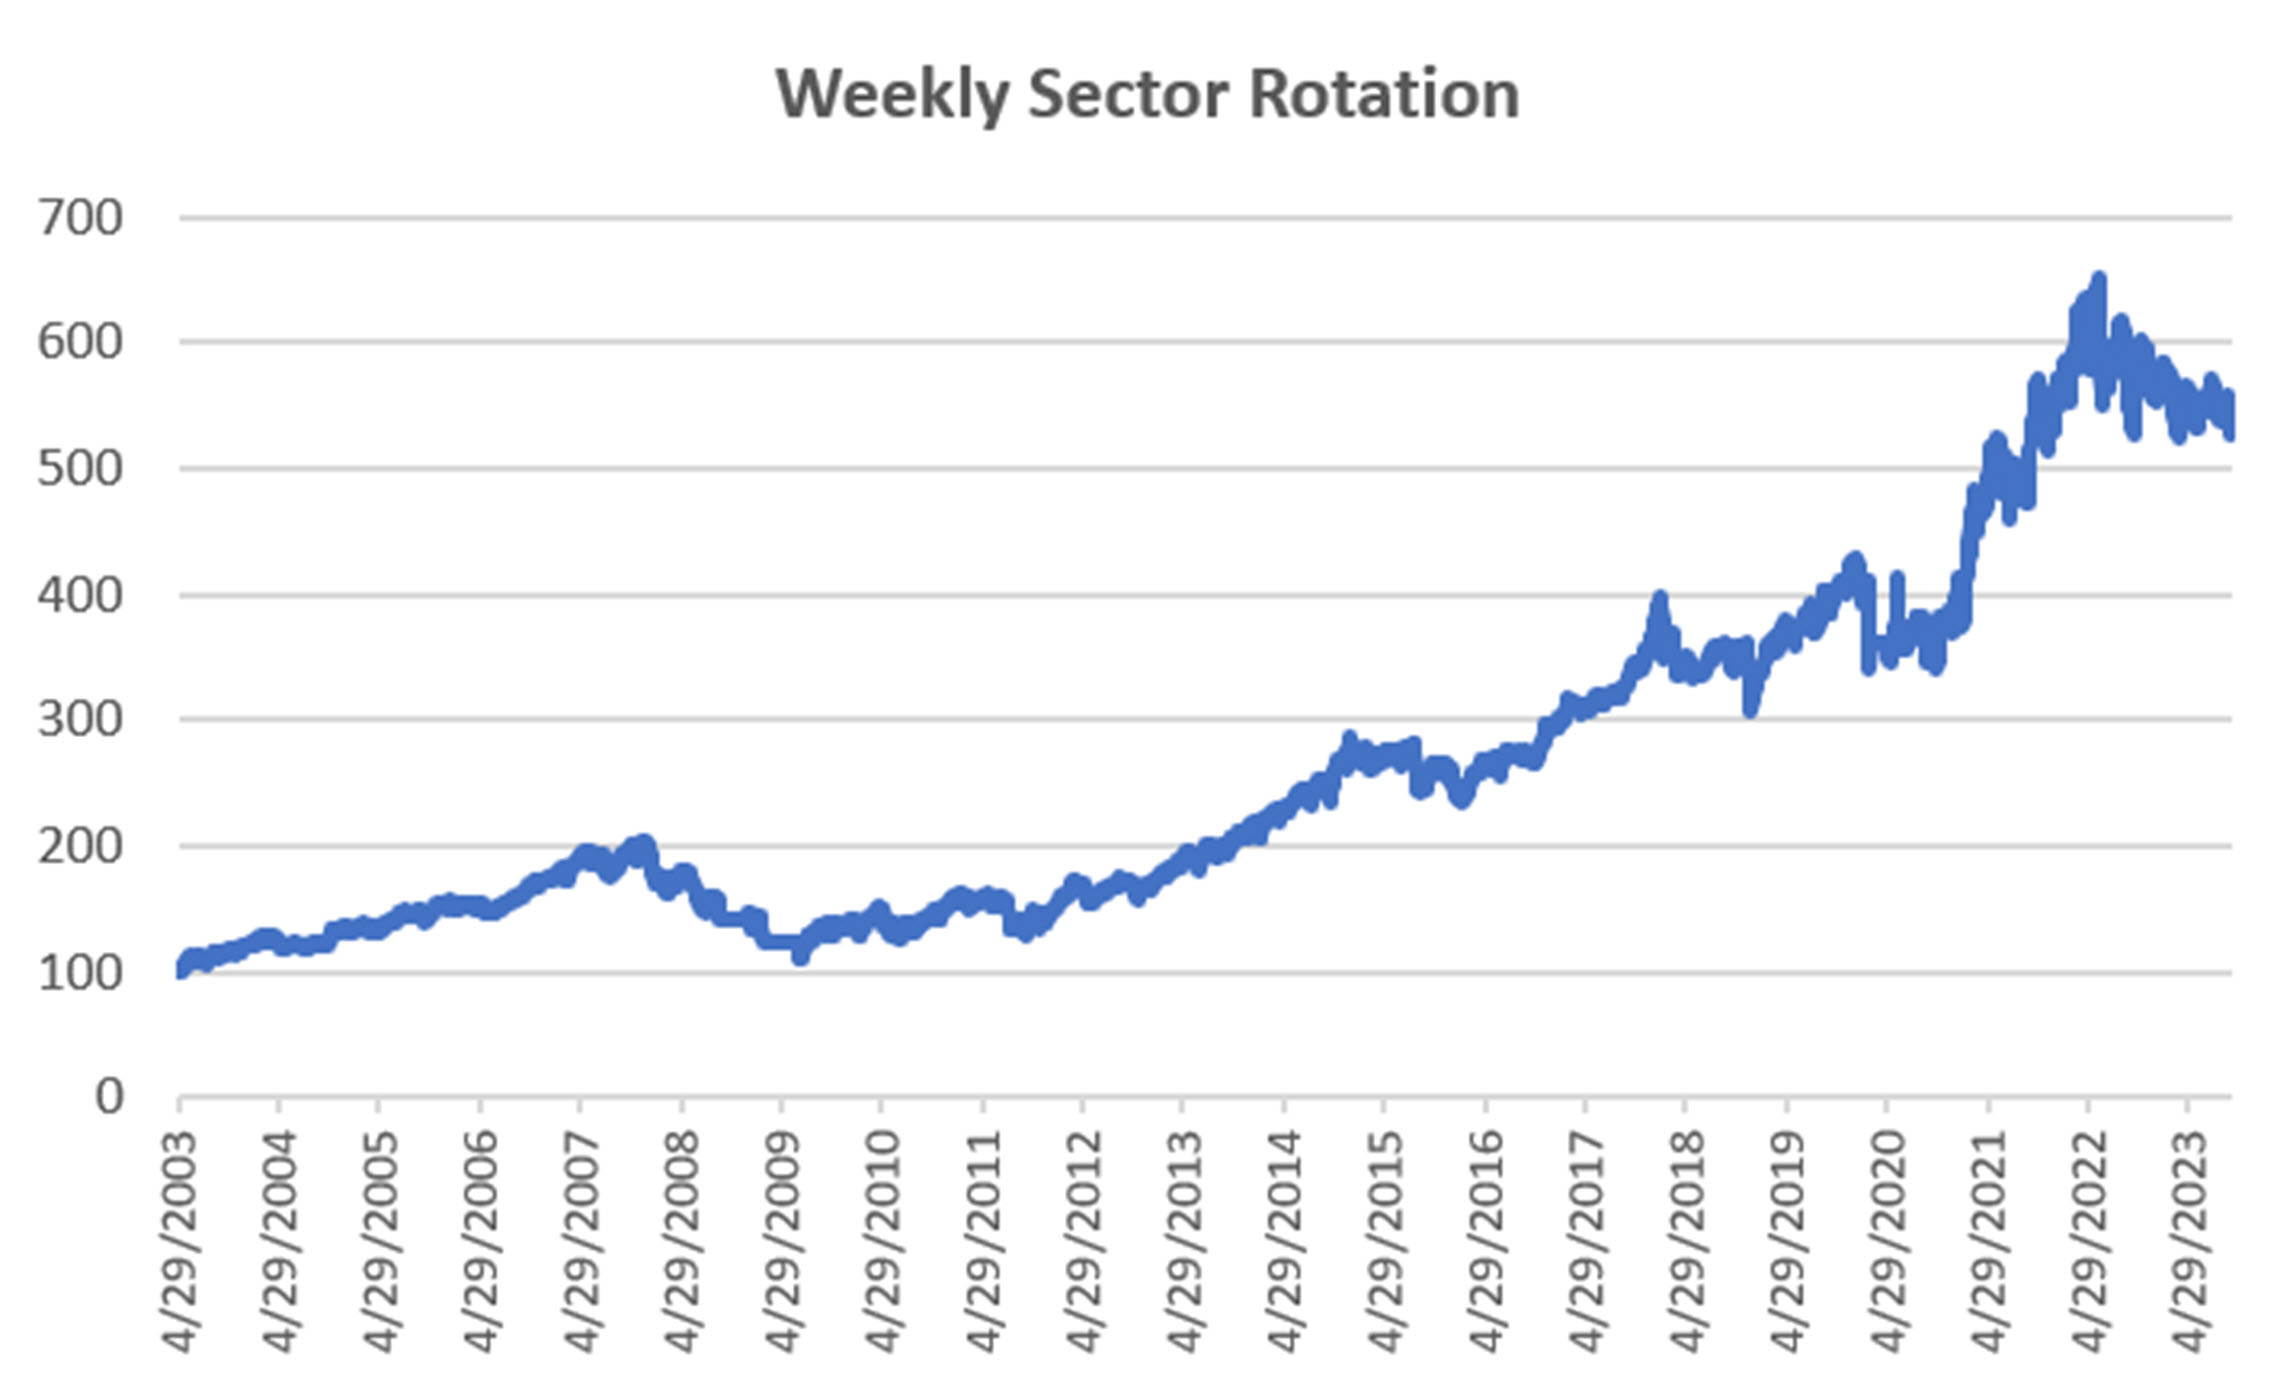
Sector Rotation
September posted a loss of 3%, adding to the 2% loss going into that month. The market has been fickle about switching its focus from technology to staples to whatever seems to be making a short-term push higher. But nothing seems to be gaining traction. We need to be patient while the market finds its way.
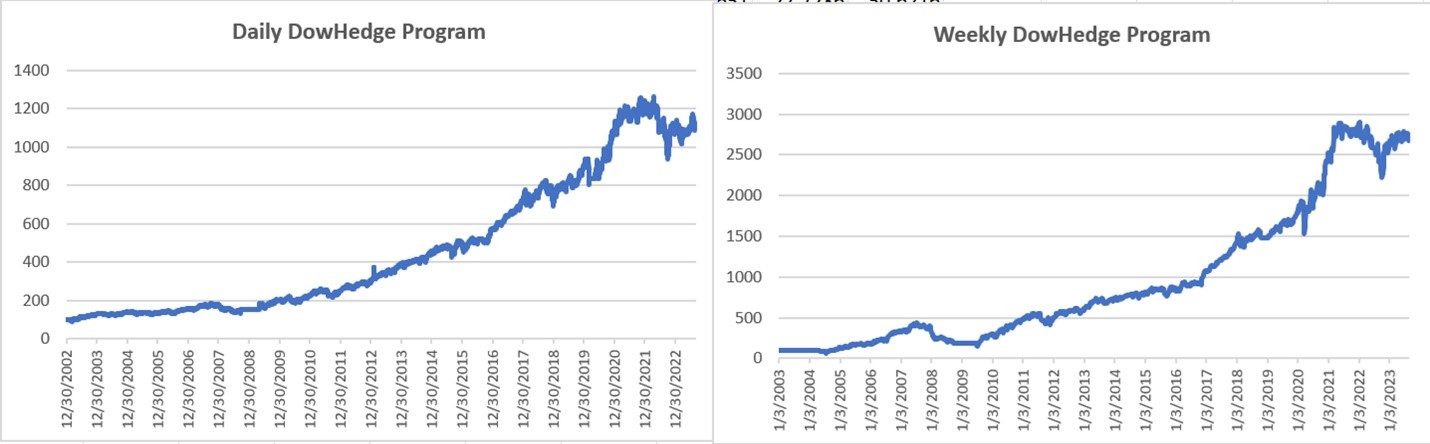
DowHedge Programs
Even the best of the DOW can lose money if all the DOW components decline. The DowHedge program performed the same as the overall DOW index and is fractionally lower for the year.
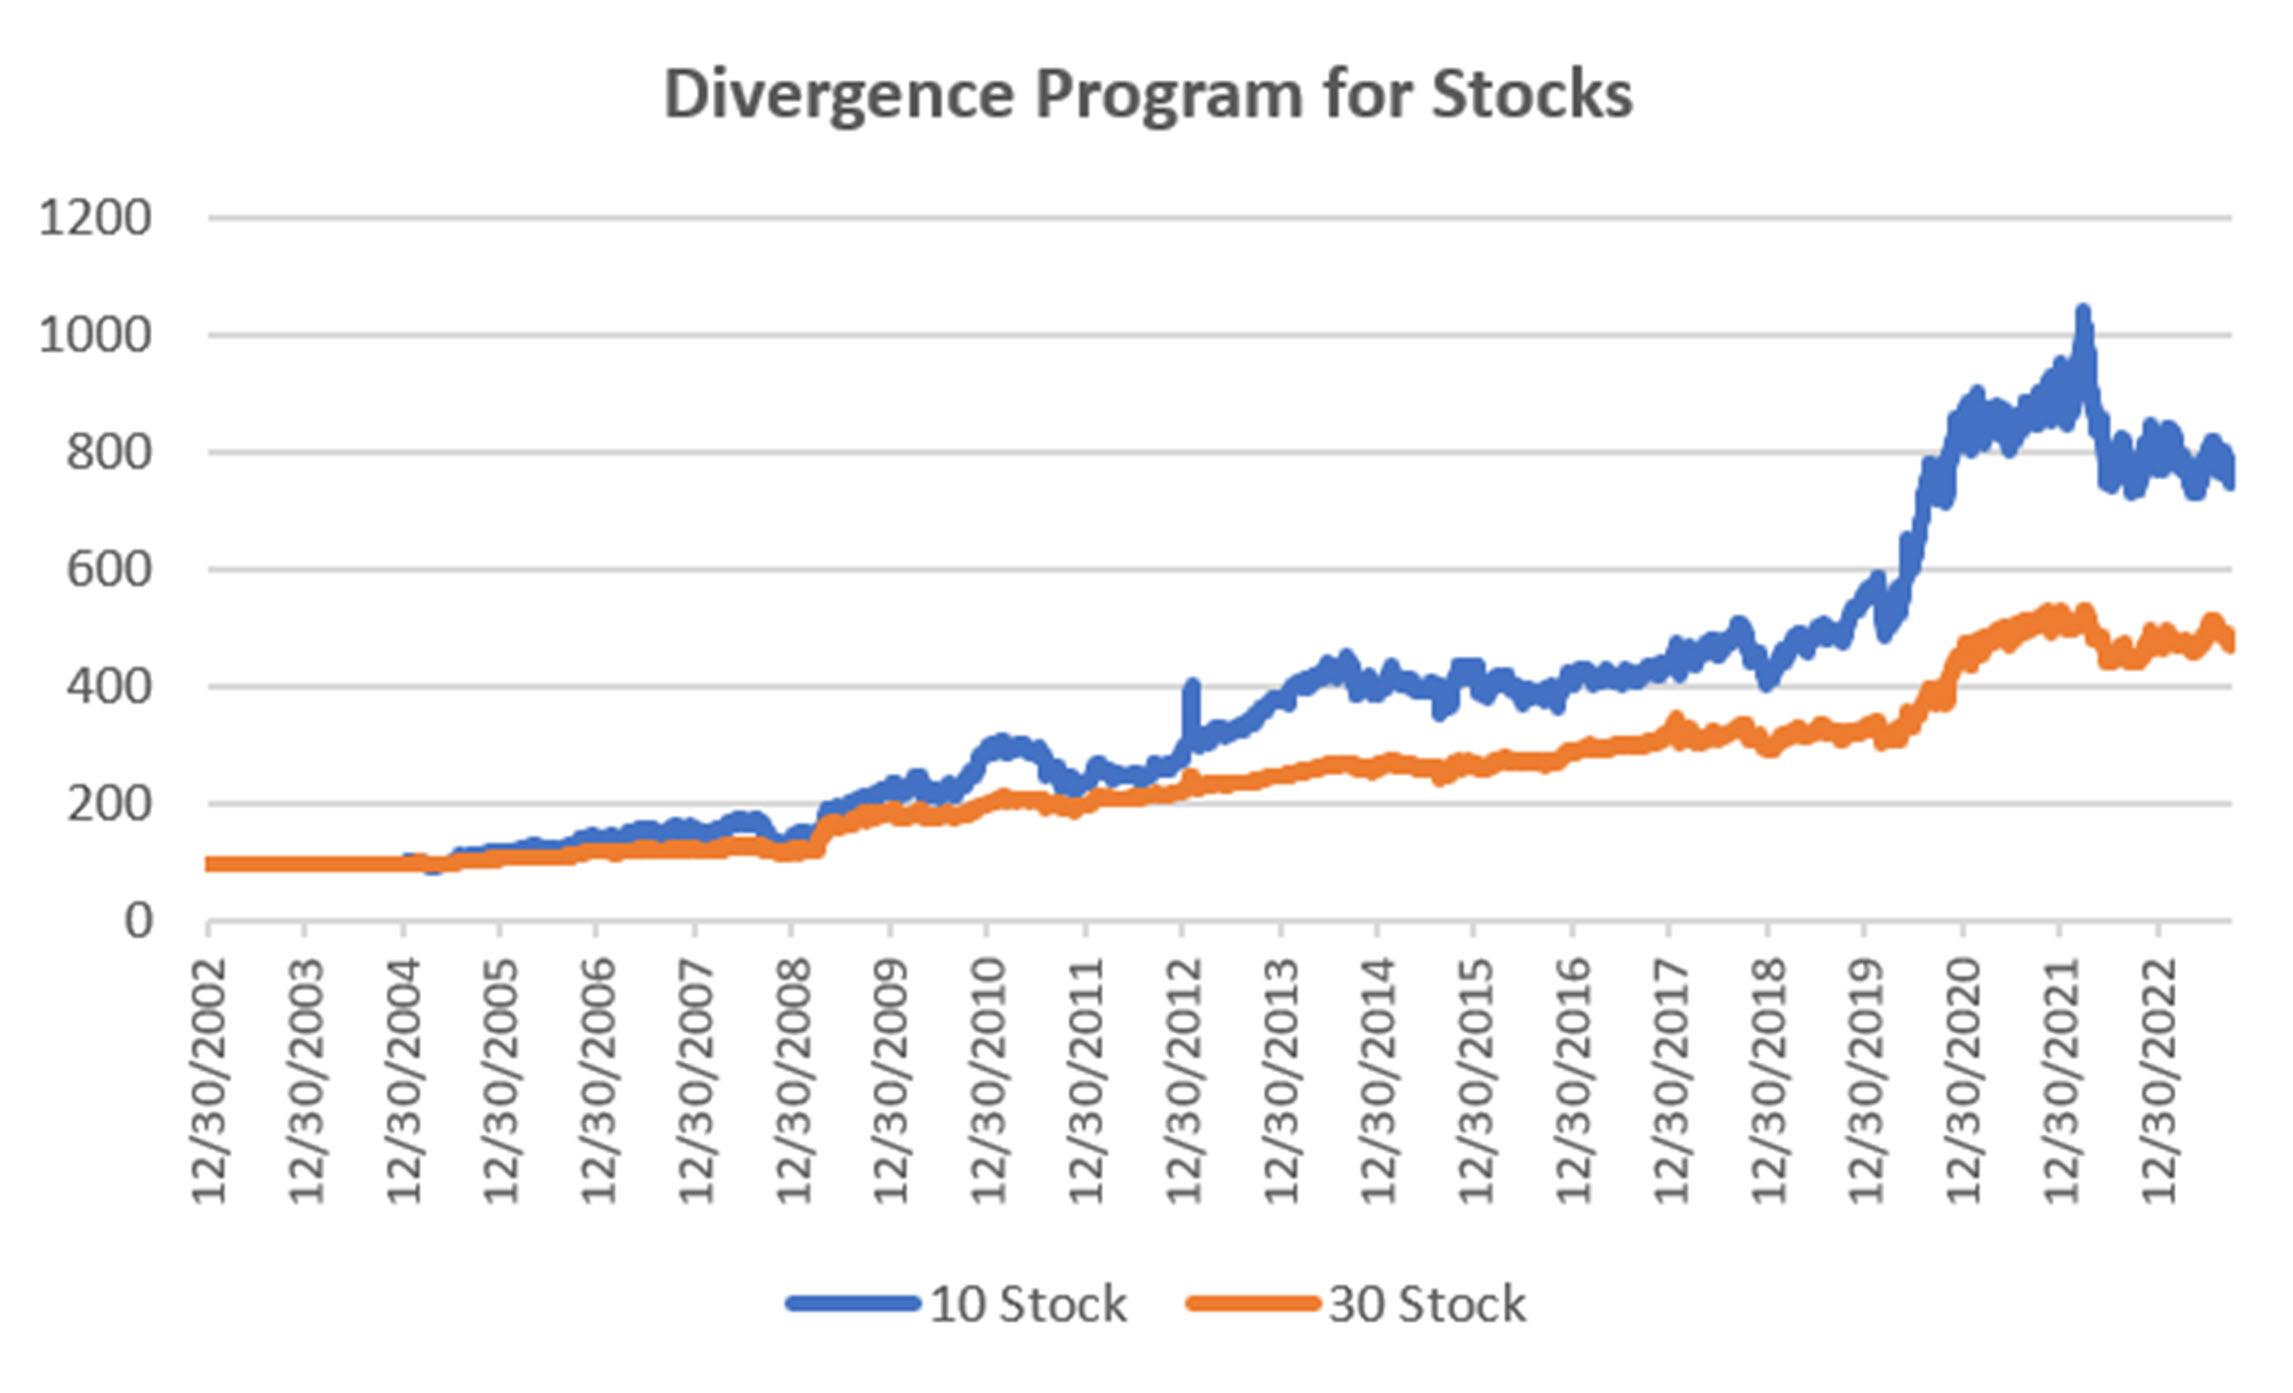
Group DE2: Divergence Program for Stocks
The Divergence program looks for patterns where price and momentum diverge, then takes a position in anticipation of the pattern resolving itself in a predictable direction, often the way prices had moved before the period of uncertainty.
The Divergence Program relies on pauses in a trending pattern. That just doesn’t seem to be happening. What at first appears to be a trend turns out to fail, so entering assuming it will recover has not been a winning strategy. Markets change and will change back.
Group DE3: Timing Program for Stocks
The Timing program is a relative-value arbitrage, taking advantage of undervalued stocks relative to its index. It first finds the index that correlates best with a stock, then waits for an oversold indicator within an upwards trend. It exits when the stock price normalizes relative to the index, or the trend turns down. These portfolios are long-only because the upwards bias in stocks and that they are most often used in retirement accounts.
The Timing Program declined with the S&P and our other equity programs but holds on to gains for the year – an encouraging sign. As with the other programs, this strategy needs follow-through on the upside to capture profits. That is a difficult order to fill recently. But the program is holding losses to a minimum while it waits for the market to settle down.

Futures Programs
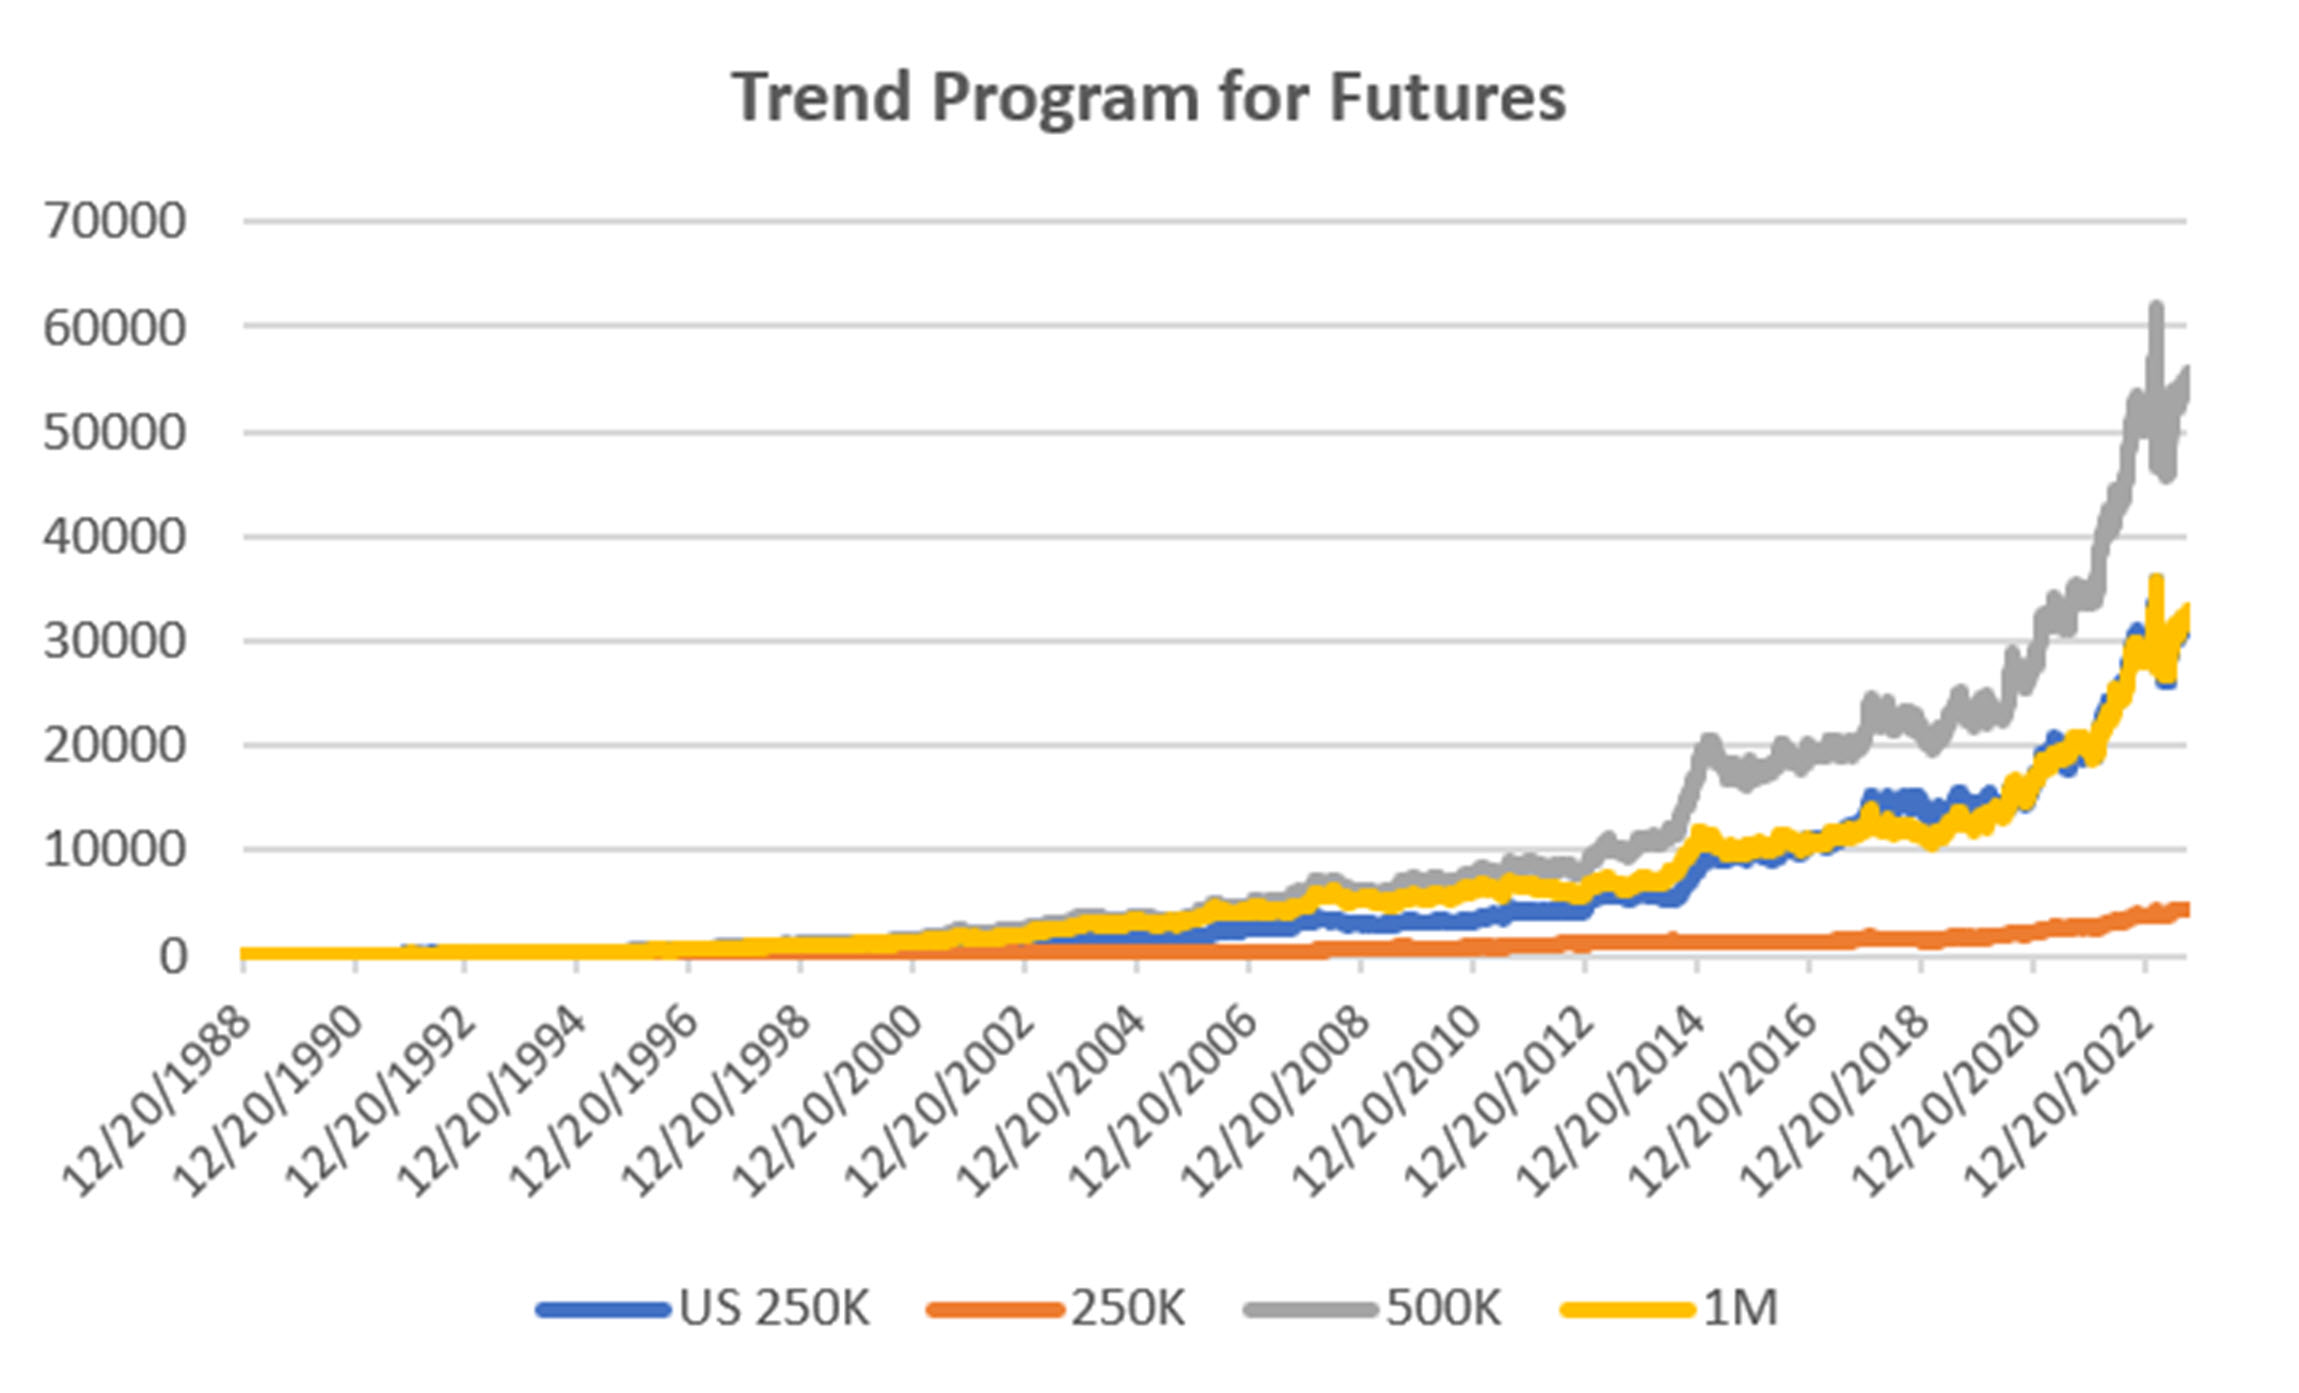
Groups DF1 and WF1: Daily and Weekly Trend Programs for Futures
Futures allow both high leverage and true diversification. The larger portfolios, such as $1million, are diversified into both commodities and world index and interest rate markets, in addition to foreign exchange. Its performance is not expected to track the U.S. stock market and is a hedge in every sense because it is uncorrelated. As the portfolio becomes more diversified its returns are more stable.
The leverage available in futures markets allows us to manage the risk in the portfolio, something not possible to the same degree with stocks. This portfolio targets 14% volatility. Investors interested in lower leverage can simply scale down all positions equally in proportion to their volatility preference. Note that these portfolios do not trade Asian futures, which we believe are more difficult for U.S. investors to execute. The “US 250K” portfolio trades only U.S. futures.
Another month of small gains shows that futures still has the ability to offset equity losses. The portfolios gained 1% to 2.5% in September bringing the year-to-date from 6% to 19%. A piece of sunshine in an otherwise cloudy month. Most of the returns were made in the interest rate market, although the $1M portfolio has now a diversified set of positions. Perhaps the market is starting to trend.
Group DF2: Divergence Portfolio for Futures
Mixed results from a fractional loss to a modest gain in the Divergence portfolios. However, there are still modest losses for the year. This seems to be a common story this year. As with the equity Divergence strategy, this program looks for pauses in a trend and takes a position expecting the trend to continue. That turns out to be a rare event this year.

Blogs and Recent Publications
Perry’s books are all available on Amazon or through our website, www.kaufmansignals.com.
September 2023
In this month’s Technical Analysis of Stocks & Commodities Perry shows how Merger Arb works and how an investor can participate in it. Merger Arb has been the realm of Institutions, but there are opportunities for everyone.
August 2023
Two(!) new articles by Perry in the August issue of Technical Analysis of Stocks & Commodities. The first is a look at how ChatGPT might help traders. It even asks for a computer program to use trend following.
The second article is “Portfolio Risk Dilemma,” where Perry answers the question of whether to let a stock or futures profit run or rebalance, and whether you should do the same for a diversified portfolio.
June 2023
Another article in Technical Analysis, “Protecting Your Wealth While Making a Profit.” It shows that moving money into different world equity markets can take advantage of momentum in both price and exchange rates.
May 2023
A new post on Seeking Alpha, “Profiting From Green Energy – But Not EVs” on May 31. Shows which stocks are best for investing in energy given the moving targets.
April 2023
On April 18th, Perry gave a webinar to the Society of Technical Analysts (London) on how to develop and test a successful trading system. Check their website for more details, https://www.technicalanalysts.com..
The April issue of Technical Analysis of Stocks & Commodities published a new article by Perry, “Repatriation,” an interesting trading pattern used by FX traders but adapted for us “normal traders.”
March 2023
Perry was interviewed by Mark Ursell of Ursell of TradeInform on March 3. You can see it or listen to it on UTube https://www.youtube.com/watch?v=9gIlIIzngCk. https://spotifyanchor-web.app.link/e/DlhN35101xb
A new article by Perry, “Can Volume Predict Price?” in the March issue of Technical Analysis of Stocks & Commodities. You’ll need to read it to find out!
February 2023
The February 2023 issue of Technical Analysis of Stocks & Commodities published Perry’s article, “Do Small Price Changes Matter?” It tells you whether you should be ignoring those days when prices close up or down by a fraction.
Perry gave a webinar to Eduardo Lopez’ Robotrader students in Spain on Wednesday, February 8, noon (New York).
January 2023
Another year! Technical Analysis of Stocks & Commodities published “Matching the Markets to the Strategy” in the January issue. It is a look at why certain markets do best with specific strategies and why that can materially improve results.
Alejandro de Luis will publish Perry’s article “Living Off Profits,” translated into Spanish, in the January issue of his magazine, Hispatrading. It’s a good way to practice your Spanish!
Seeking Alpha posted Perry’s article, “How To Hedge Your Equity Portfolio,” showing a way to follow the Fed action.
October 2022
An interview with Perry was featured in the October anniversary issue of Technical Analysis of Stocks & Commodities. The interviewer is his wife, Barbara Diamond, giving a different perspective on his career.
Older Items of Interest
Perry’s webinar on risk, given to the U.K. Society of Technical Analysts, can be seen using the following link: https://vimeo.com/708691362/04c8fb70ea
For older articles please scan the websites for Technical Analysis of Stocks & Commodities, Modern Trader, Seeking Alpha, ProActive Advisor Magazine, and Forbes. You will also find recorded presentations given by Mr. Kaufman at BetterSystemTrader.com, TalkingTrading.com, FXCM.com, systemtrade.pl, the website for Alex Gerchik, Michael Covel’s website, TrendFollowing.com, and Talking Trading.com.
In May 2021, Mr. Kaufman gave a 30-minute presentation, “Lagged Trends,” for The Money Show on Tuesday, May 11. You can see it using the following link: https://youtu.be/bh2fA8oBwBk
You will also find back copies of our “Close-Up” reports on our website, www.kaufmansignals.com. You can address any questions to perry@kaufmansignalsdaily.com.
© September 2023, Etna Publishing, LLC. All Rights Reserved.