
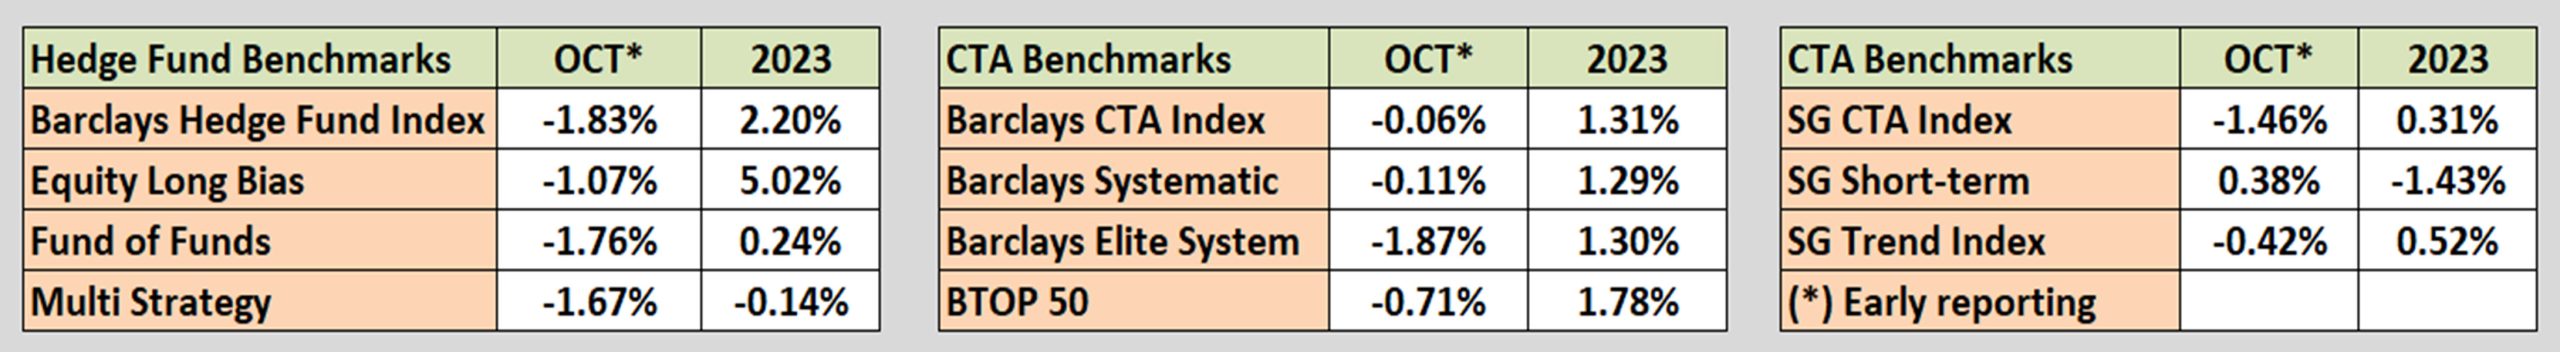
Industry Benchmark Performance
Early reporting shows small losses in both equities and futures. However, both remain positive for the year. The industry has been waiting for the Fed to stop raising rates. Wednesday’s meeting could be the turning point.
Kaufman’sMost Popular Books (available on Amazon)
Trading Systems and Methods, 6th Edition. The complete guide to trading systems, with more than 250 programs and spreadsheets. The most important book for a system developer.
Kaufman Constructs Trading Systems. A step-by-step manual on how to develop, test, and trade an algorithmic system.
Learn To Trade. Written for both serious beginners and practiced traders, this book includes chart formations, trends, indicators, trading rules, risk, and portfolio management. You can find it in color on Amazon.
You can also find these books on our website, www.kaufmansignals.com.
There is a good website for trading books, Shepherd.com. Well-known traders recommend books and explain why.
Blogs and Recent Publications
Find Mr. Kaufman’s other recent publications and seminars at the end of this report. We post new interviews, seminars, and reference new articles by Mr. Kaufman each month.
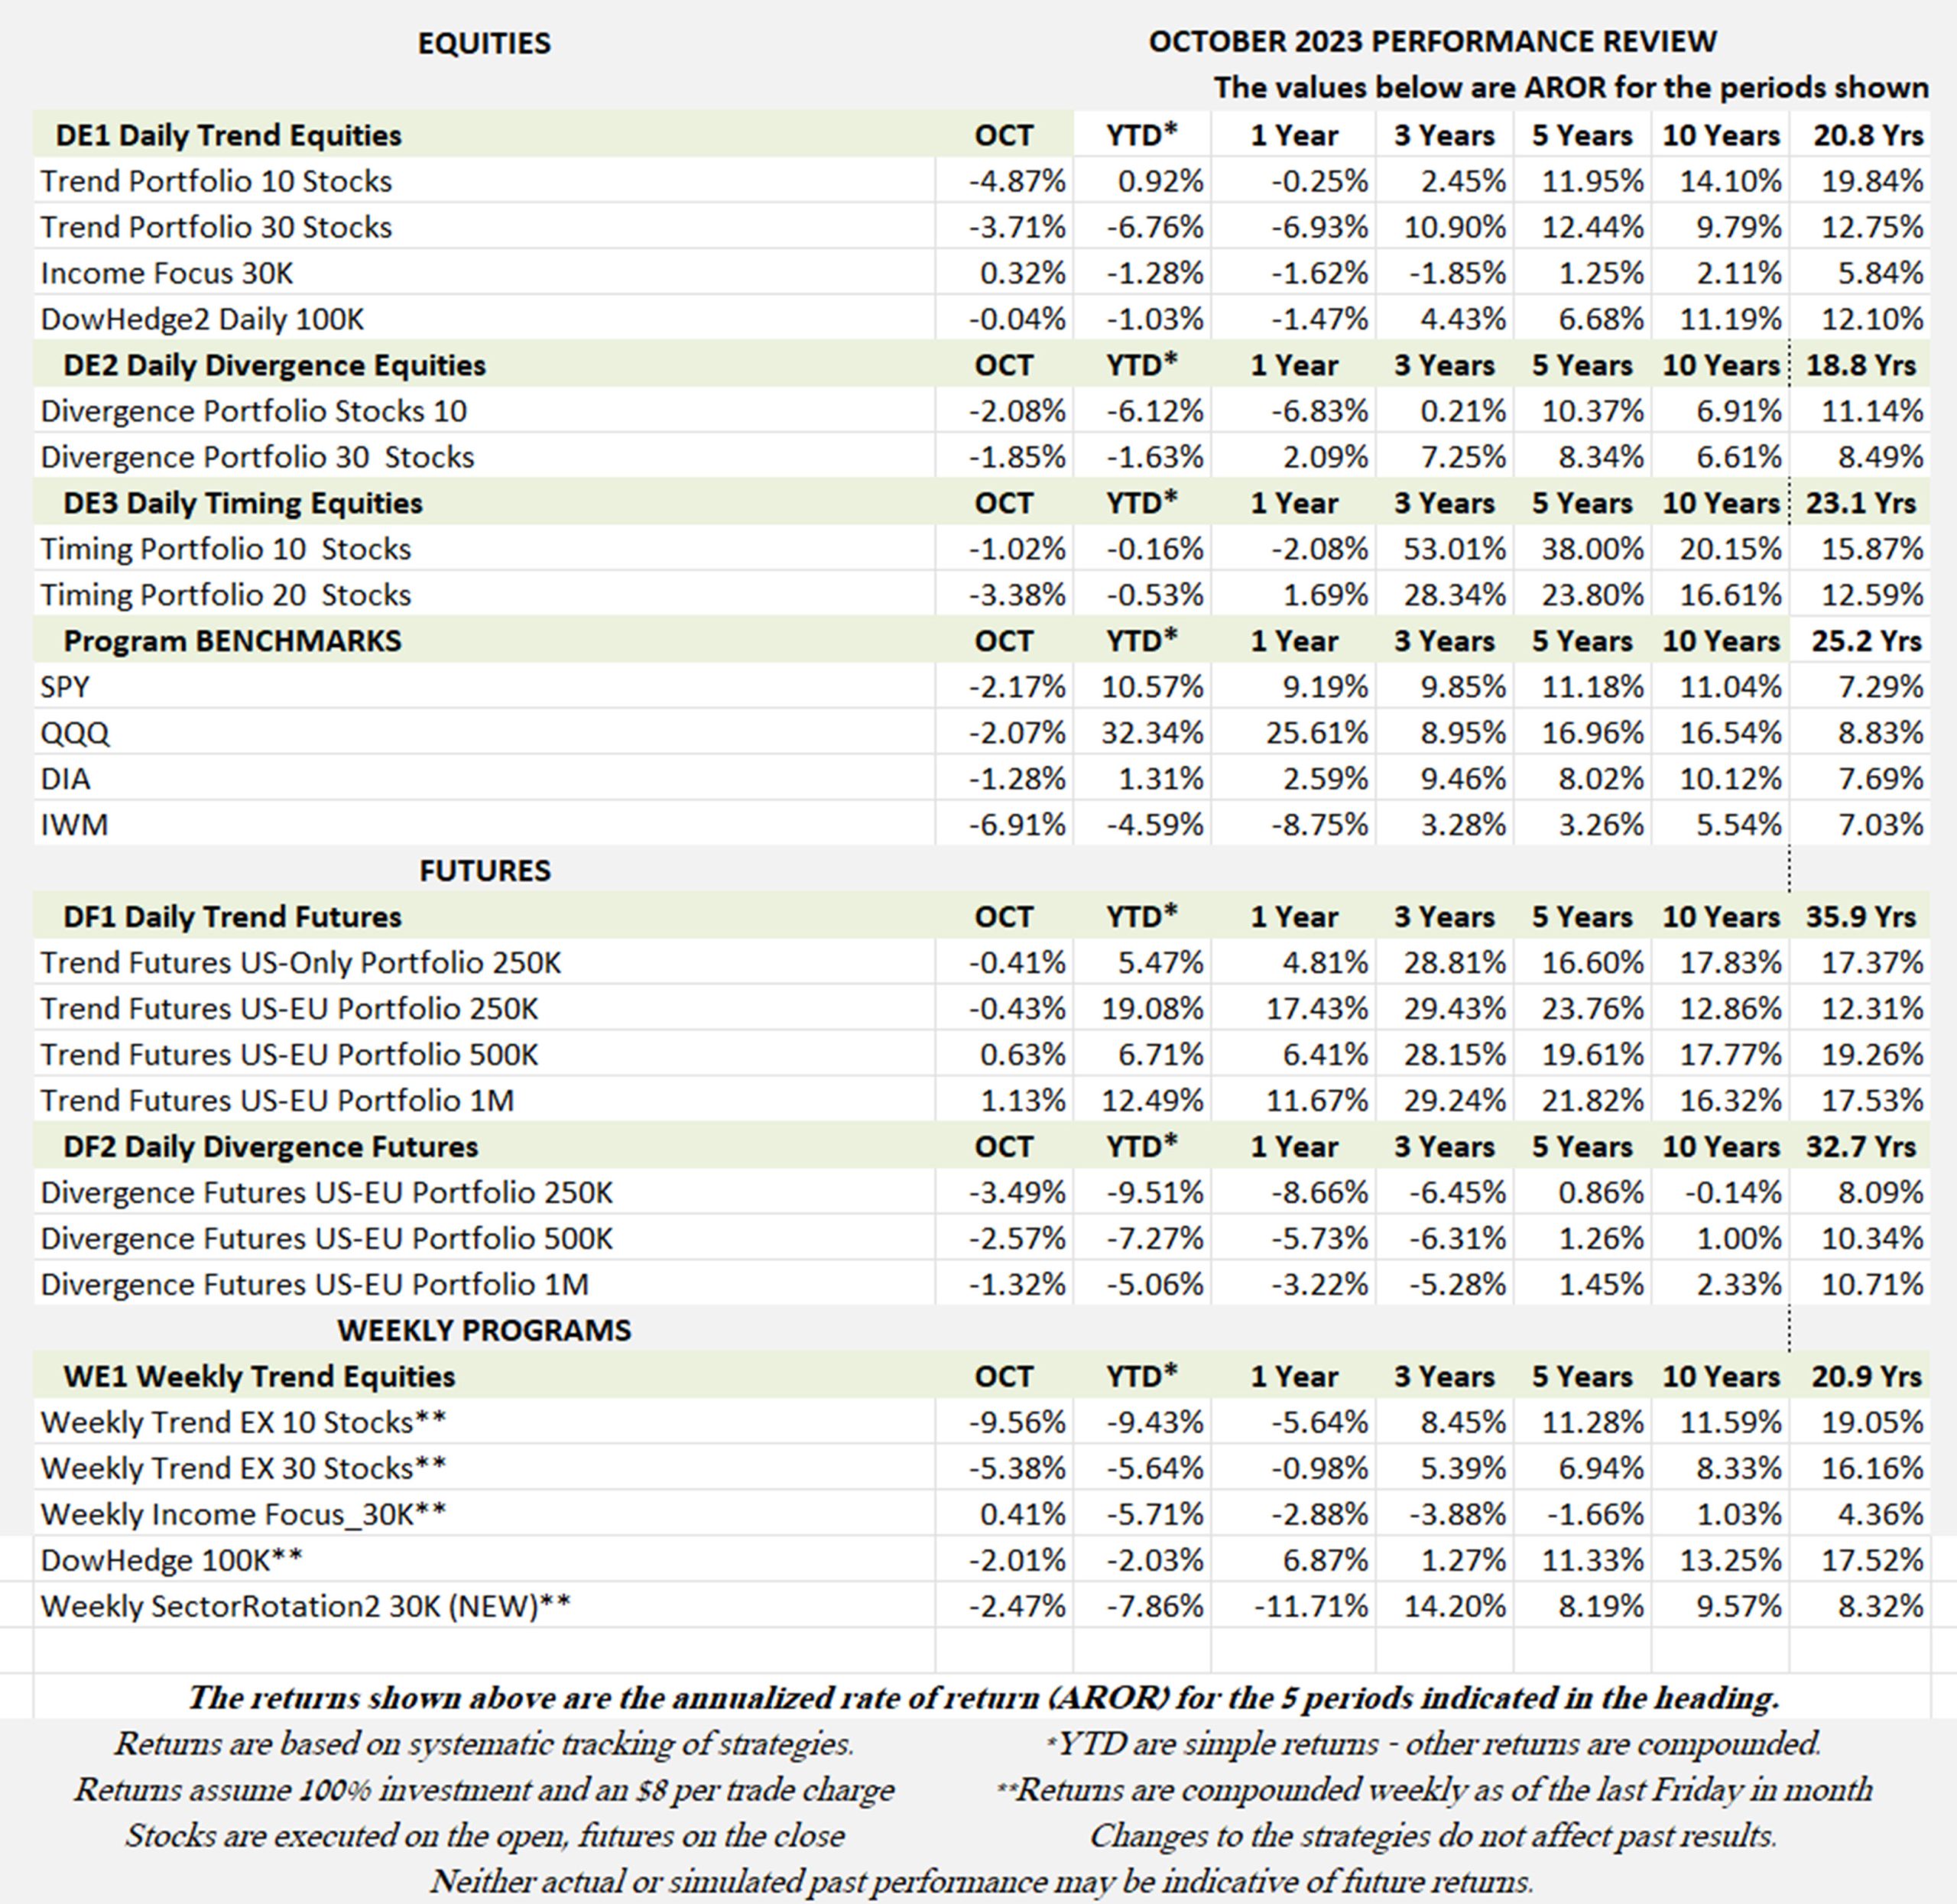
October Performance in Brief
A difficult month for most systematic traders. The S&P has been swinging up and down, but mostly down reflecting the Fed’s “longer for higher” approach. They are waiting for inflation to cool, but with increased salaries (including the auto manufacturers), that will be hard to come by. The housing market is also losing steam and semiconductors are showing weak earnings. Is that enough for the Fed to stop permanently? According to Chairman Powell, that may be enough.
Most of our programs showed losses in October. The benchmark Stock Trend 10 program is holding onto thin gains for the year, as are most futures programs. Otherwise, we’re hoping for the usual November-December rally.
Major Equity ETFs
Another loss for the Equity ETFs, but not as bad as in September. Except for IWM, we’ve been going sideways waiting for the Fed to change its policy. The must be a lot of money on the sidelines waiting for a place to buy. Let’s hope it’s going to be in the next two months!

CLOSE-UP: What to Trade During a War
War seems to be part of our “civilization.” It would not be hard to find two countries or two ethnic groups fighting at any time. And while the U.S. and Europe have not had any serious conflicts on their own land since World War II, they are often driven to support other causes. Most recently, Ukraine and now Israel.
As a stock and futures trader, I want to know if there is some element of investing that is generally safe during various degrees of war. I know that sounds cynical, but we face various scenarios and prefer not to have our investments decline.
Recent History of Wars
There have been only five events that would have affected the U.S. and some of them are mixed with other factors. Figure 1 and 2 show those events using S&P futures (nearest contract) on both a price scale and a log scale. The log scale shows the percent decline, a better way to judge the effects.
- The first Gulf War, Iraq invades Kuwait, 8/2/1990
- The attack on the World Trade Center 9/11/2001, followed by War in Afganistan
- The second attack on Iraq, 3/20/2003 through 12/15/2011
- Russia invades Ukraine, 2/24/2022
- Hamas attacks Israel, 10/7/2023
Until the invasion of Ukraine, the other events don’t seem to have affected our defense surplus, but they could have a serious effect on your portfolio. But in the U.S., maintaining a strong defense has always been a priority. There is always China, testing its dominance over the China sea and Taiwan, or North Korea testing new ICBMs, or Iran converting nuclear energy to high-grade bombs. Each causing the U.S. to bolster its own strength. With the war in Ukraine, and now Israel, we are now looking at which companies benefit from increasing munitions.

Figure 1. S&P Futures from 1982, price scale.
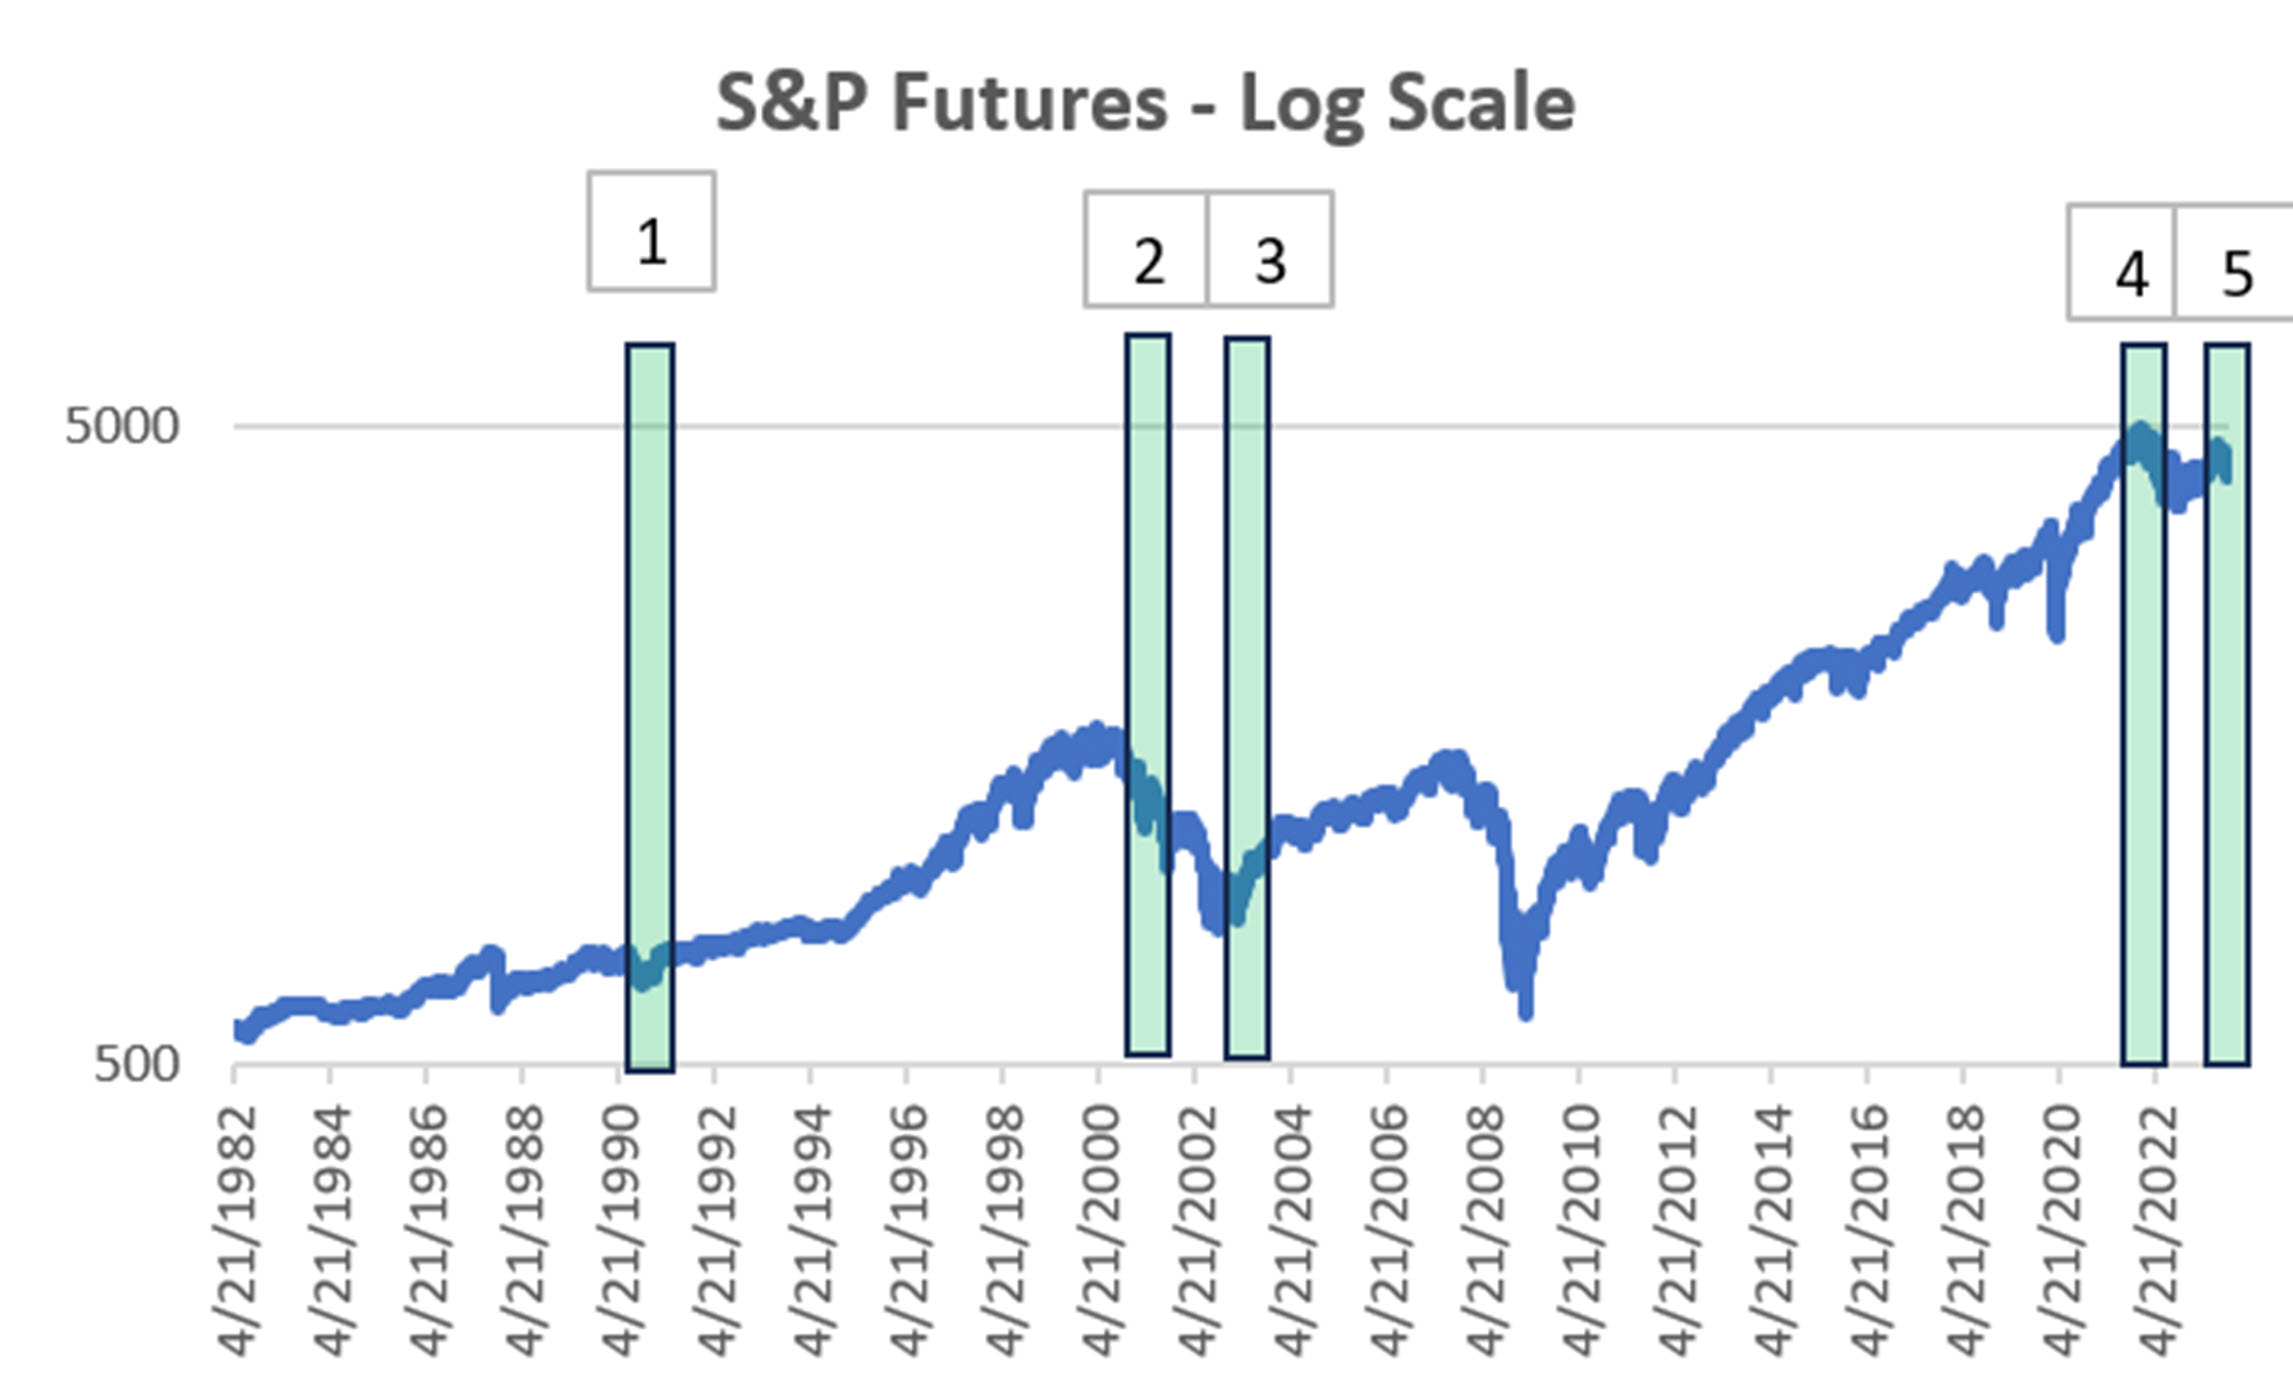
Figure 2. S&P Futures, log scale.
Comparing Results
To isolate those companies that might benefit from war, we will look at the aerospace ETFs, XAR, ITA, and PPA. Because those companies include a wide-ranging category, we will look at the biggest defense companies separately, Lockheed-Martin (LMT), Raytheon (RTX), and General Dynamics (GD).
Interest rates in the U.S. tend to rally as investors flee to safety. So we will look at U.S. 30-Year bonds. If the world sees the U.S. as a safe-haven, then we should see that in the increase in the U.S. dollar. We’ll look at the Dollar Index for that.
We’ll also look at crude oil. Of all the five events, crude oil can be at risk in all five.
It’s going to be difficult to put an end to the event. The attack on the World Trade Center had no reprisals for a long time. Then we sent troops to Afghanistan. It wasn’t until the Ukraine war that our defense companies needed to gear up. Before that, the U.S. had plenty of reserves. Let’s keep that in mind. And most of the defense ETFs didn’t start until 2005, so they will only be used since the Ukraine War.
Seeking Safety
U.S. bonds are generally accepted as a refuge for safety. That was the case on 9/11/2001. When the Twin Towers collapsed, SPY fell from 72.48 to open in two days at 68.66, then dropping to 64.31. At the same time TNX (the ETF for 10-Year Notes) dropped from 4.83% to 4.61% and settled at 4.50%. While most stocks declined, interest rates rallied as investors moved money from stocks to rates.
But then the U.S. was being attached on its own turf. When Russia attached Ukraine of 2/21/2022, nothing much happened, in fact, rates when up. SPY sold off for two days, then rallied to new highs.
Did Europeans move their money to the U.S. dollar? There was a rally in the U.S. dollar index (DX) of about 3% before reversing. That’s could have been noise, but nothing we could have counted on to hedge our concerns about war.
There was also a surge in gold of 7.0% that lasted about two weeks.
Investors use bonds, the U.S. dollar, and gold as safe-havens, but in these events their gains don’t last long.
Crude is Another Story
No matter where the conflicts are, crude oil seems to be one of the markets most affected by geopolitical tensions. The large jump in crude at the beginning of the War in Ukraine shows how important crude can be as a political instrument. Russia is a large producer of oil, but attempts to block Russia from selling oil have not been effective. At the same time we have the Fed raising interest rates, a dampening effect on crude. Trading crude has always been risky, but from peak to trough the decline is 60%. A wild ride.

Figure 3. Crude and gold (cash) from the beginning of the War in Ukraine.
Defense and Aerospace ETFs
Now that we’ve eliminated most of the normal hedges: bonds, the U.S. dollar, and crude, the most obvious is the Defense and Aerospace ETFs: XAR, ITA, PPX. Personally, I find them much the same, so we’ll only look at XAR. Since inception in 2011, SPY has gained 12.7% and XAR 14.1%. As you can see in Figure 4, both are volatile, but perhaps XAR even more so.

Figure 4. SPY vs XAR, from inception of XAR.
I have noted that all ETFs include a lot of stocks that do nothing. It is an attempt to capture all companies doing defense work. I don’t find that very helpful. Instead, let’s look at the stocks with the most allocations, Lockheed-Martin (LMT), Raytheon (RTX), and Boeing (BA), shown in Figure 5. From 1998, LMT had the highest returns at 11.5%, RTX at 8.75% and the SPY at 7.03%.

Figure 5. Largest stocks in XAR compared to SPY.
We’re going to eliminate Boeing because a large part of their earnings comes from commercial aircraft. Then using the top few defense companies can improve your return. But let’s look at earnings from the time of the Ukraine war (Figure 6).

Figure 6. Returns since 2022 (Ukraine war started 2/24/2022). There is a jump in LMT and RTX.
It turns out that the U.S. economy turned down as interest rates increase, at the same time as the Russian invasion. That makes it difficult to see the results. But SPY has dropped -6.1% while XAR dropped -1.5%, RTX dropped -2.2% and LMT gained +15.3%. Sometimes a smaller loss is better than a bigger loss. If you didn’t use XAR but used top allocations, you would have netted a profit.
Some Safe-Havens Work Some of the Time, But Defense is Likely to Continue
We know that some investors will move from stocks to bonds when they feel worried about the economy, or about a geopolitical event. However, that doesn't seem to last for long. In addition, there are other factors that affect those profits. It will be difficult to isolate the effects of any one – except defense.
Of all the differences between our two party system, defense spending seems the one item we agree on. And the reason for increasing defense spending seems to be increasing. Even so, the XAR and other defense ETFs are not a good way to benefit. Best to use 3 to 5 of the top allocations and create your own defense hedge.
A Standing Note on Short Sales
Note that the “All Signals” reports show short sales in stocks and ETFs, even though short positions are not executed in the equity portfolios. Our work over the years shows that downturns in the stock market are most often short-lived and it is difficult to capture with a longer-term trend. The upwards bias also works against shorter-term systems unless using futures, which allows leverage. Our decision has been to take only long positions in equities and control the risk by exiting many of the portfolios when there is extreme volatility and/or an indication of a severe downturn.
PORTFOLIO METHODOLOGY IN BRIEF
Both equity and futures programs use the same basic portfolio technology. They all exploit the persistence of performance, that is, they seek those markets with good long-term and short-term returns on the specific system, rank them, then choose the best, subject to liquidity, an existing current signal, with limitations on how many can be chosen from each sector. If there are not enough stocks or futures markets that satisfy all the conditions, then the portfolio holds fewer assets. In general, these portfolios are high beta, showing higher returns and higher risk, but have had a history of consistently outperforming the broad market index in all traditional measures.
PERFORMANCE BY GROUP
NOTE that the charts show below represent performance “tracking,” that is, the oldest results since are simulated but the returns from 2013 are the systematic daily performance added day by day. Any changes to the strategies do not affect the past performance, unless noted. The system assumes 100% investment and stocks are executed on the open, futures on the close of the trading day following the signals. From time to time we make logic changes to the strategies and show how the new model performs.
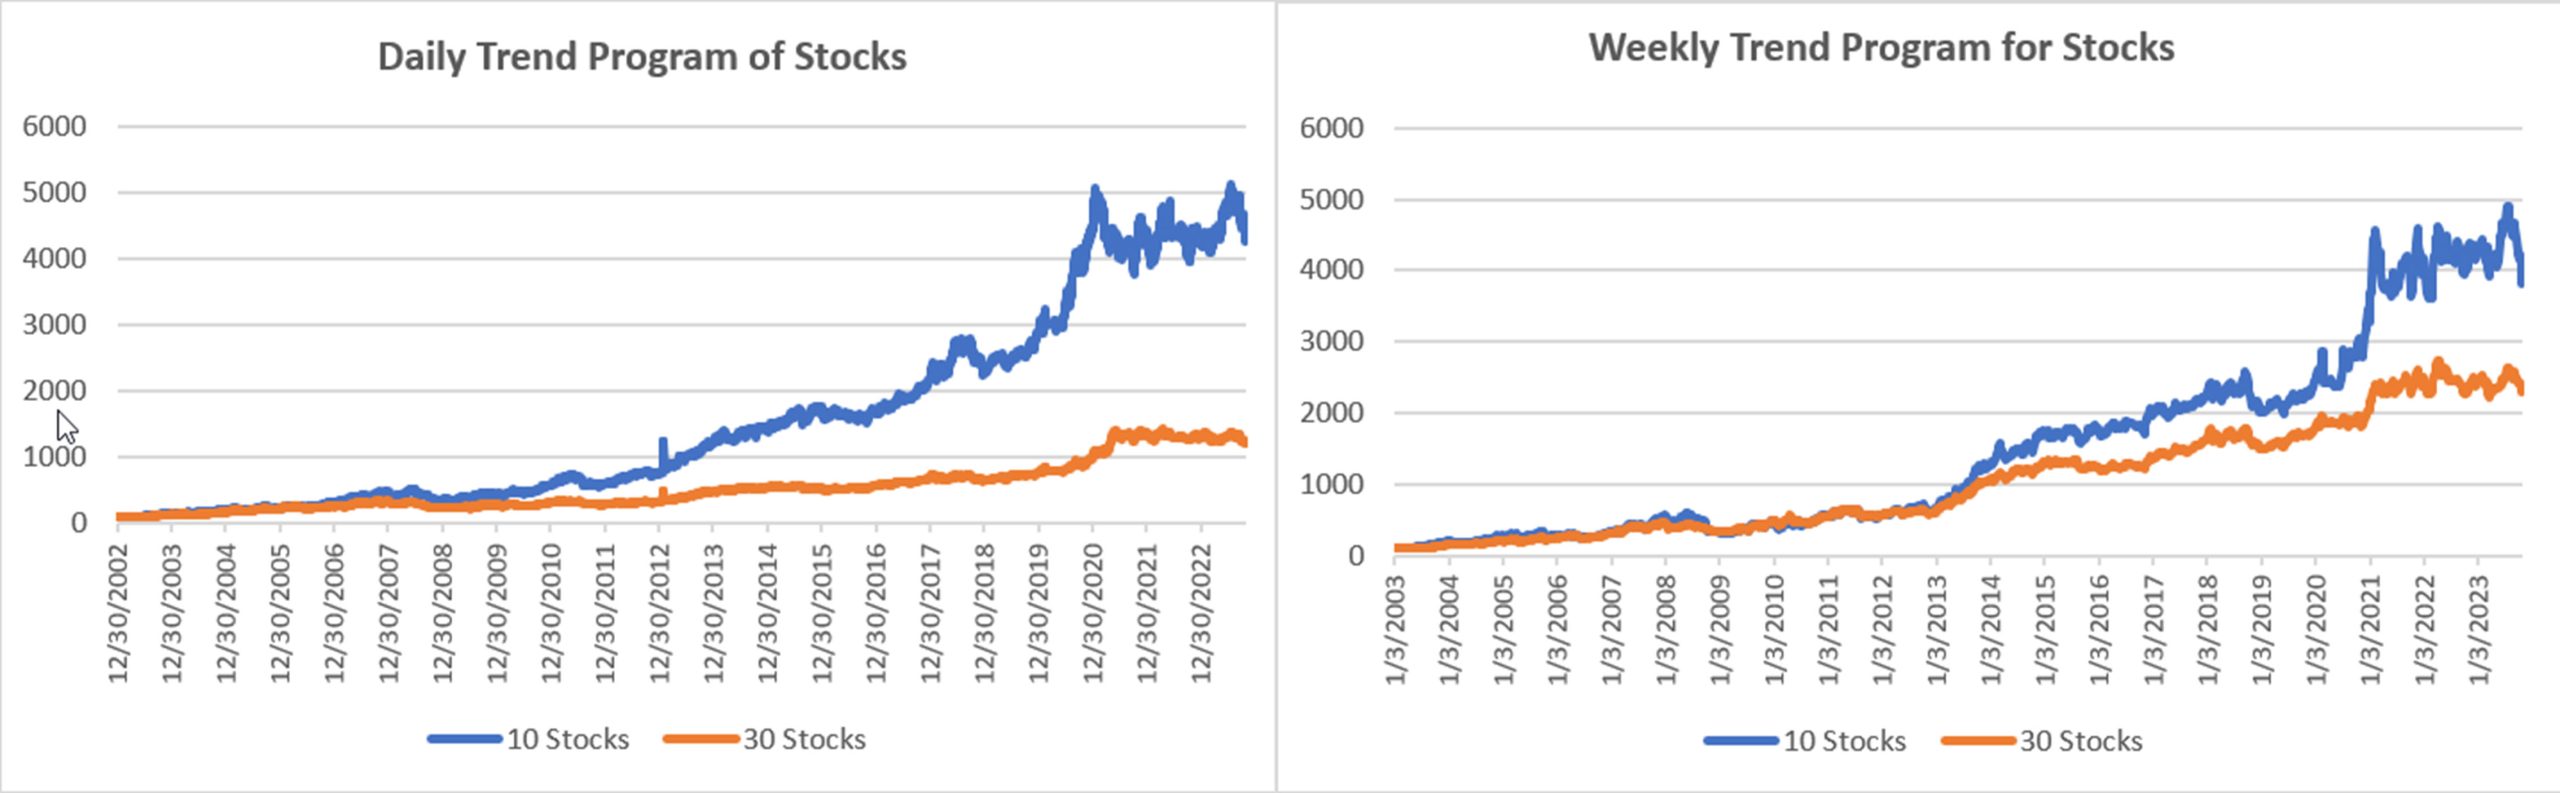
Groups DE1 and WE1: Daily and Weekly Trend Program for Stocks, including Income Focus, DowHedge, and the new Sector Rotation
The Trend program seeks long-term directional changes in markets and the portfolios choose stocks that have realized profitable performance over many years combined with good short-term returns. It will hold fewer stocks when they do not meet our condition and exit the entire portfolio when there is extreme risk or a significant downturn.
Another loss in October, leaving the 10-Stock program us slightly and the Weekly Program of over 9%. It’s been a difficult few months for stock-picking, but November and December normally help. We the Fed now on pause, we can expect some better results.
Income Focus and Sector Rotation
Small gains in both the Daily and Weekly Income Focus programs give us some idea of what might happen if the Fed stops raising rates. While the Daily program has held up well, declining rates should boost both returns.

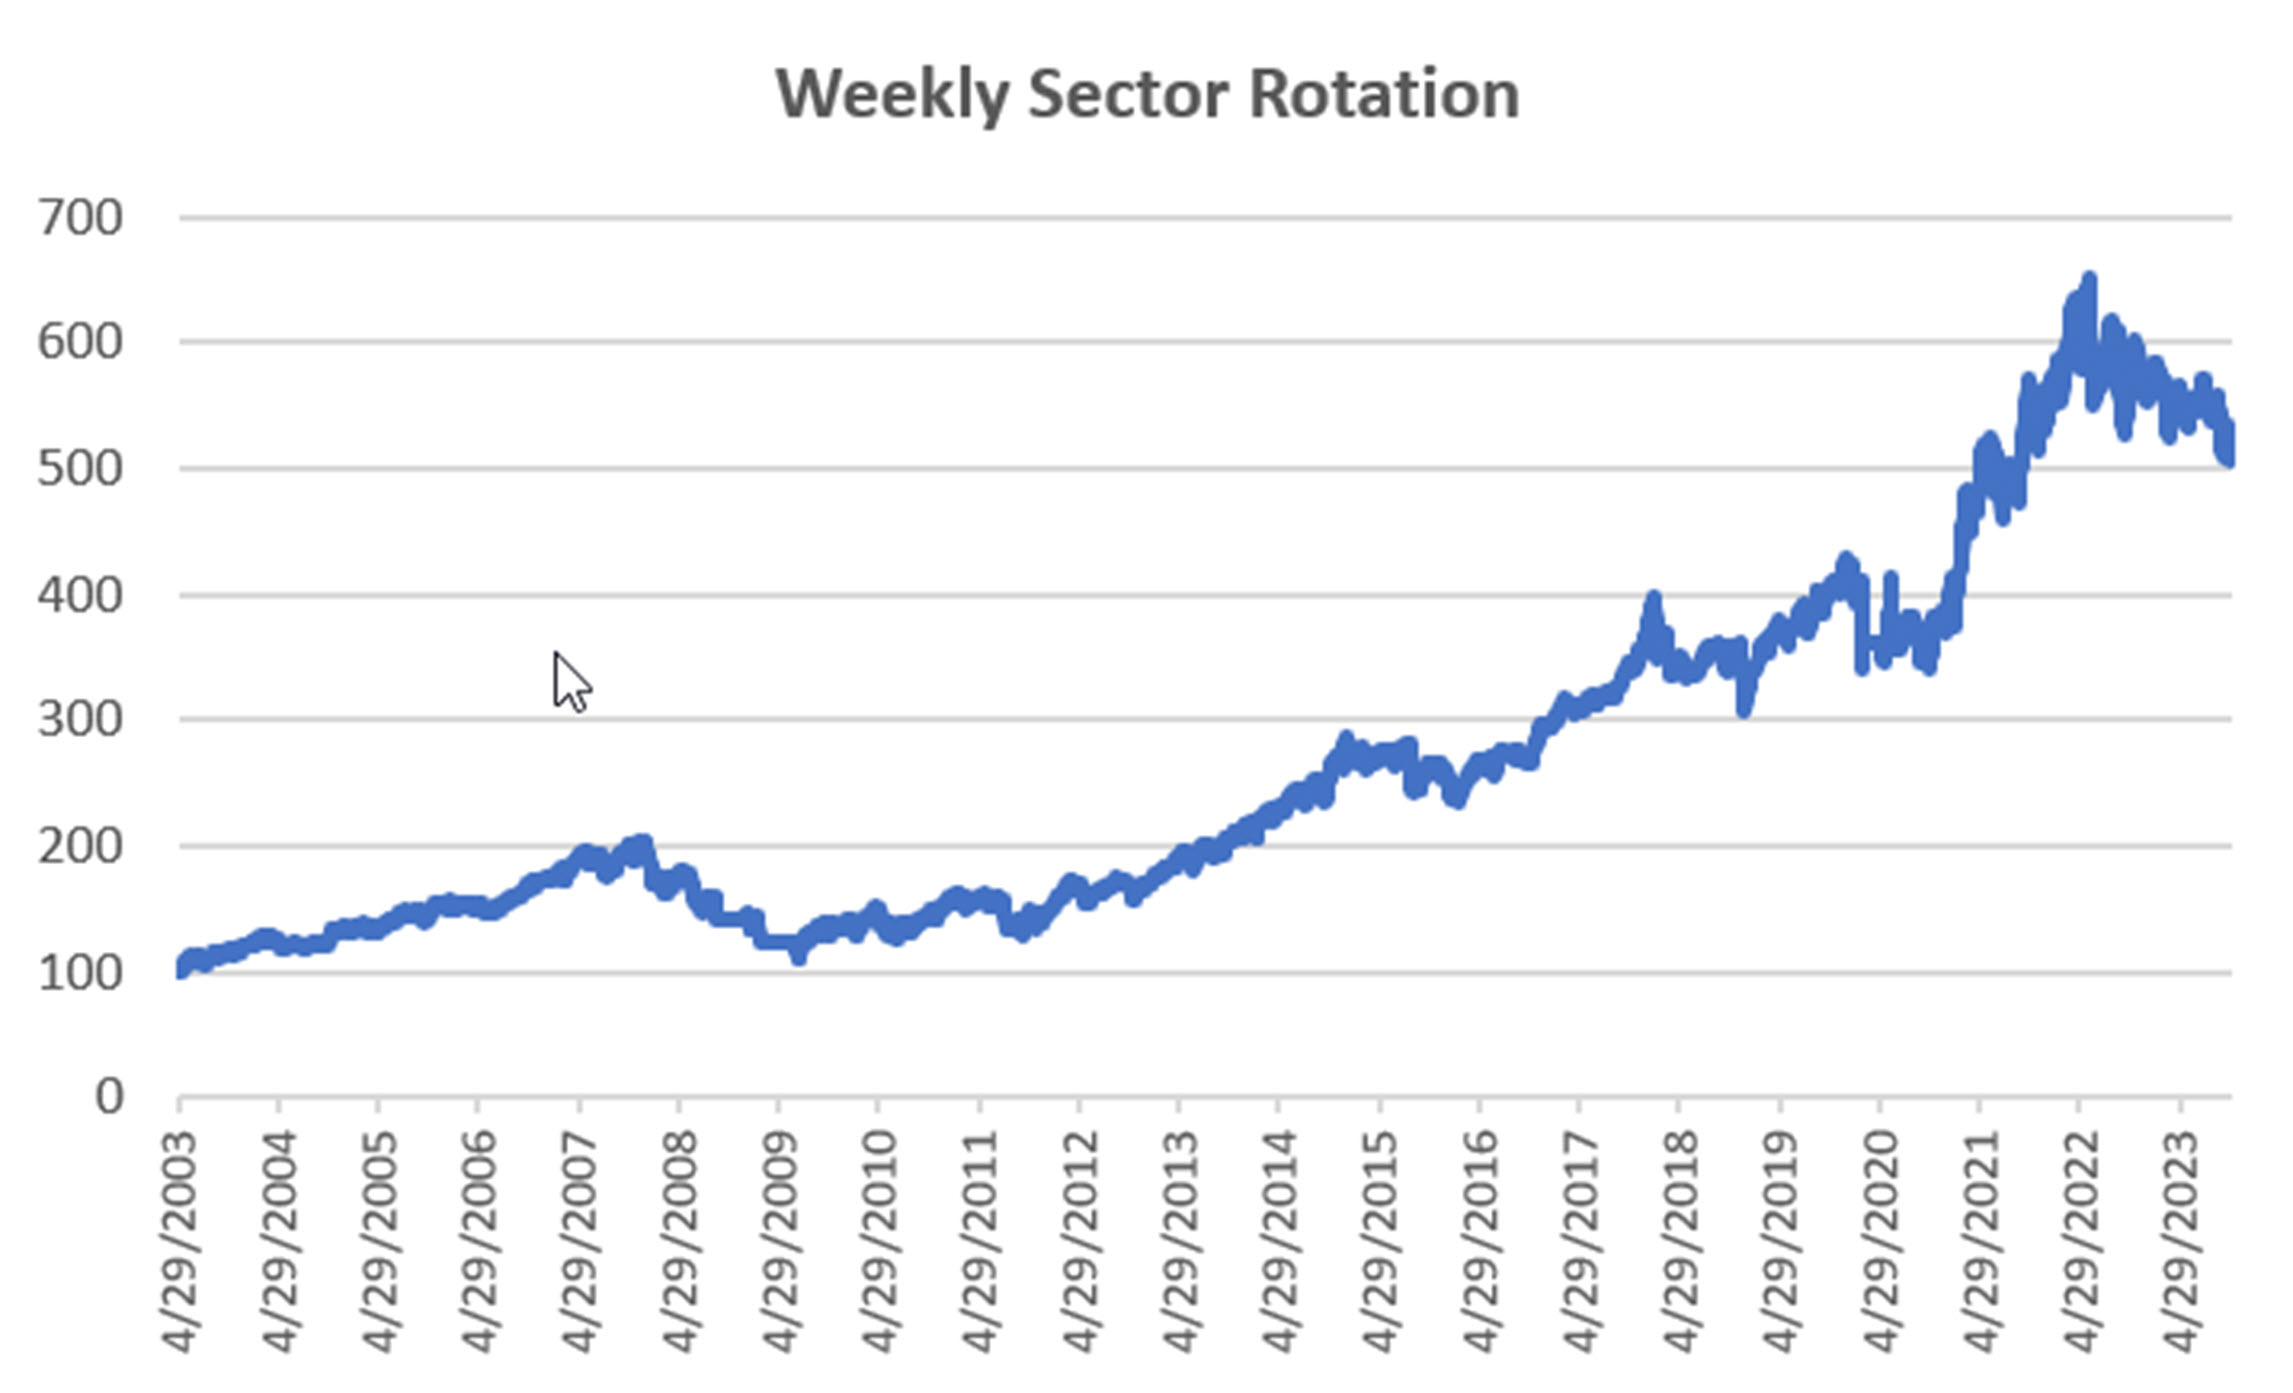
Sector Rotation
It is difficult to find a sector that did not decline in October, so this program lost about the same as the S&P. So far the program has suffered from sectors that are good one day and not good the next.
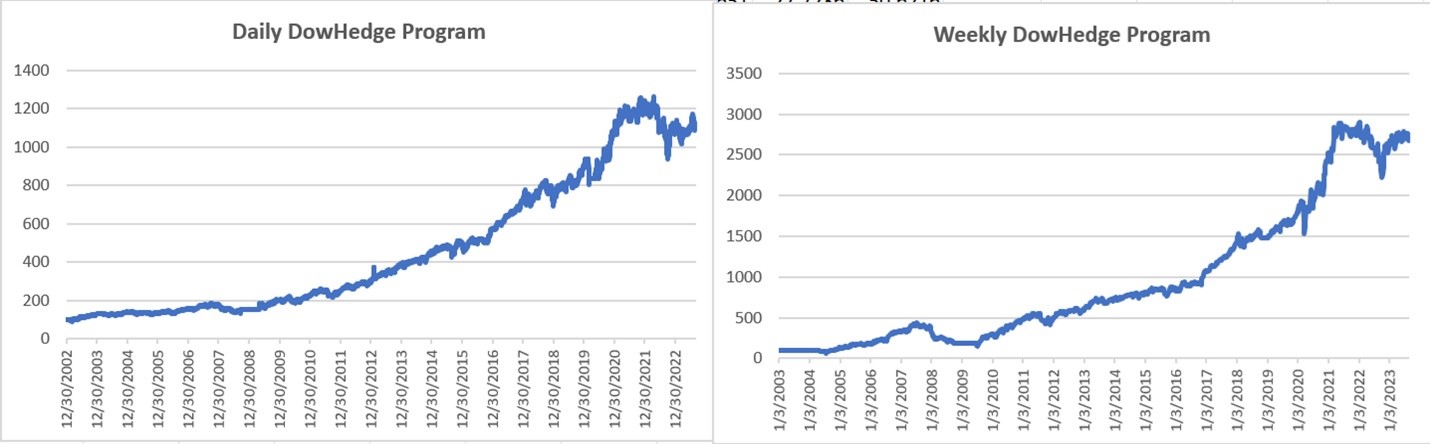
DowHedge Programs
This program lost fractionally in October, and is slightly down for the year. It’s been an unusual decline, mostly on low volatility. This program hedges when volatility increases, but that hasn’t happened. Still, it’s not far off its highs, so a good November-December can make a difference.
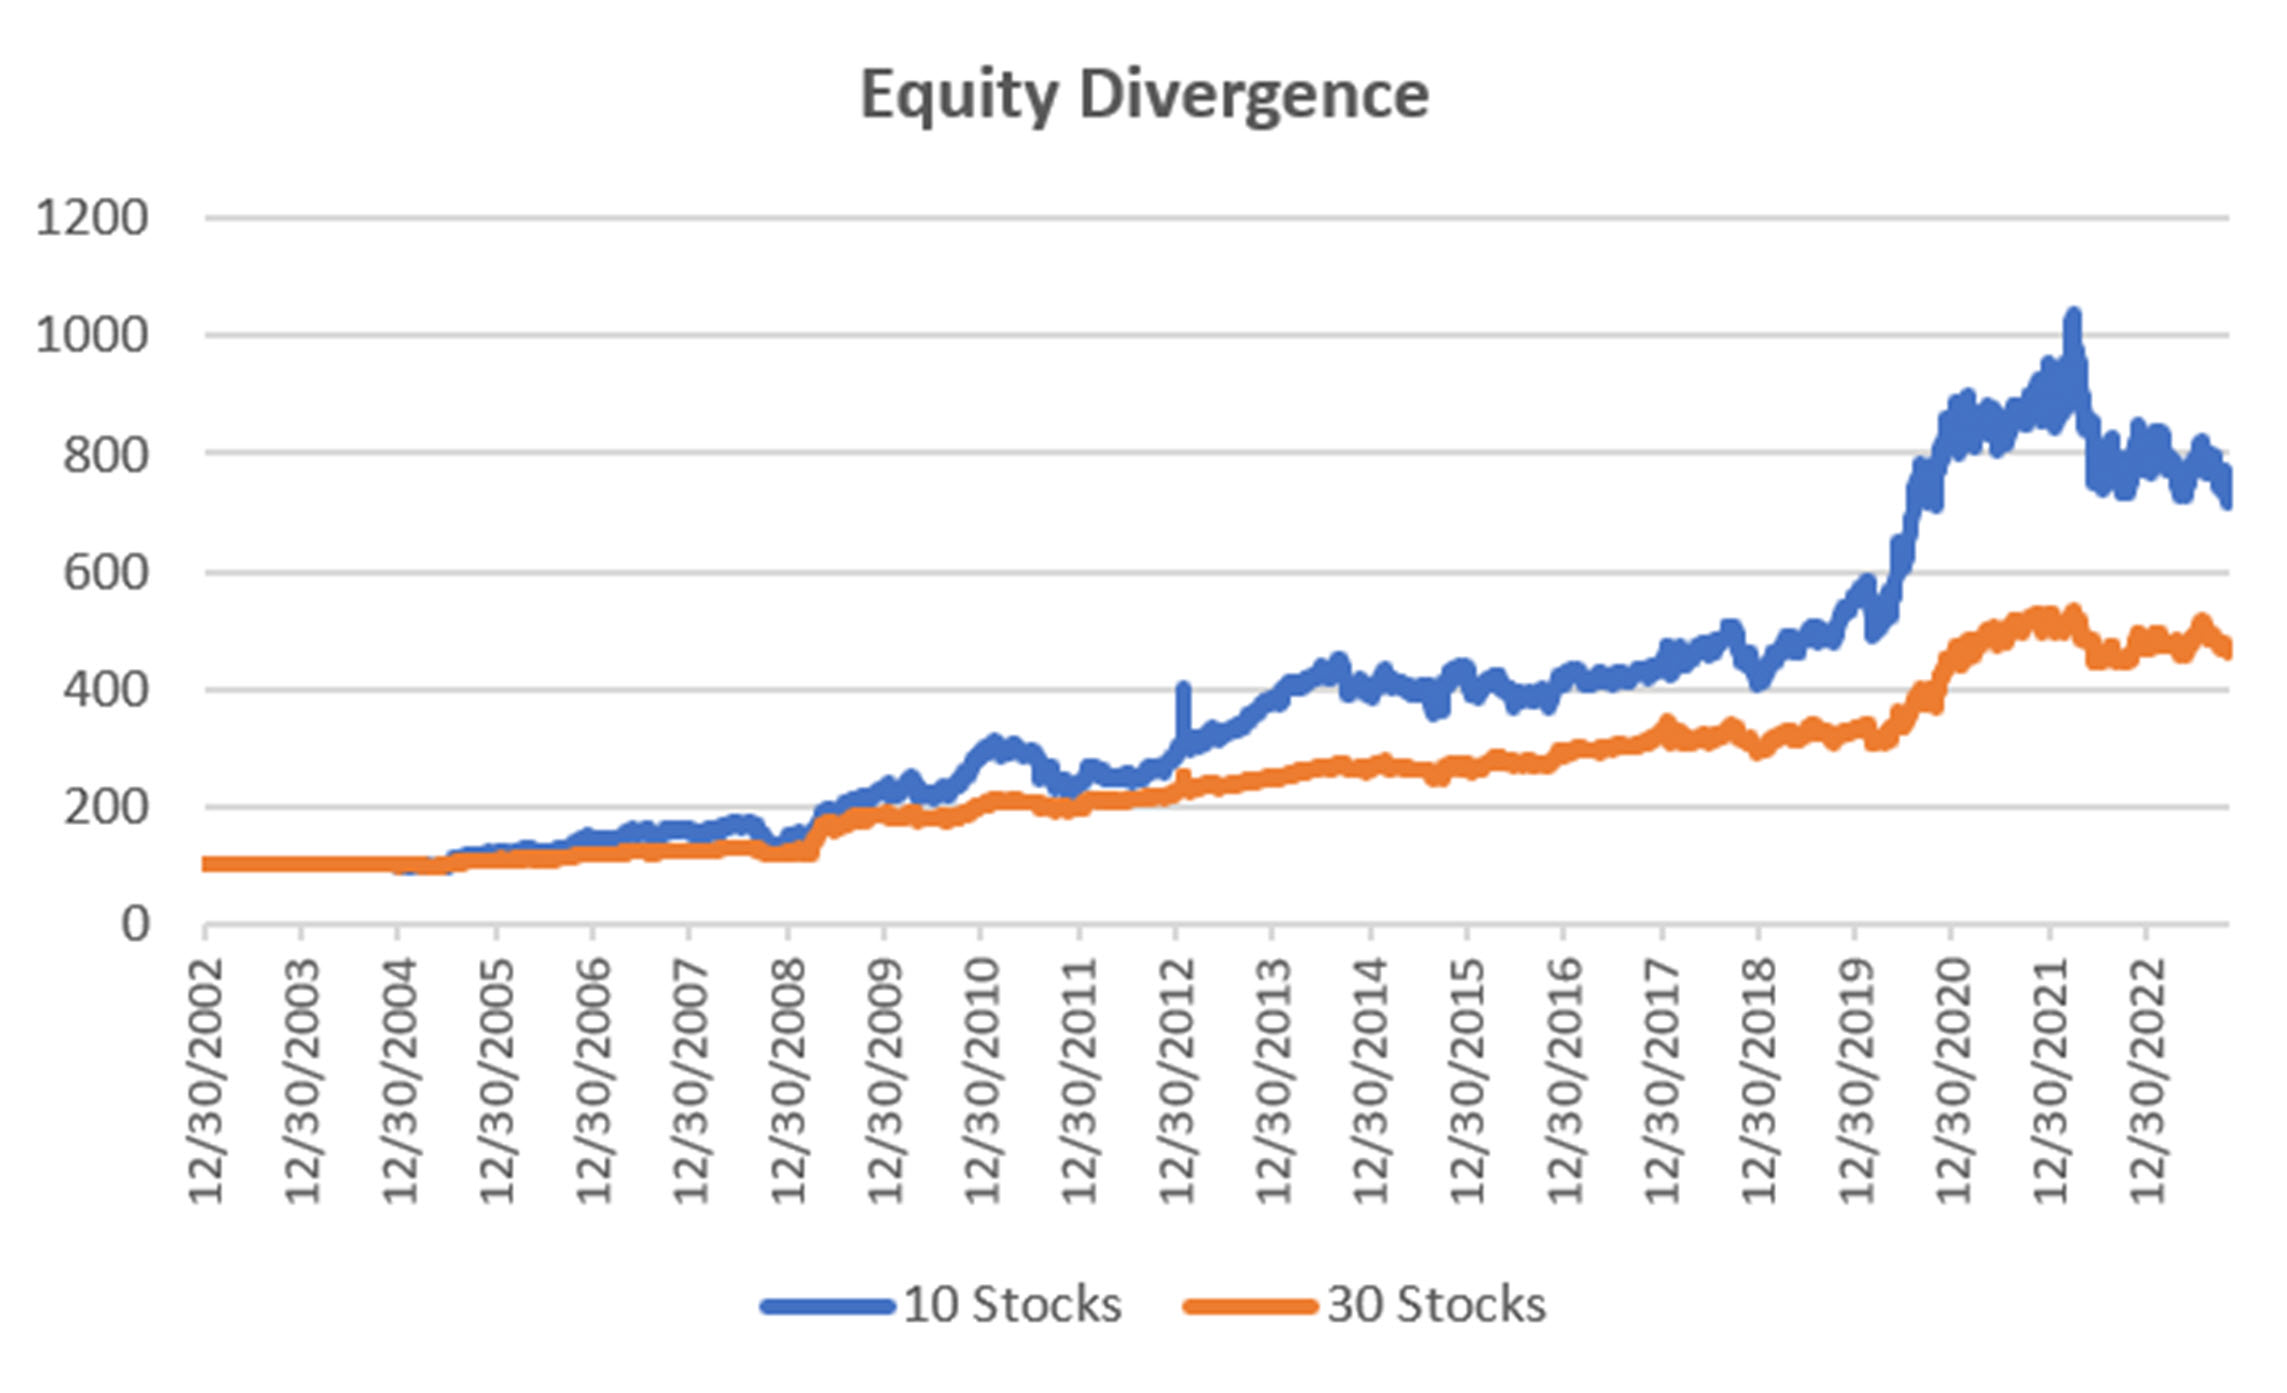
Group DE2: Divergence Program for Stocks
The Divergence program looks for patterns where price and momentum diverge, then takes a position in anticipation of the pattern resolving itself in a predictable direction, often the way prices had moved before the period of uncertainty.
The Divergence Program relies on pauses in a trending pattern. With modest losses in October, it continues waiting for a trend pattern that hasn’t yet appeared. What at first appears to be a trend turns out to fail, but the new Fed policy is likely to increase the trends in some stocks.
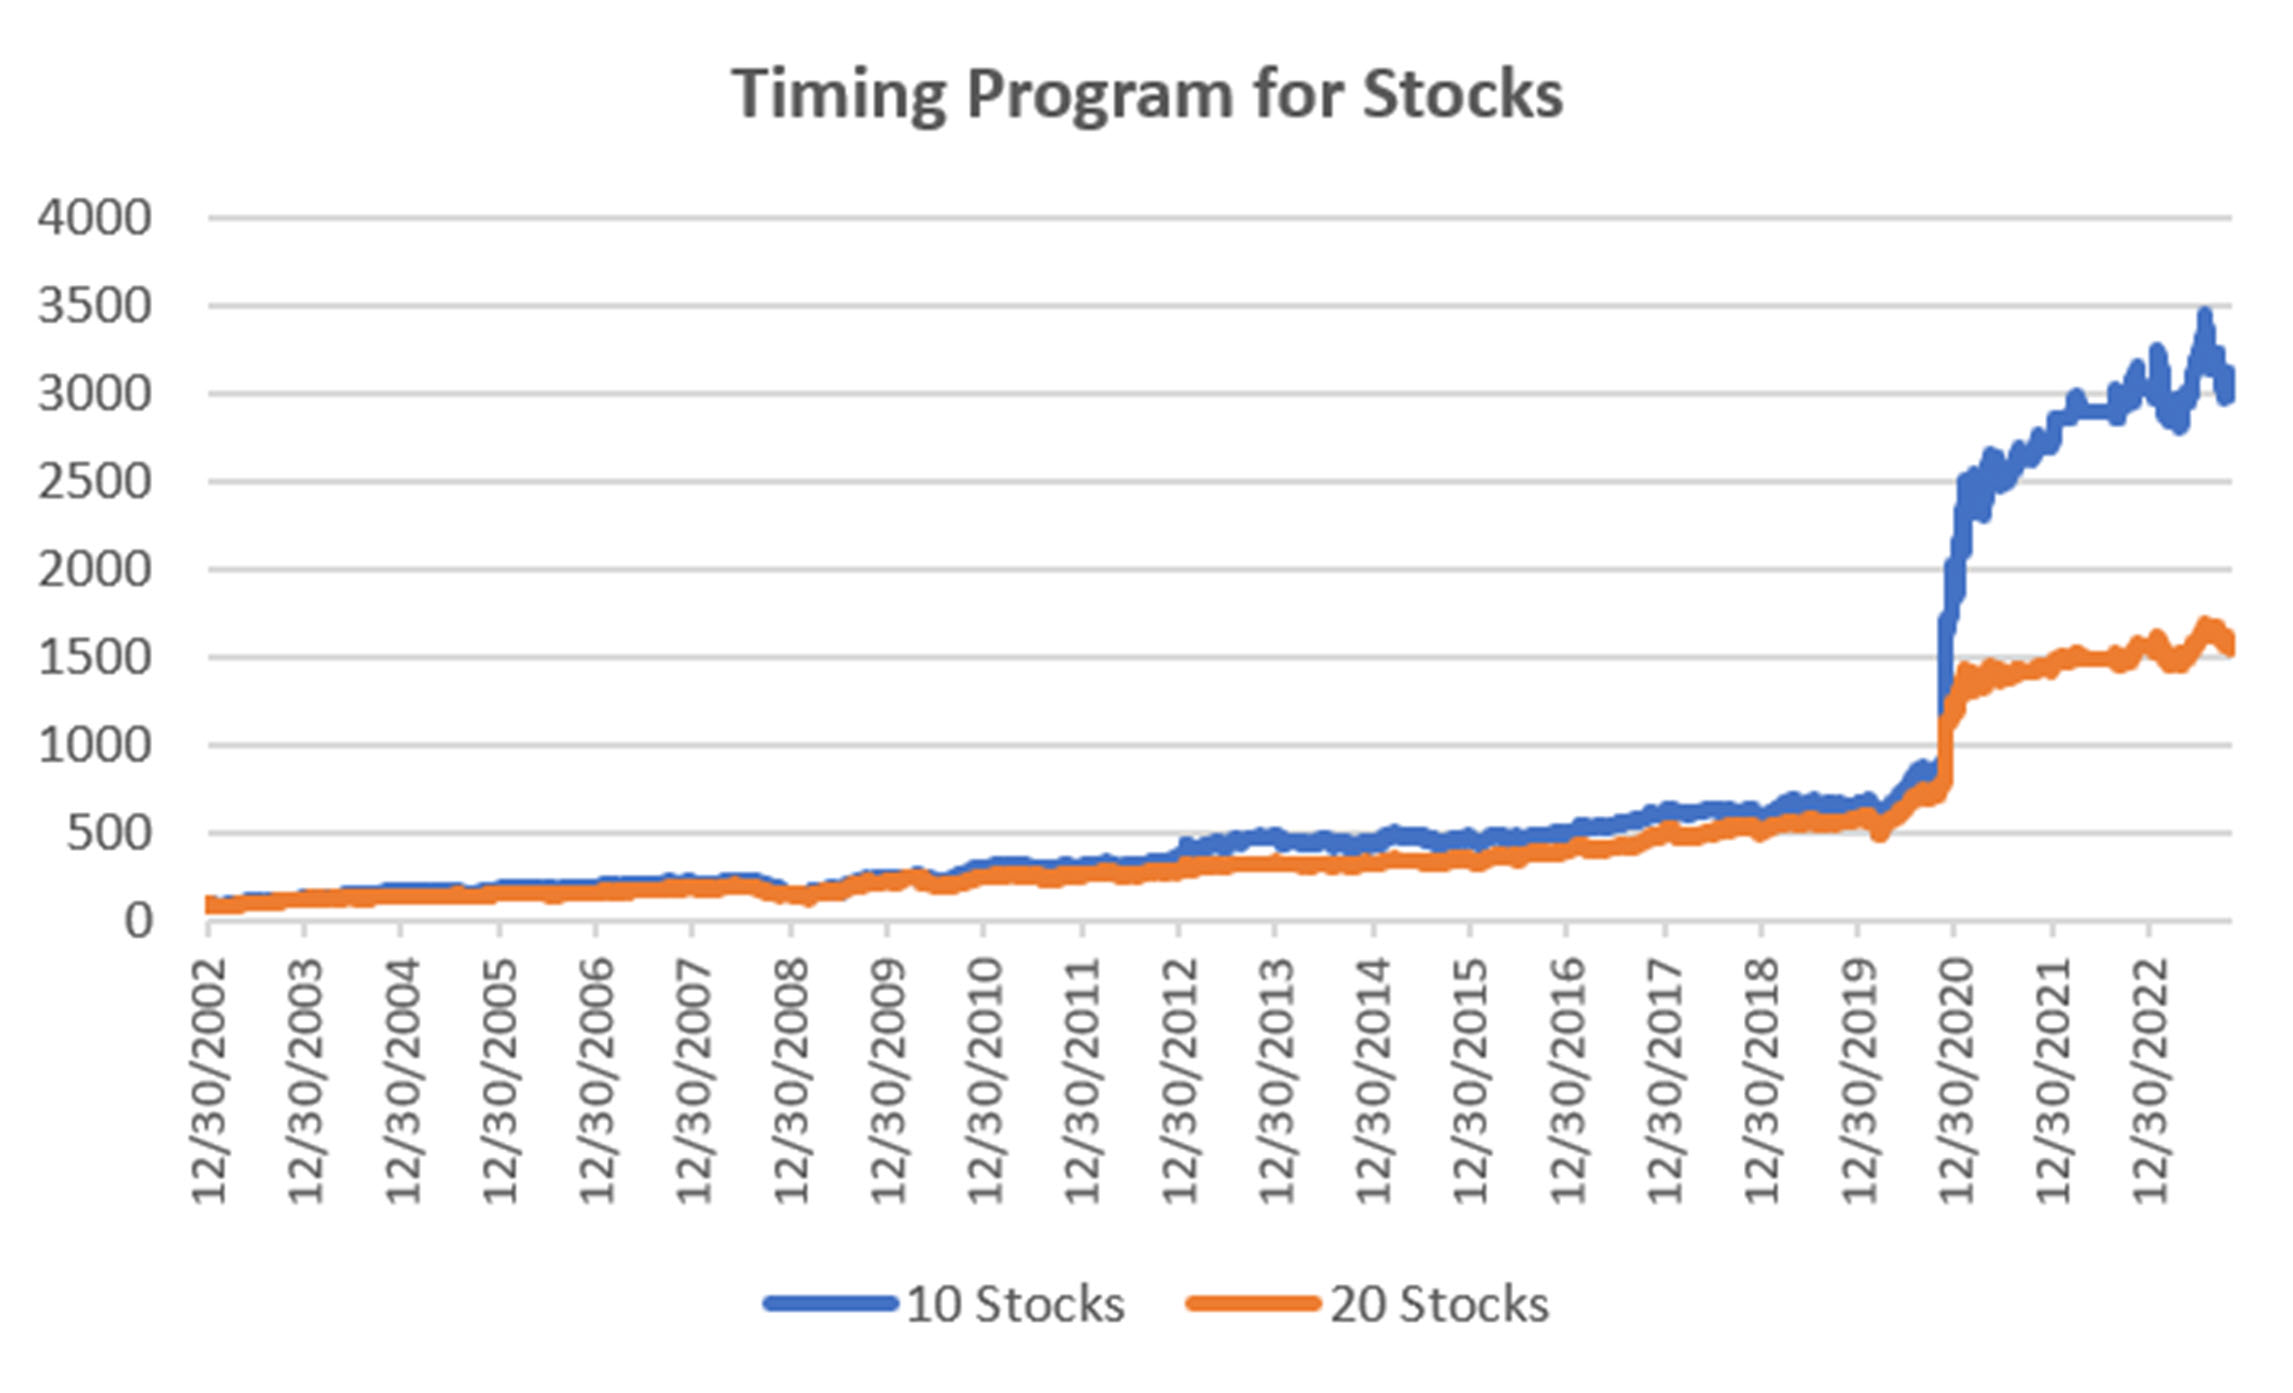
Group DE3: Timing Program for Stocks
The Timing program is a relative-value arbitrage, taking advantage of undervalued stocks relative to its index. It first finds the index that correlates best with a stock, then waits for an oversold indicator within an upwards trend. It exits when the stock price normalizes relative to the index, or the trend turns down. These portfolios are long-only because the upwards bias in stocks and that they are most often used in retirement accounts.
Small declines in the Timing Program now shows less than a 1% loss for the year. As the chart shows, it’s holding up nicely waiting for a chance to buy a pullback. We hope that’s going to be soon!
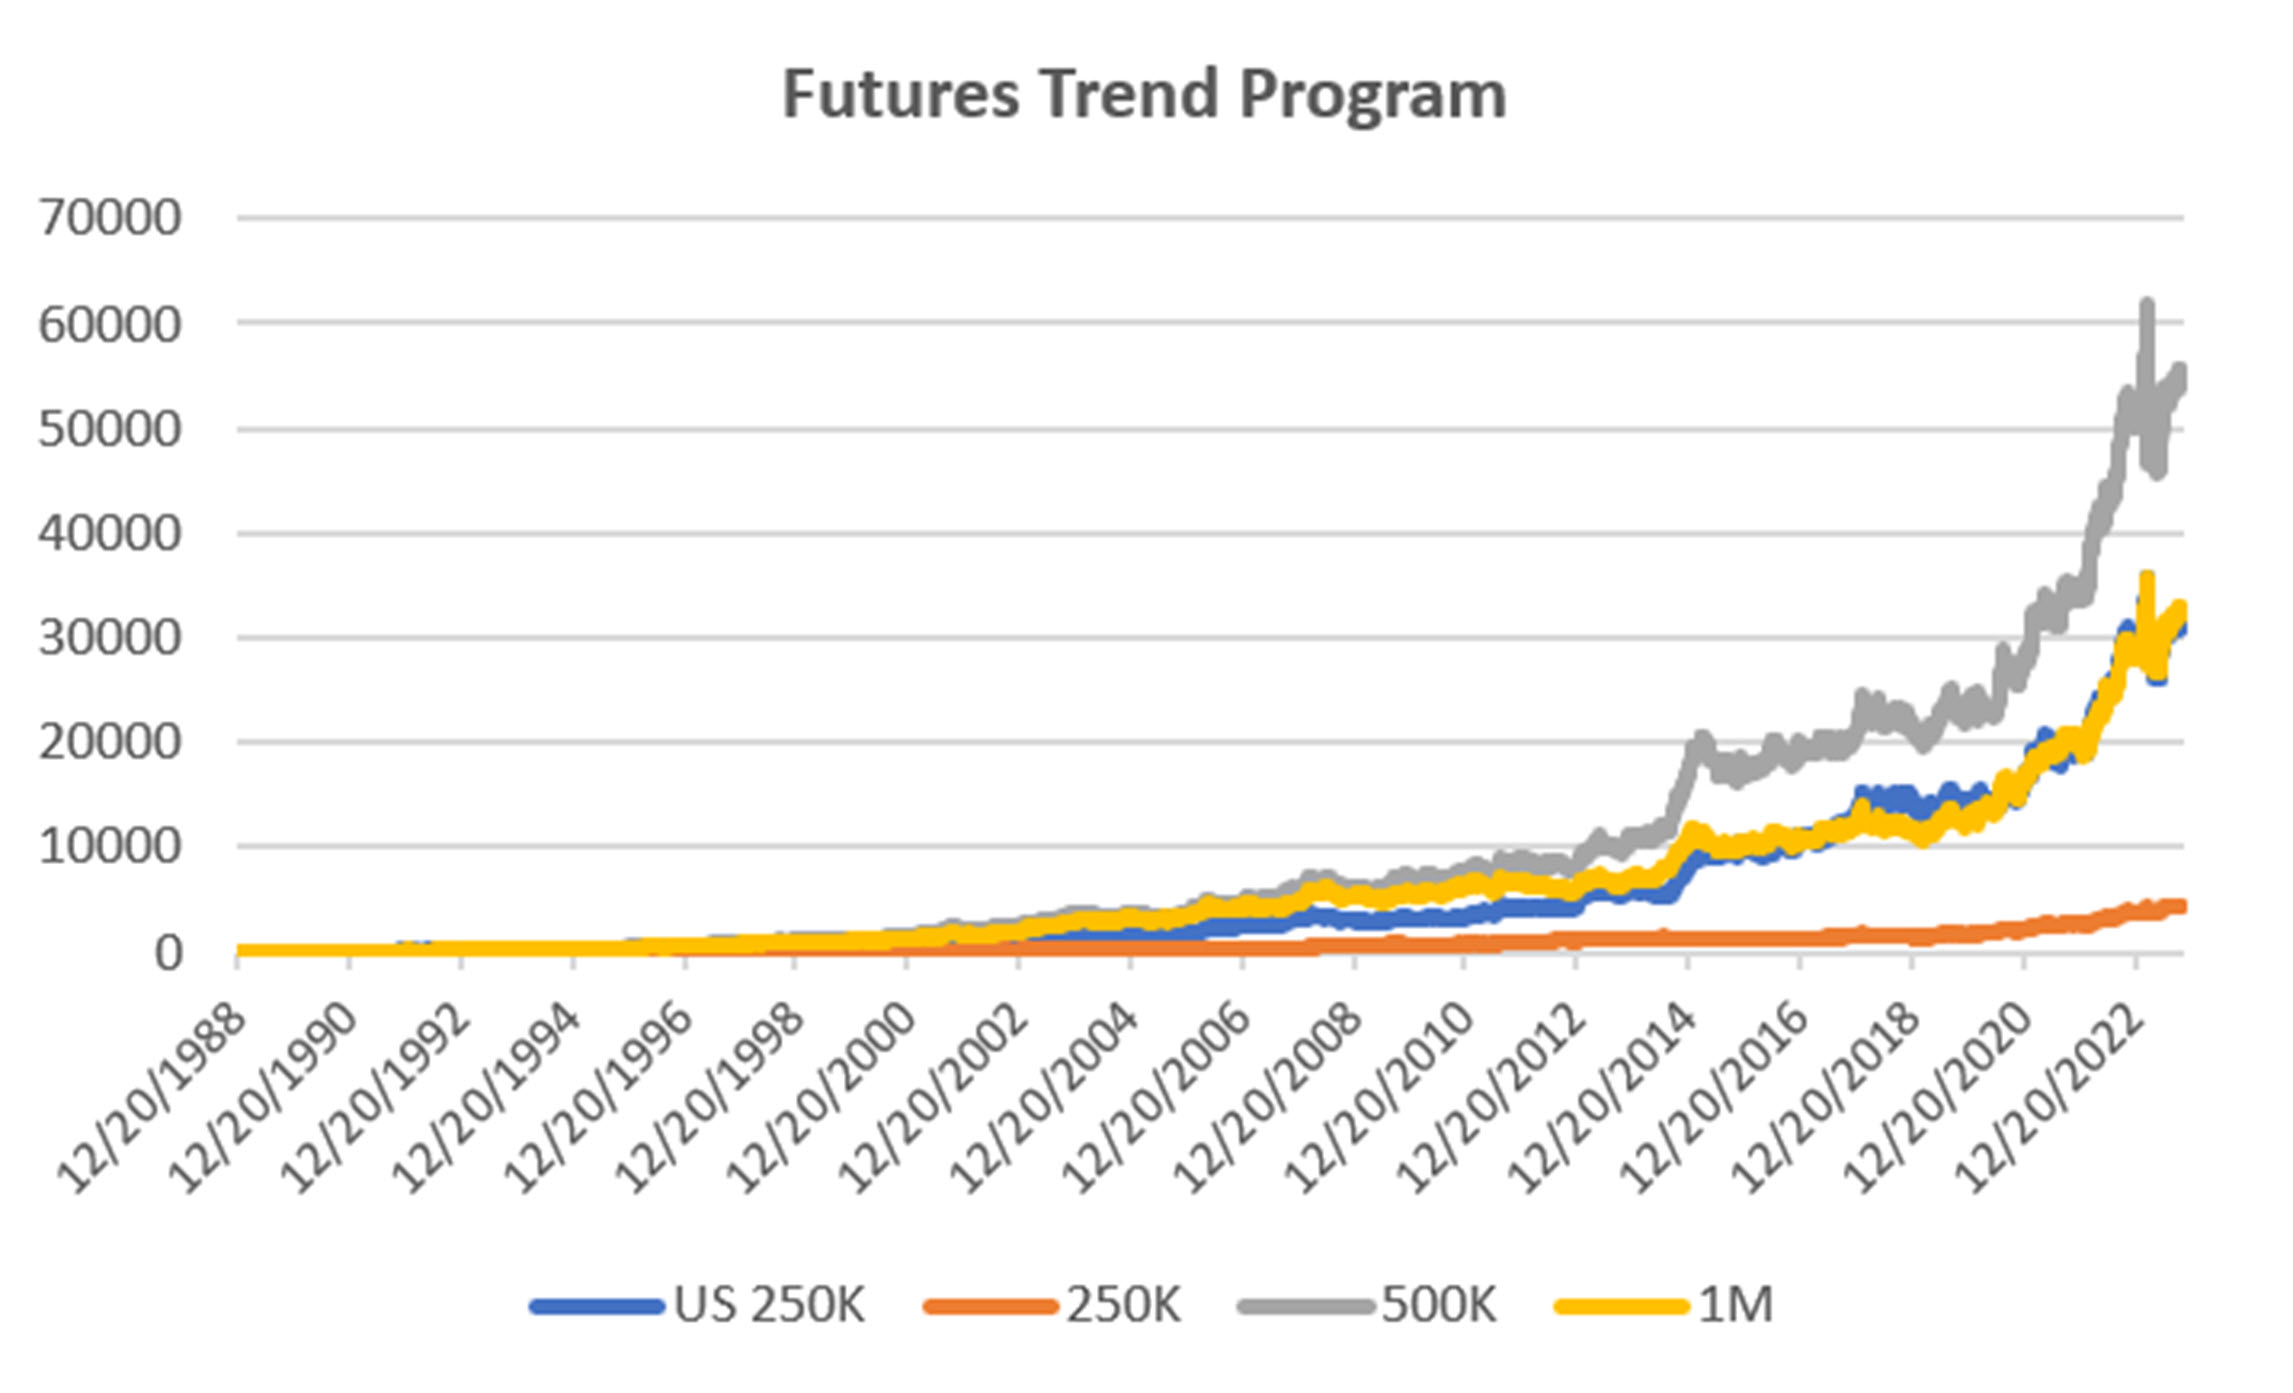
Groups DF1 and WF1: Daily Trend Program for Futures
Futures allow both high leverage and true diversification. The larger portfolios, such as $1million, are diversified into both commodities and world index and interest rate markets, in addition to foreign exchange. Its performance is not expected to track the U.S. stock market and is a hedge in every sense because it is uncorrelated. As the portfolio becomes more diversified its returns are more stable.
The leverage available in futures markets allows us to manage the risk in the portfolio, something not possible to the same degree with stocks. This portfolio targets 14% volatility. Investors interested in lower leverage can simply scale down all positions equally in proportion to their volatility preference. Note that these portfolios do not trade Asian futures, which we believe are more difficult for U.S. investors to execute. The “US 250K” portfolio trades only U.S. futures.
Mixed results for October, with the smaller accounts losing fractionally, and the bigger ones gaining fractionally. Still, the net result for the accounts are higher by 5% to 19%, a good result in a difficult market.
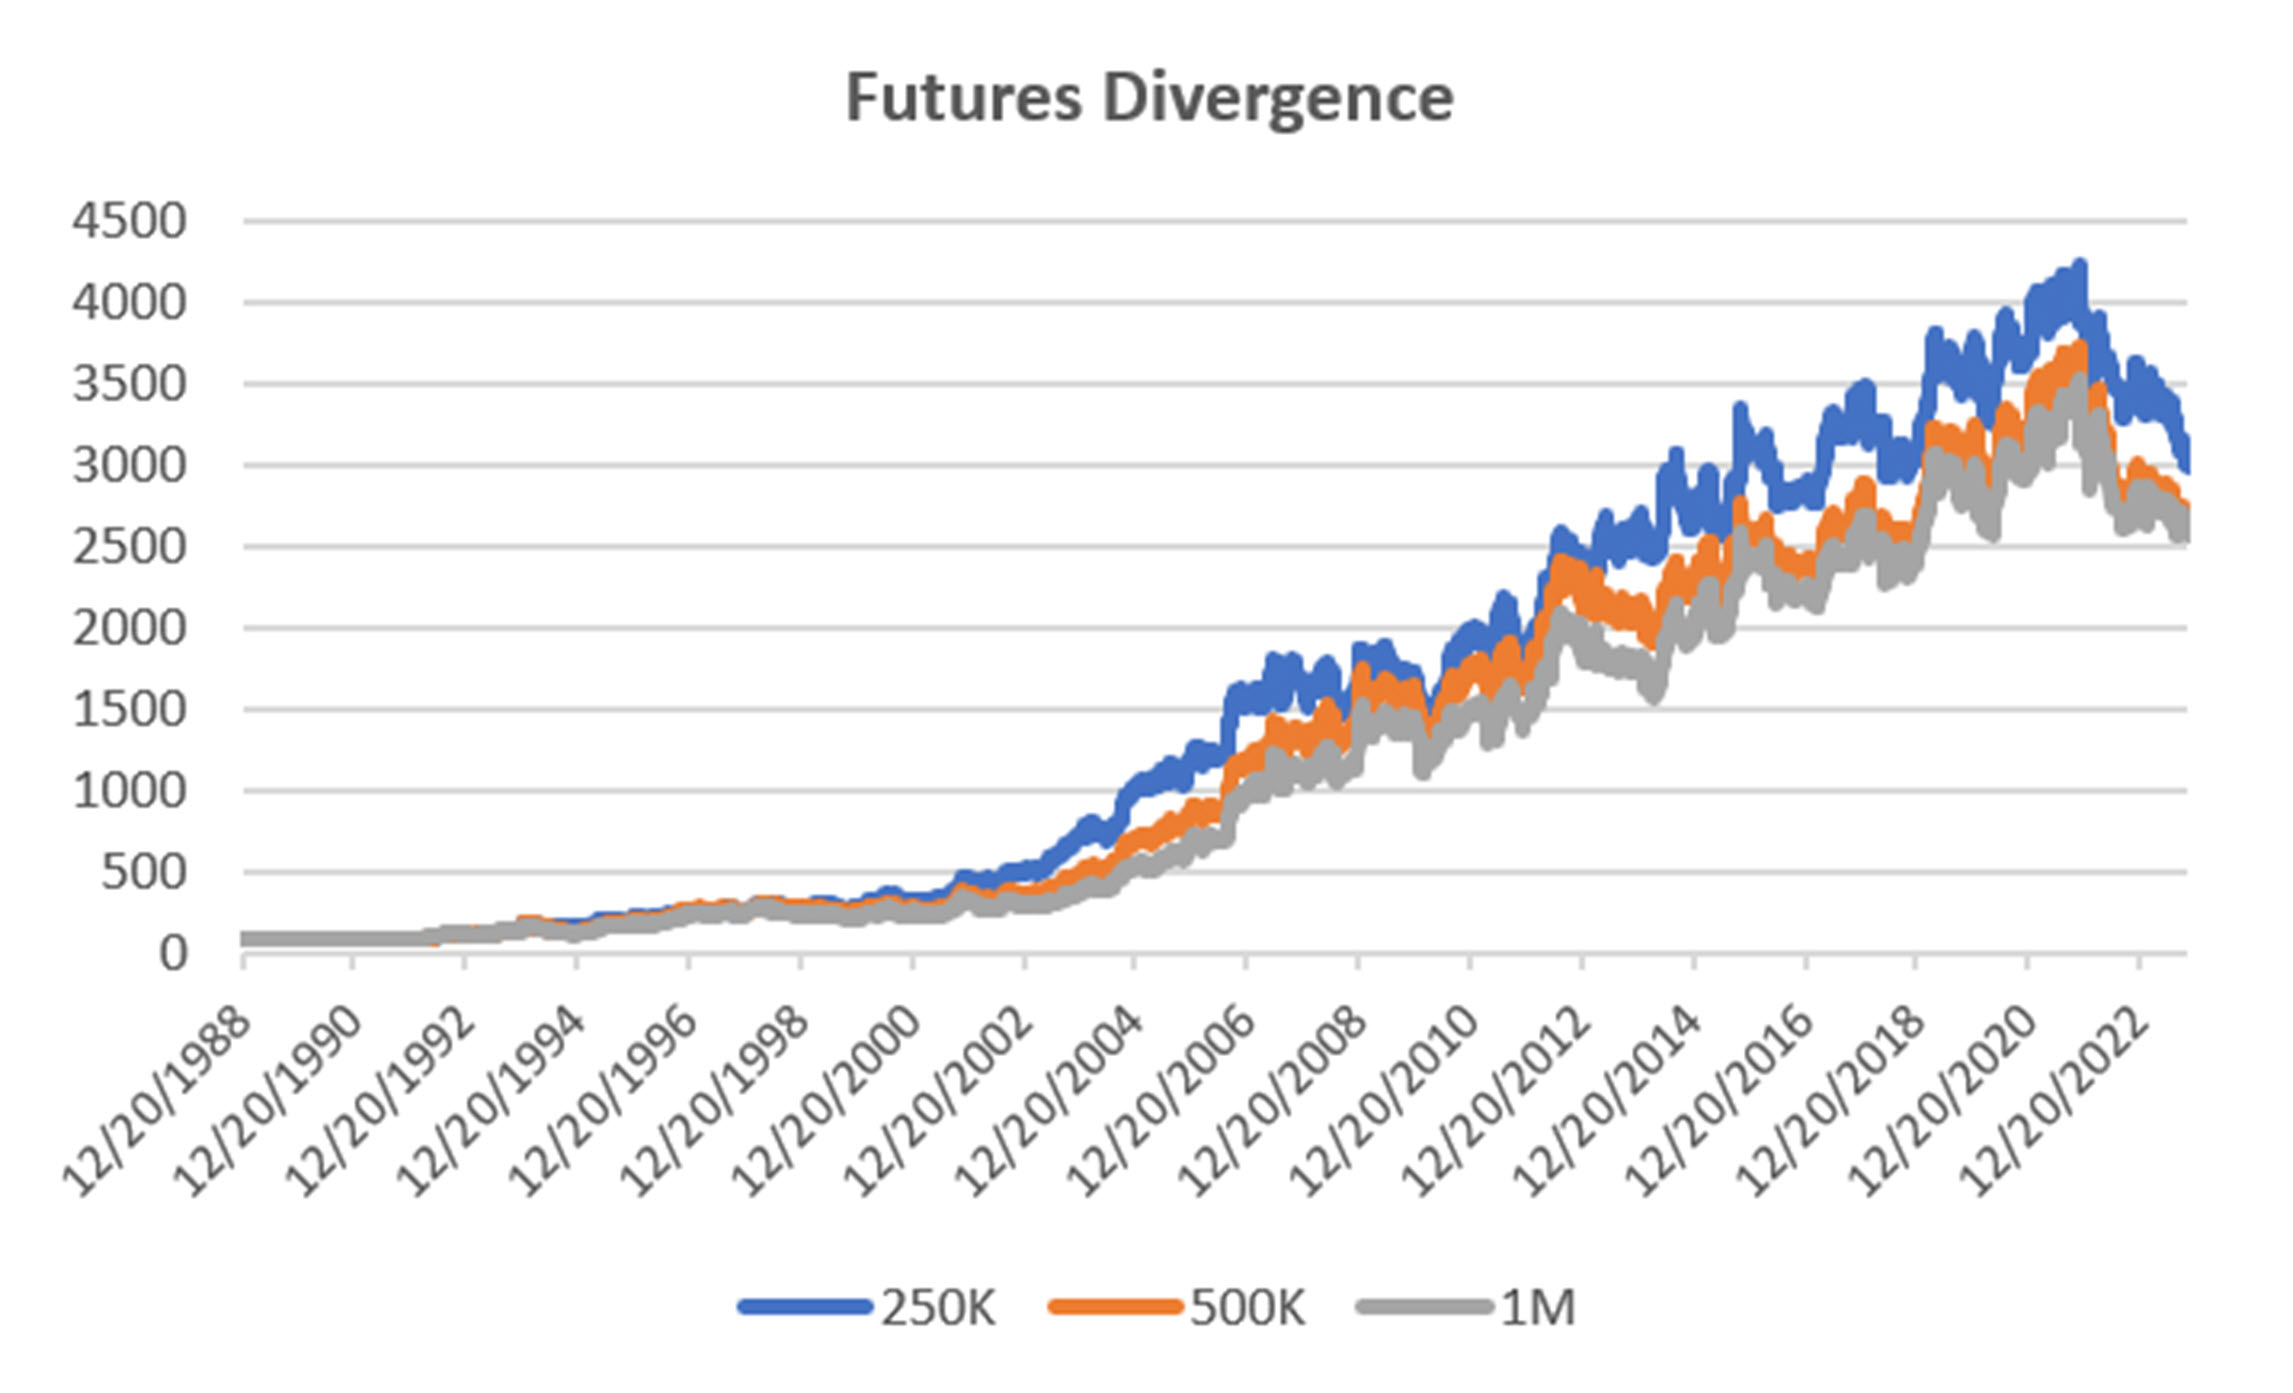
Group DF2: Divergence Portfolio for Futures
Just like the Equity Divergence Program, this strategy needs a trend to profit. It is now down 1% to 5% in its portfolios.
Blogs and Recent Publications
Perry’s books are all available on Amazon or through our website, www.kaufmansignals.com.
November 2023
Perry posted two articles on Seeking Alpha, “Compression Breakout: Giving a Boost to Your Entries,” and “Volatility: The Second Most Important Indicator.” In addition, he interview Herb Friedman in Technical Analysis of Stocks & Commodities. Herb is a interest rate specialist focusing on low risk investments.
October 2023
In this month’s Technical Analysis of Stocks & Commodities Perry shows how Merger Arb works and how an investor can participate in it. Merger Arb has been the realm of Institutions, but there are opportunities for everyone.
August 2023
Two(!) new articles by Perry in the August issue of Technical Analysis of Stocks & Commodities. The first is a look at how ChatGPT might help traders. It even asks for a computer program to use trend following.
The second article is “Portfolio Risk Dilemma,” where Perry answers the question of whether to let a stock or futures profit run or rebalance, and whether you should do the same for a diversified portfolio.
June 2023
Another article in Technical Analysis, “Protecting Your Wealth While Making a Profit.” It shows that moving money into different world equity markets can take advantage of momentum in both price and exchange rates.
May 2023
A new post on Seeking Alpha, “Profiting From Green Energy – But Not EVs” on May 31. Shows which stocks are best for investing in energy given the moving targets.
April 2023
On April 18th, Perry gave a webinar to the Society of Technical Analysts (London) on how to develop and test a successful trading system. Check their website for more details, https://www.technicalanalysts.com..
The April issue of Technical Analysis of Stocks & Commodities published a new article by Perry, “Repatriation,” an interesting trading pattern used by FX traders but adapted for us “normal traders.”
March 2023
Perry was interviewed by Mark Ursell of Ursell of TradeInform on March 3. You can see it or listen to it on UTube https://www.youtube.com/watch?v=9gIlIIzngCk.
A new article by Perry, “Can Volume Predict Price?” in the March issue of Technical Analysis of Stocks & Commodities. You’ll need to read it to find out!
February 2023
The February 2023 issue of Technical Analysis of Stocks & Commodities published Perry’s article, “Do Small Price Changes Matter?” It tells you whether you should be ignoring those days when prices close up or down by a fraction.
Perry gave a webinar to Eduardo Lopez’ Robotrader students in Spain on Wednesday, February 8, noon (New York).
January 2023
Another year! Technical Analysis of Stocks & Commodities published “Matching the Markets to the Strategy” in the January issue. It is a look at why certain markets do best with specific strategies and why that can materially improve results.
Alejandro de Luis will publish Perry’s article “Living Off Profits,” translated into Spanish, in the January issue of his magazine, Hispatrading. It’s a good way to practice your Spanish!
Seeking Alpha posted Perry’s article, “How To Hedge Your Equity Portfolio,” showing a way to follow the Fed action.
Older Items of Interest
Perry’s webinar on risk, given to the U.K. Society of Technical Analysts, can be seen using the following link: https://vimeo.com/708691362/04c8fb70ea
For older articles please scan the websites for Technical Analysis of Stocks & Commodities, Modern Trader, Seeking Alpha, ProActive Advisor Magazine, and Forbes. You will also find recorded presentations given by Mr. Kaufman at BetterSystemTrader.com, TalkingTrading.com, FXCM.com, systemtrade.pl, the website for Alex Gerchik, Michael Covel’s website, TrendFollowing.com, and Talking Trading.com.
In May 2021, Mr. Kaufman gave a 30-minute presentation, “Lagged Trends,” for The Money Show on Tuesday, May 11. You can see it using the following link: https://youtu.be/bh2fA8oBwBk
You will also find back copies of our “Close-Up” reports on our website, www.kaufmansignals.com. You can address any questions to kaufmansignalsdaily@gmail.com.
© October 2023, Etna Publishing, LLC. All Rights Reserved.