

In this program, you can choose:
- Daily or Weekly Stocks
- (Daily includes Macrotrend, Daily Income Focus, DowHedge, and High-Risk Portfolio)
- (Weekly includes Macrotrend, Weekly Income Focus and Sector Rotation)
- Daily or Weekly Futures
- Both Equities and Futures
The Macrotrend programs have multiple portfolios to help fit your investment needs.
For the updated performance of any program,
please read our latest Performance Report > here
Our TREND programs offer a variety of strategies where the main component is the trend. These vary from medium-term to long-term holding periods.
The macrotrend program targets long-term price trends related to economic policy or structural shifts in supply/demand. These trends are most often driven by Central Bank interest rate policy. In the U.S., that is the Federal Reserve. This concept is the basis for most hedge funds and managed account programs and has been profitable for over 30 years. A large percentage of their capital goes to trend-following interest rates.
I can personally say that I both love and hate trend-following, and both at the same time. There is no doubt that trend-following works, but it can have large drawdowns when the major trend turns. From 2009 to 2019, macrotrend strategies, most popular among futures traders, have had outstanding returns due to a low-volatility bull market supported by historically low-interest rates.
In 2022 that changed when hyperinflation surfaced, blamed on too many years of easy money. Good times turned into bad times. How do you control the risk? Experience says, “disciplined trading.” Stay with the trend when the market allows, reduce exposure during a downturn, and reduce exposure when volatility is high. Choose stocks or futures markets that are profitable, given the economic situation. A macrotrend strategy does all that well, but it doesn’t guarantee yearly profits. No trading program, whether algorithmic or discretionary, can do that.
Macrotrend Returns, Discipline, and Insurance
Using a trend system needs to be viewed as insurance, but insurance with a very good payout. It will allow you to stay in a bull market, as we saw from 2009 to 2019. But the best returns were in futures during the financial crisis of 2008 when the stock market collapsed and again in 2022. It is a phenomenon called “crisis alpha,” where a smaller investment in futures can offset a much larger exposure in stocks. Many futures funds gained 50%, while long stock portfolios lost that amount. That is not a guarantee that the same thing will happen during the next stock sell-off, but a combination of selling short and leverage makes futures a good hedge.
The need for disciplined trading cannot be over-emphasized. There are brilliant discretionary traders, but that requires exceptional talent and huge amounts of time. You don’t make profits by luck, and don’t do it without investing a considerable effort. And discretionary traders are usually “systematic.” They don’t use a computer to produce trading signals but have a routine and look for special set-ups. No one succeeds without a plan and discipline.
Not All Trend-Following Is the Same
There are similarities and differences in trend-following strategies. All of them must capture the largest part of the trend, but some do it by trading in and out of smaller moves, while others try to hold the same position for as long as possible. Both approaches have merit because they target the same concept — only trade in the direction of the trend. The unique features of our macrotrend program are:
- Equities trade only the strongest trends, while futures scale in and out of positions as the trend increases in strength and changes direction.
- All positions are risk-adjusted for increased diversification. Equities and futures use different methods to achieve the same outcome.
- Multiple trends are used based on a range of non-linear calculation periods to avoid a program that is biased toward faster or slower trends.
- Multiple confirmations are used to confirm the validity of the trend.
Not All Markets Work for All Strategies
Some stocks and futures markets perform better with trend following, others with mean-reverting methods. The challenge is to find the markets that work best for each strategy. One way of doing that is to measure the market “noise.” Using our “Efficiency Ratio” we can separate the trending from the mean-reverting markets. Using futures as an example, the chart below is a small sample that shows the ranking of trending markets (on the left) to non-trending (on the right).
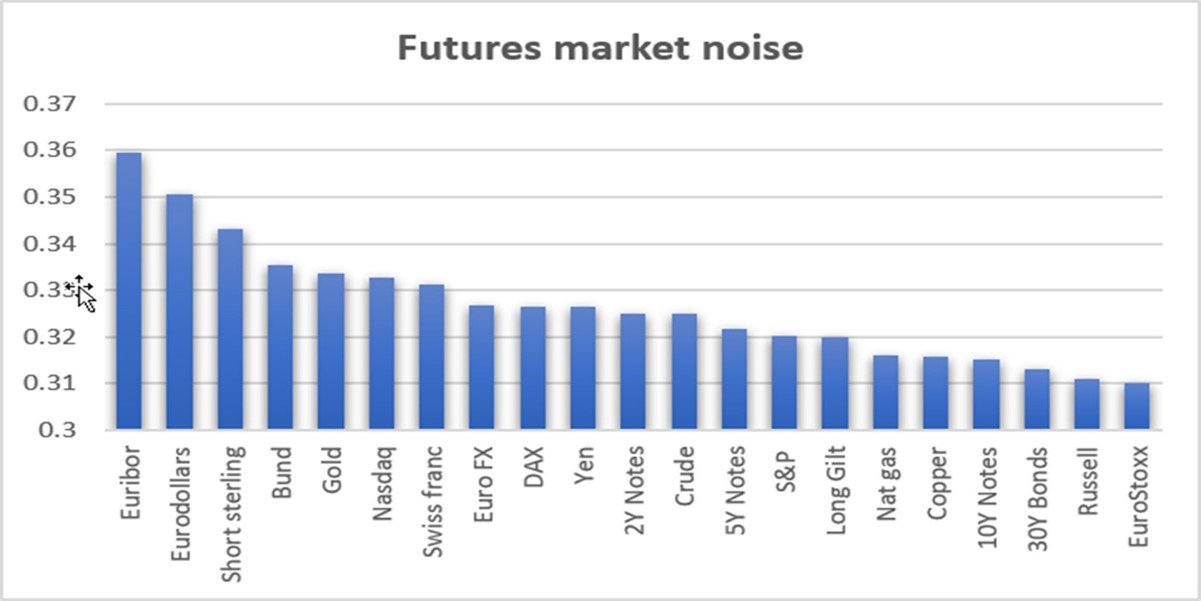
Chart 1. Ranking markets by trending (left) and mean-reverting (right)
As the chart shows, the best sector is interest rates, and the worse is the equity index markets. Even with that, equity index markets have a long-term trend offering portfolio diversification. And within the concept of an equity “index” are many stocks that have strong trends. Among them have been Tesla and Amazon. It is the job of the stock selection process to find the ones that are currently returning consistent profits.
Daily and Weekly Equity Macrotrend Programs
We offer both daily and weekly versions of our Equity Trend Program. They use the same stock selection, trend method, and risk controls. Over the long term, they have similar returns, seen in the table below (daily at the top, weekly at the bottom). Other trend-based programs are also shown and discussed further down.
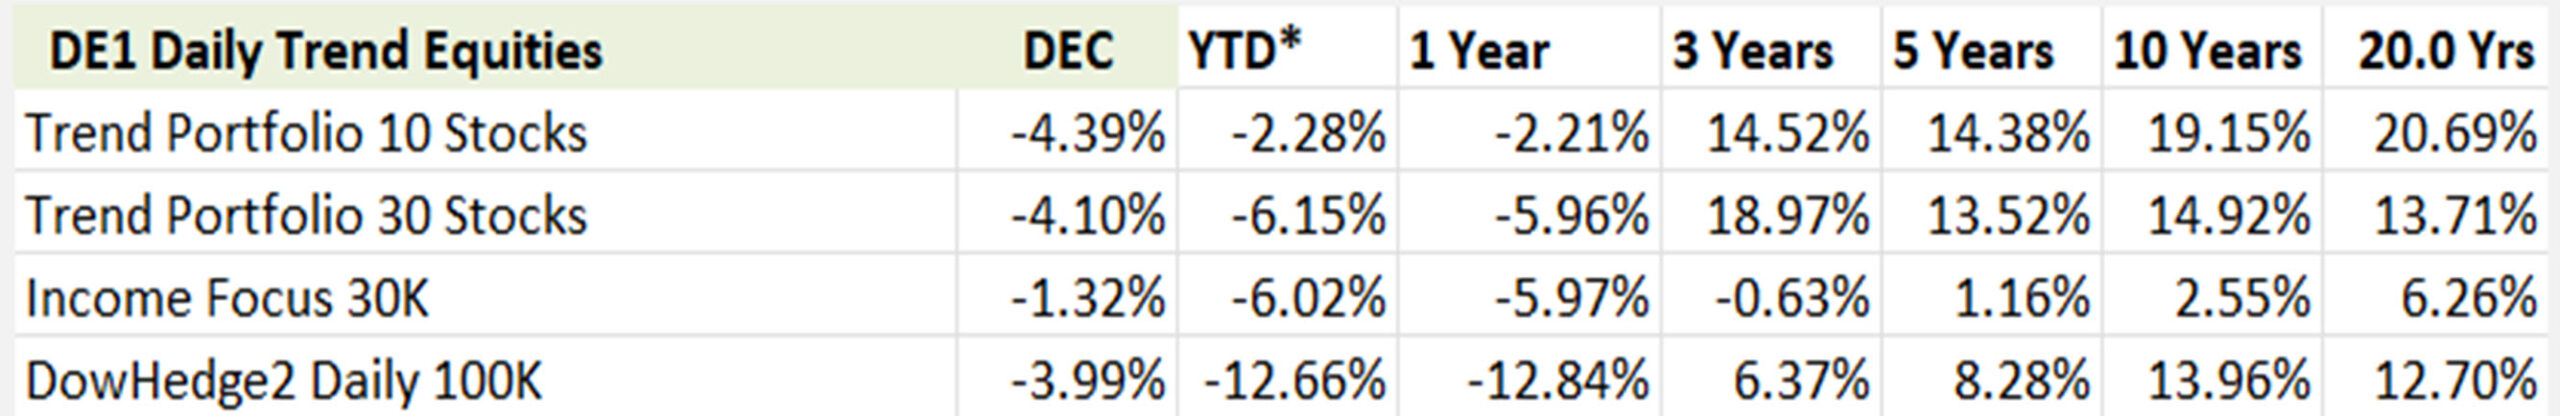

Equity Macrotrend tracking performance, Daily (top) and Weekly (bottom).
We track the daily and weekly returns by capturing the total returns at the bottom of the Order sheets. We can then create charts showing the long-term stock performance, as seen below.
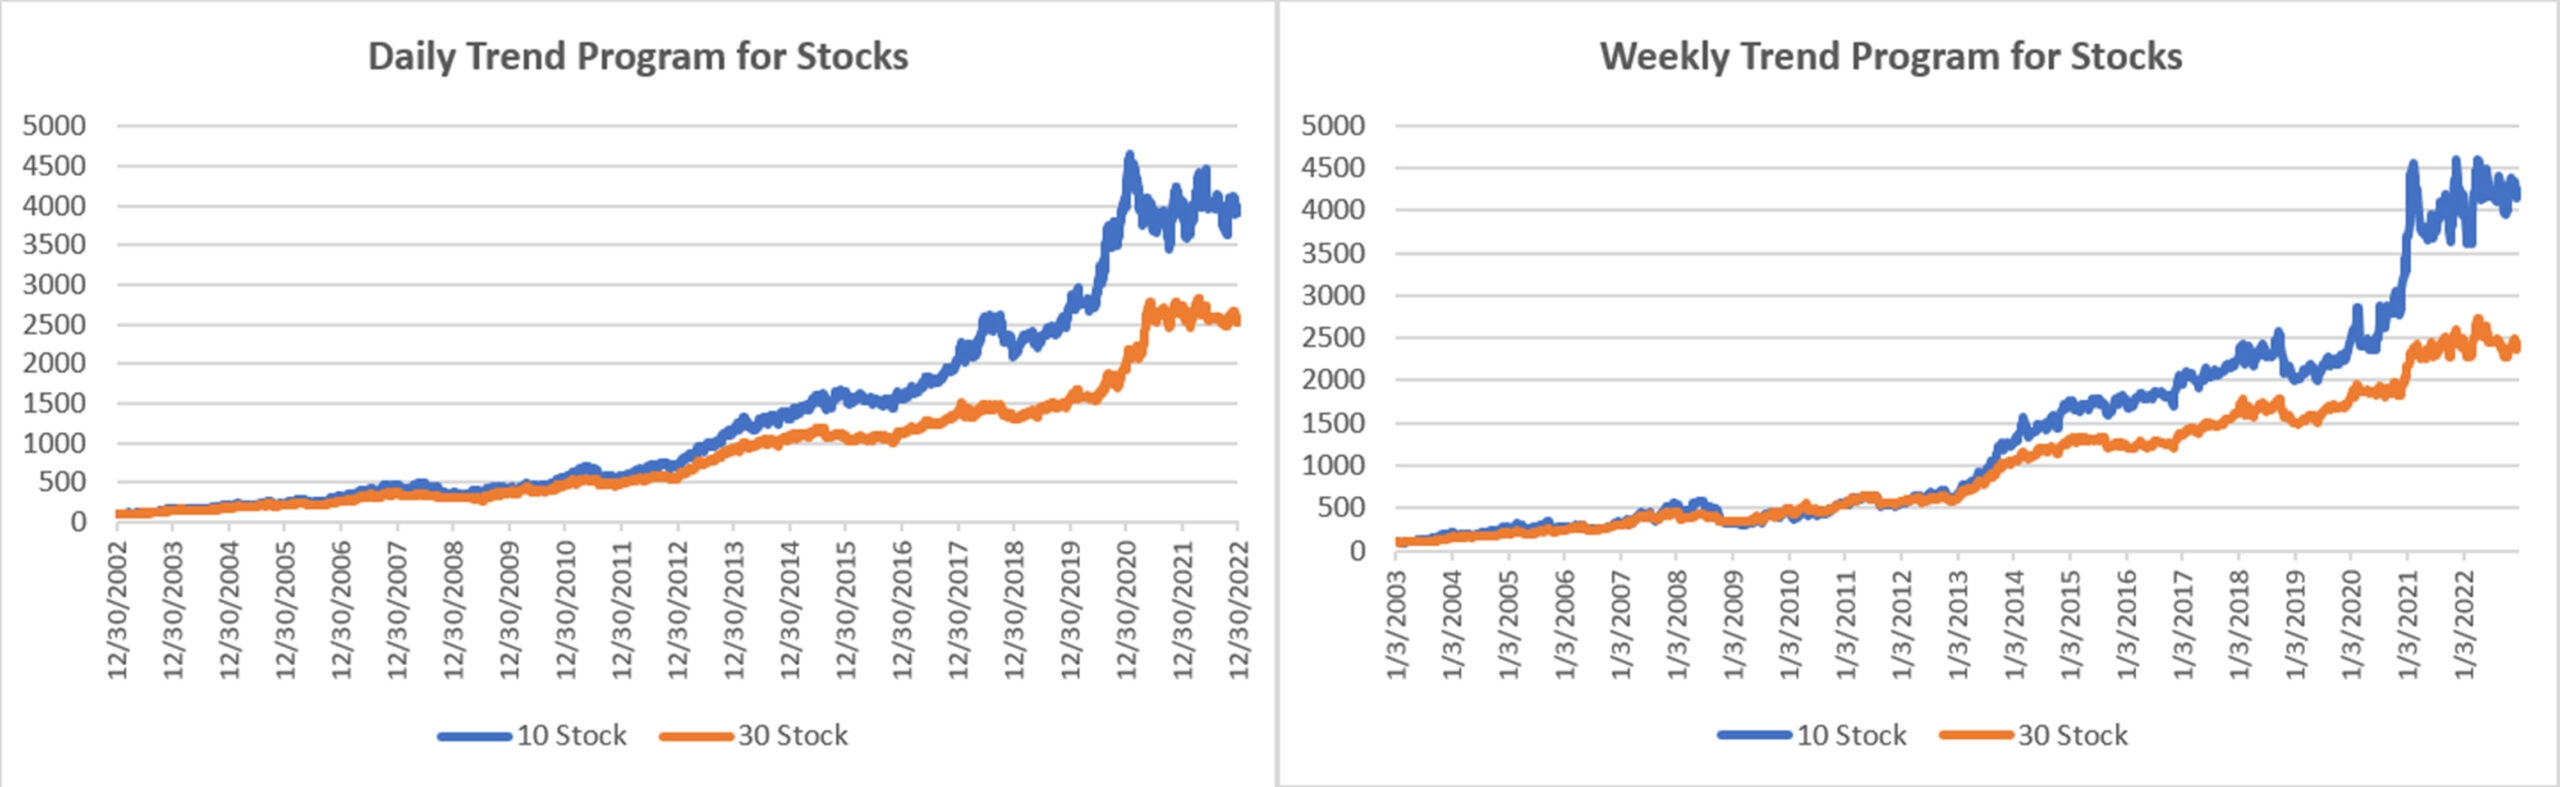
Chart 2. Tracking results for Equity Trend portfolios through 2022.
This is called a “high-risk” portfolio, because in order to get high returns you need to accept high risk.
High-Risk Portfolio Description
At this writing, the program will only trade technology and healthcare, two markets that seem likely to continue to be the best sectors in the stock market. Technology will include semiconductors, artificial intelligence, and those companies benefiting from them. We also include healthcare because of medical innovation and to add diversification. We are including two portfolios, 5 stocks and 10 stocks in our DE1 subscription.
Make no mistake, because of the narrow scope and few stocks in the portfolio, this program has high risk. On the other hand, our tests show it has an outstanding return on capital. We will continue to track the performance to be sure it lives up to expectations.
The program uses the same Trend system as our other trend portfolios, only the candidate stocks are limited to 71 stocks in both technology and healthcare. We tested the stocks from 2002, but not all technology stocks go back that far, so early returns may not reflect the whole picture.
Please note that this program went “live” on February 20, 2024. It is new. Results before that date are hypothetical. While it uses the same strategy as our Trend systems, returns and risk can always be higher than in the past.
How Much Risk Are You Willing to Take?
If you are in the stock market, investing in the S&P ETF (SPY) since 2002, you would have made 8.8% but have had a maximum drawdown of 55%. In Nasdaq, have you participated in the dot.com collapse in 2000, you would have lost 90%. Of course, all of those markets have recovered, so you might say you would have stayed with the investment and absorbed the loss. You would have been one of the few. My mother was one of those!
The only “riskless” investment is U.S. Treasuries. The 10-year bond (the industry benchmark) has been at 2% for years, only recently touching 5% before declining. At some point it will be back to 2%. Bank Certificates of Deposit (CDs) are guaranteed by the bank. The more substantial the bank, the lower the rate. Those that held CD from Lehman Bros lost most of the money in 2008. Municipal bonds are a good investment. You support your local government, which normally works out well and offers a slightly higher rate and can have tax benefits.
If anyone offers you 25% with no risk, walk away.
Do the Returns Justify the Risk?
The two tables below show the results of our testing. On the left is the 5-stock portfolio; on the right is the 10-stock portfolio. Our tests shows that the 5-stock portfolio has higher return and a better “payout.” That is, the return to risk ratio is better (lower line). “Return-to-risk” is the way we judge an investment. Very few investments achieve a ratio of 1.0. Since 2002, the SPY has a ratio of 0.46; you need to take (on average) twice the risk, 19.2%, to achieve its return of 8.8%.
In our new program, risks are smaller (line 2 in Table 1) in the 10-stock portfolio (right) due to more diversification. To achieve that, we see lower returns (line 1). In the last three years (as of this writing in February 2024), technology and healthcare have been in focus, the 5-stock account returned nearly twice that of the 10-stock account, but with higher risk.
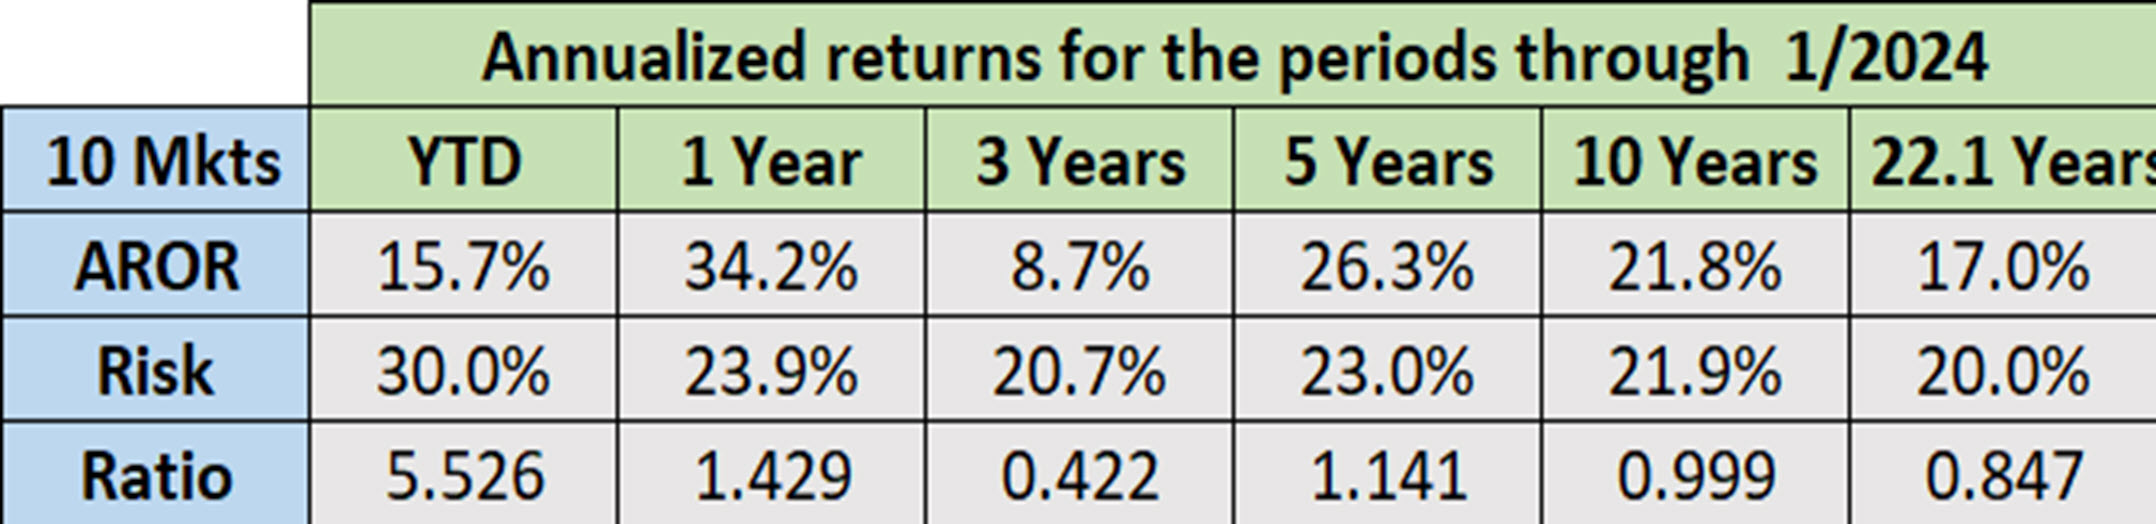
Tables 1. Performance profile. Top: 5 stocks, Bottom: 10 stocks.
The two charts below show the history of our tests, again through mid-February 2024. While the 5-stock has had smaller drawdowns, we expect that large drawdowns will occur in each portfolio.
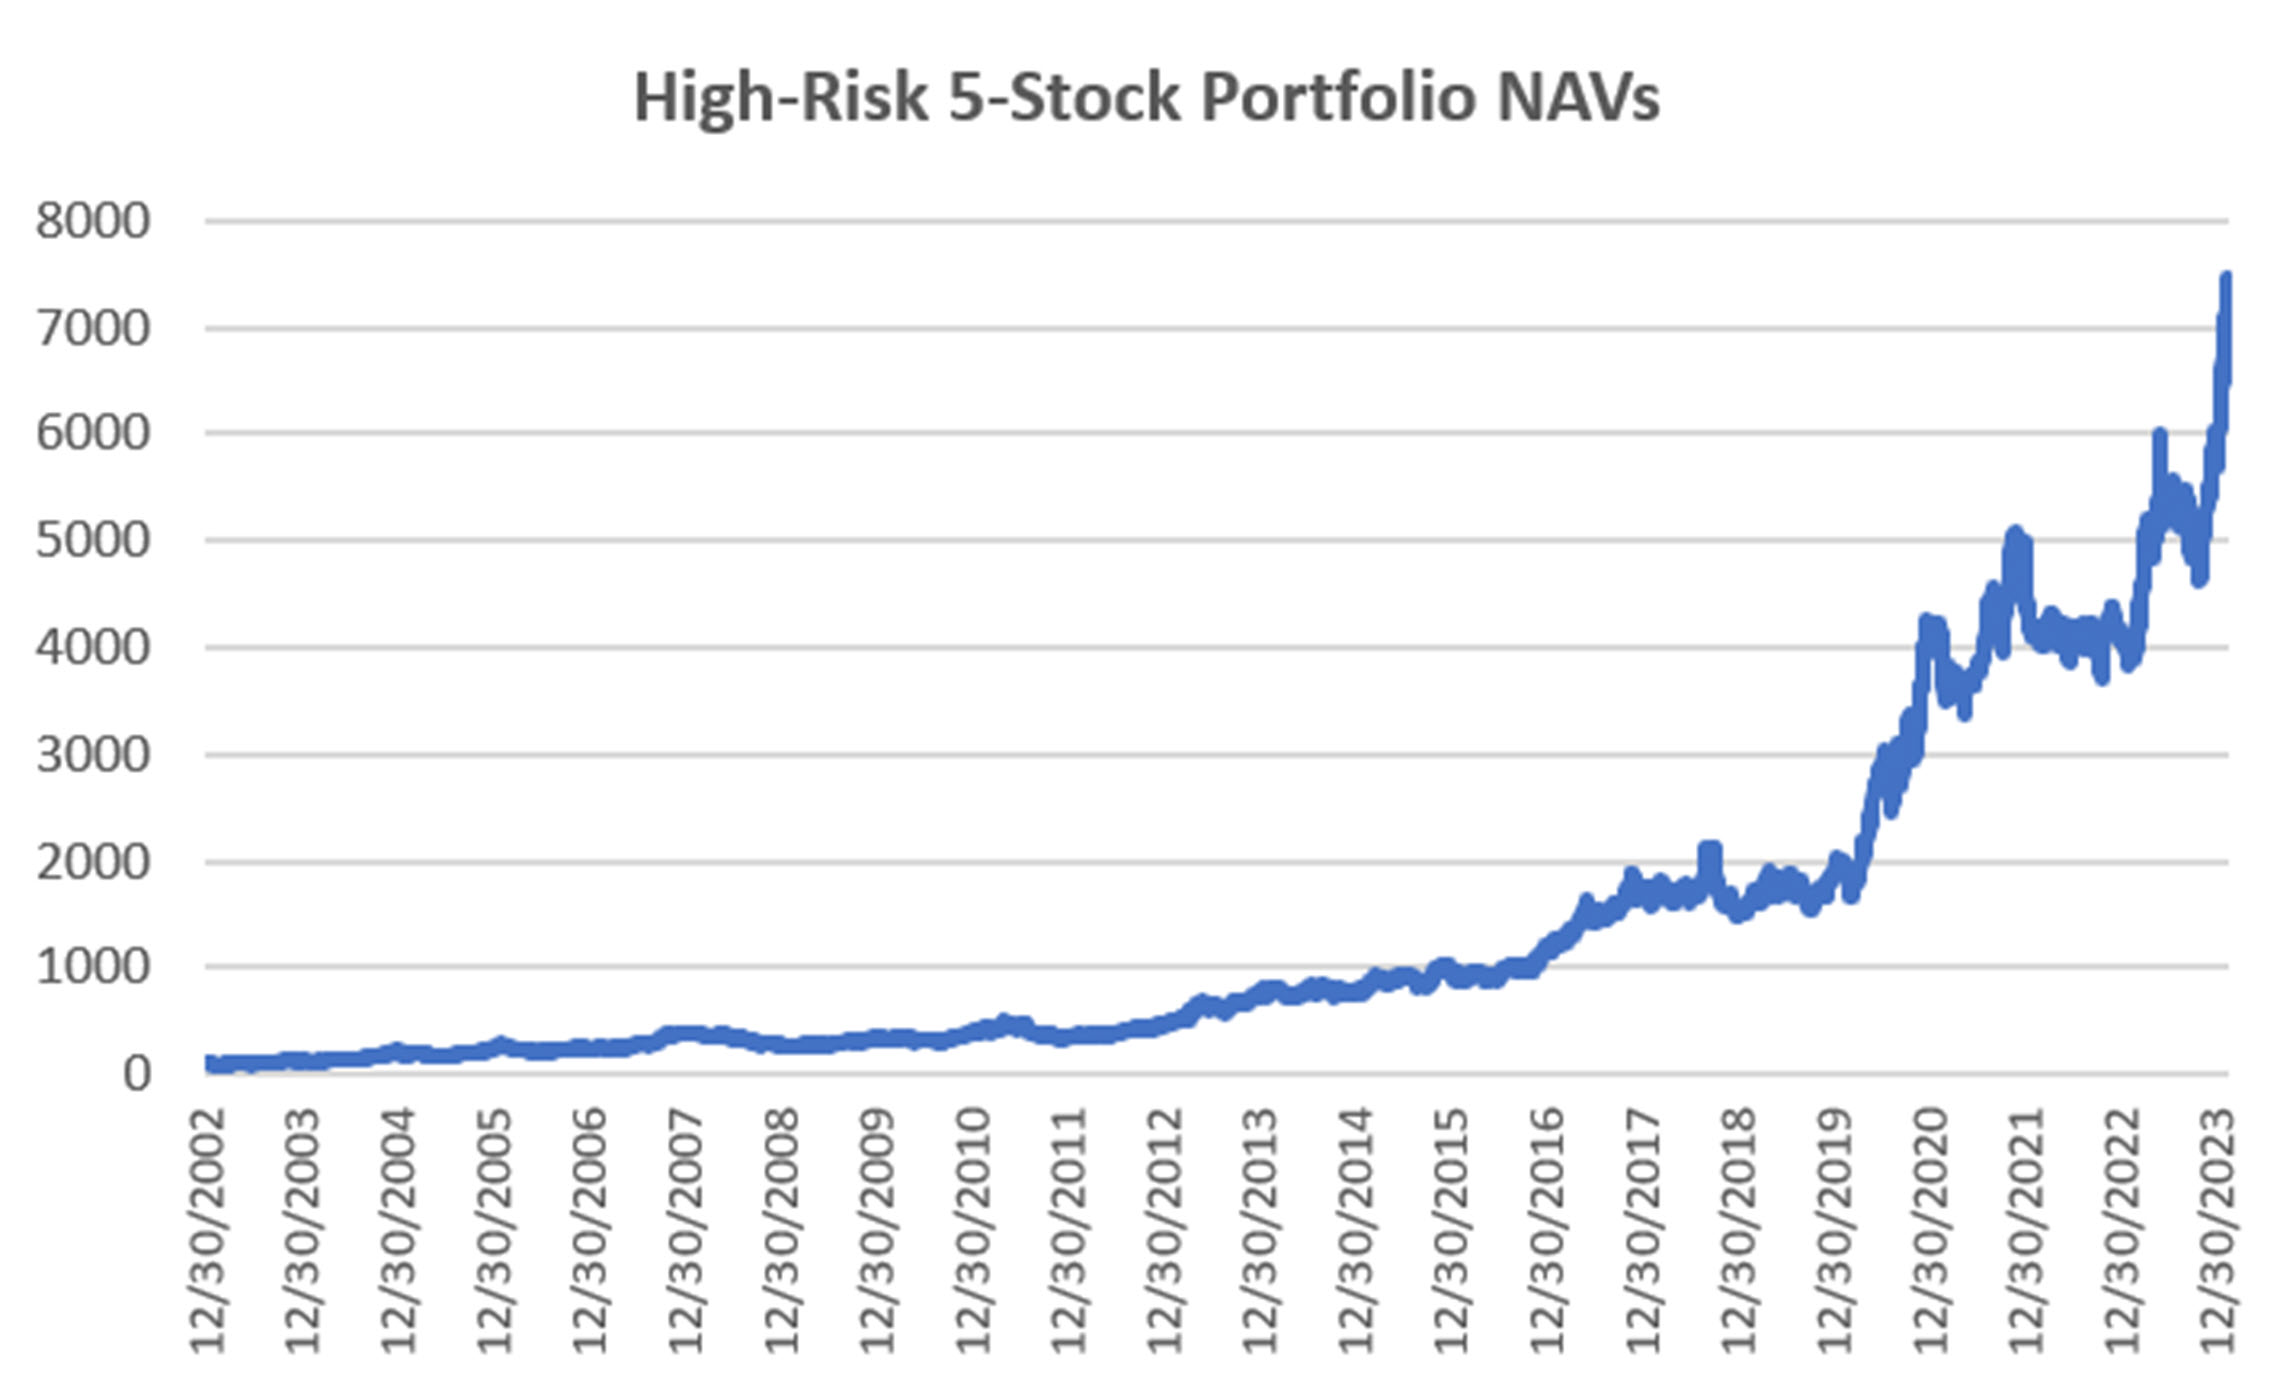

Chart 1 Returns of both 5- and 10-stock portfolios. Top: 5-stocks, bottom: 10 stocks.
Drawdowns
Looking at a history of the drawdowns (Chart 2), we see that the 5-stock has larger drawdowns due to its lack of diversification. It will often hold only artificial intelligence or semiconductor stocks or all healthcare (during Covid), only to suffer a reversal in the entire portfolio. In the charts below, you can see that the 10-stock has overall lower drawdowns. However, both drawdowns are quite large for the risk-averse traders or those who don’t sleep well during a drawdown.
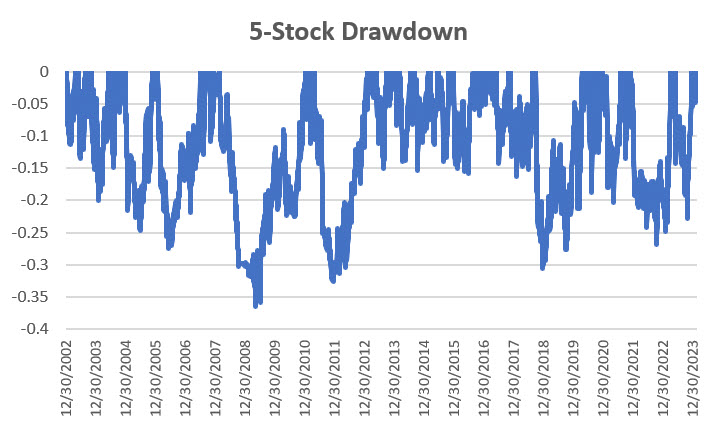

Charts 2. (Top) Drawdown for the 5-stock portfolio. (Bottom) Drawdowns for the 10-stock portfolio.
The Way the Portfolio Selection Works
We evaluate how each stock performs each day based on our 6 trend criteria. We then rank the most recent performance and choose the top 5 or 10 stocks for the portfolio. If one stock falls out of the top tier, it is dropped and replaced with another stock with higher returns. We believe this works because of “persistence,” the ability to keep profitable stocks in an uptrend.
When ranking, all returns must be above zero, but with no special pattern. If we are in a downturn, we may find that no stocks qualify, and we have no positions in the portfolio. Switching positions based on ranking tends to avoid giving back a lot of trend profits and reduces the average holding time for a stock to less than 20 days.
Extreme Exits
Markets can get very volatile, especially the stocks in the news. Artificial intelligence and healthcare are high on the list of news-worthy stocks. News can drive up prices, then turn and drive them down.
If the annualized portfolio volatility goes above 0.40, we have found that the risk is greater than the reward and we exit the entire portfolio. High risk can cause large losses, even while we hope they don’t. We reenter the portfolio when the volatility drops, often selecting different stocks. The market offers many opportunities to generate profits without extreme risk.
Summary
We believe that technology, especially stocks dealing with artificial intelligence, plus healthcare, are the likely drivers for the next year, perhaps longer. While healthcare is less volatile, it will continue to be important to serve the public and our growing senior population. Diet drugs seem to be the latest evolution.
Although AI is now the rage, technology is forward looking. If not AI, then something else. Who would have guessed a year ago that AI would be the new technology. We expect there will be a lot of competition, much like electric cars, and that will reduce volatility until the next innovation. If that happens, we will add/change new markets to the program.
The good news about our process is that it can sort out the stocks that are moving and avoid those that have faded. It provides discipline.
Position Size and Compounding
All equity positions are sized by dividing the portfolio investment by the number of stocks, then dividing that allocation by the closing price on the day before the entry order.
For example, the 10-stock portfolio has a nominal investment of $100,000. Divided by 10, that gives each stock an allocation of $10,000. Divide that by the stock's closing price, and you have the position size. We do not rebalance the portfolio; we let the profits run.
This method tries to equalize the risk of each stock. It is not perfect, but it serves the purpose and is much easier than true risk parity. To remove the greatest imbalance and improve liquidity, we do not trade stocks priced under $10.
Each new trade will have a size based on 1/10 of your current equity as your investment increases. That will allow for compounding, which is necessary if you are going to get the same returns that we post in our performance report.
You can reduce the portfolio size by allocating $5,000 per stock or less, but commission costs will have a greater impact on your returns. Our performance reflects a charge of $8 per trade, but a lower fee will significantly improve the returns. We have found that it’s best to commit at least $7,500 to each stock.
Daily and Weekly Orders
Each evening we send the orders for the next open. Weekly traders get them on Friday evening for the Monday open. A sample of the Daily Order sheet is below, followed by a sample of the Weekly Order sheet. The Daily Order sheet shows two orders to exit on the next open. The Weekly Order sheet shows two stocks that we exited on the previous Monday.
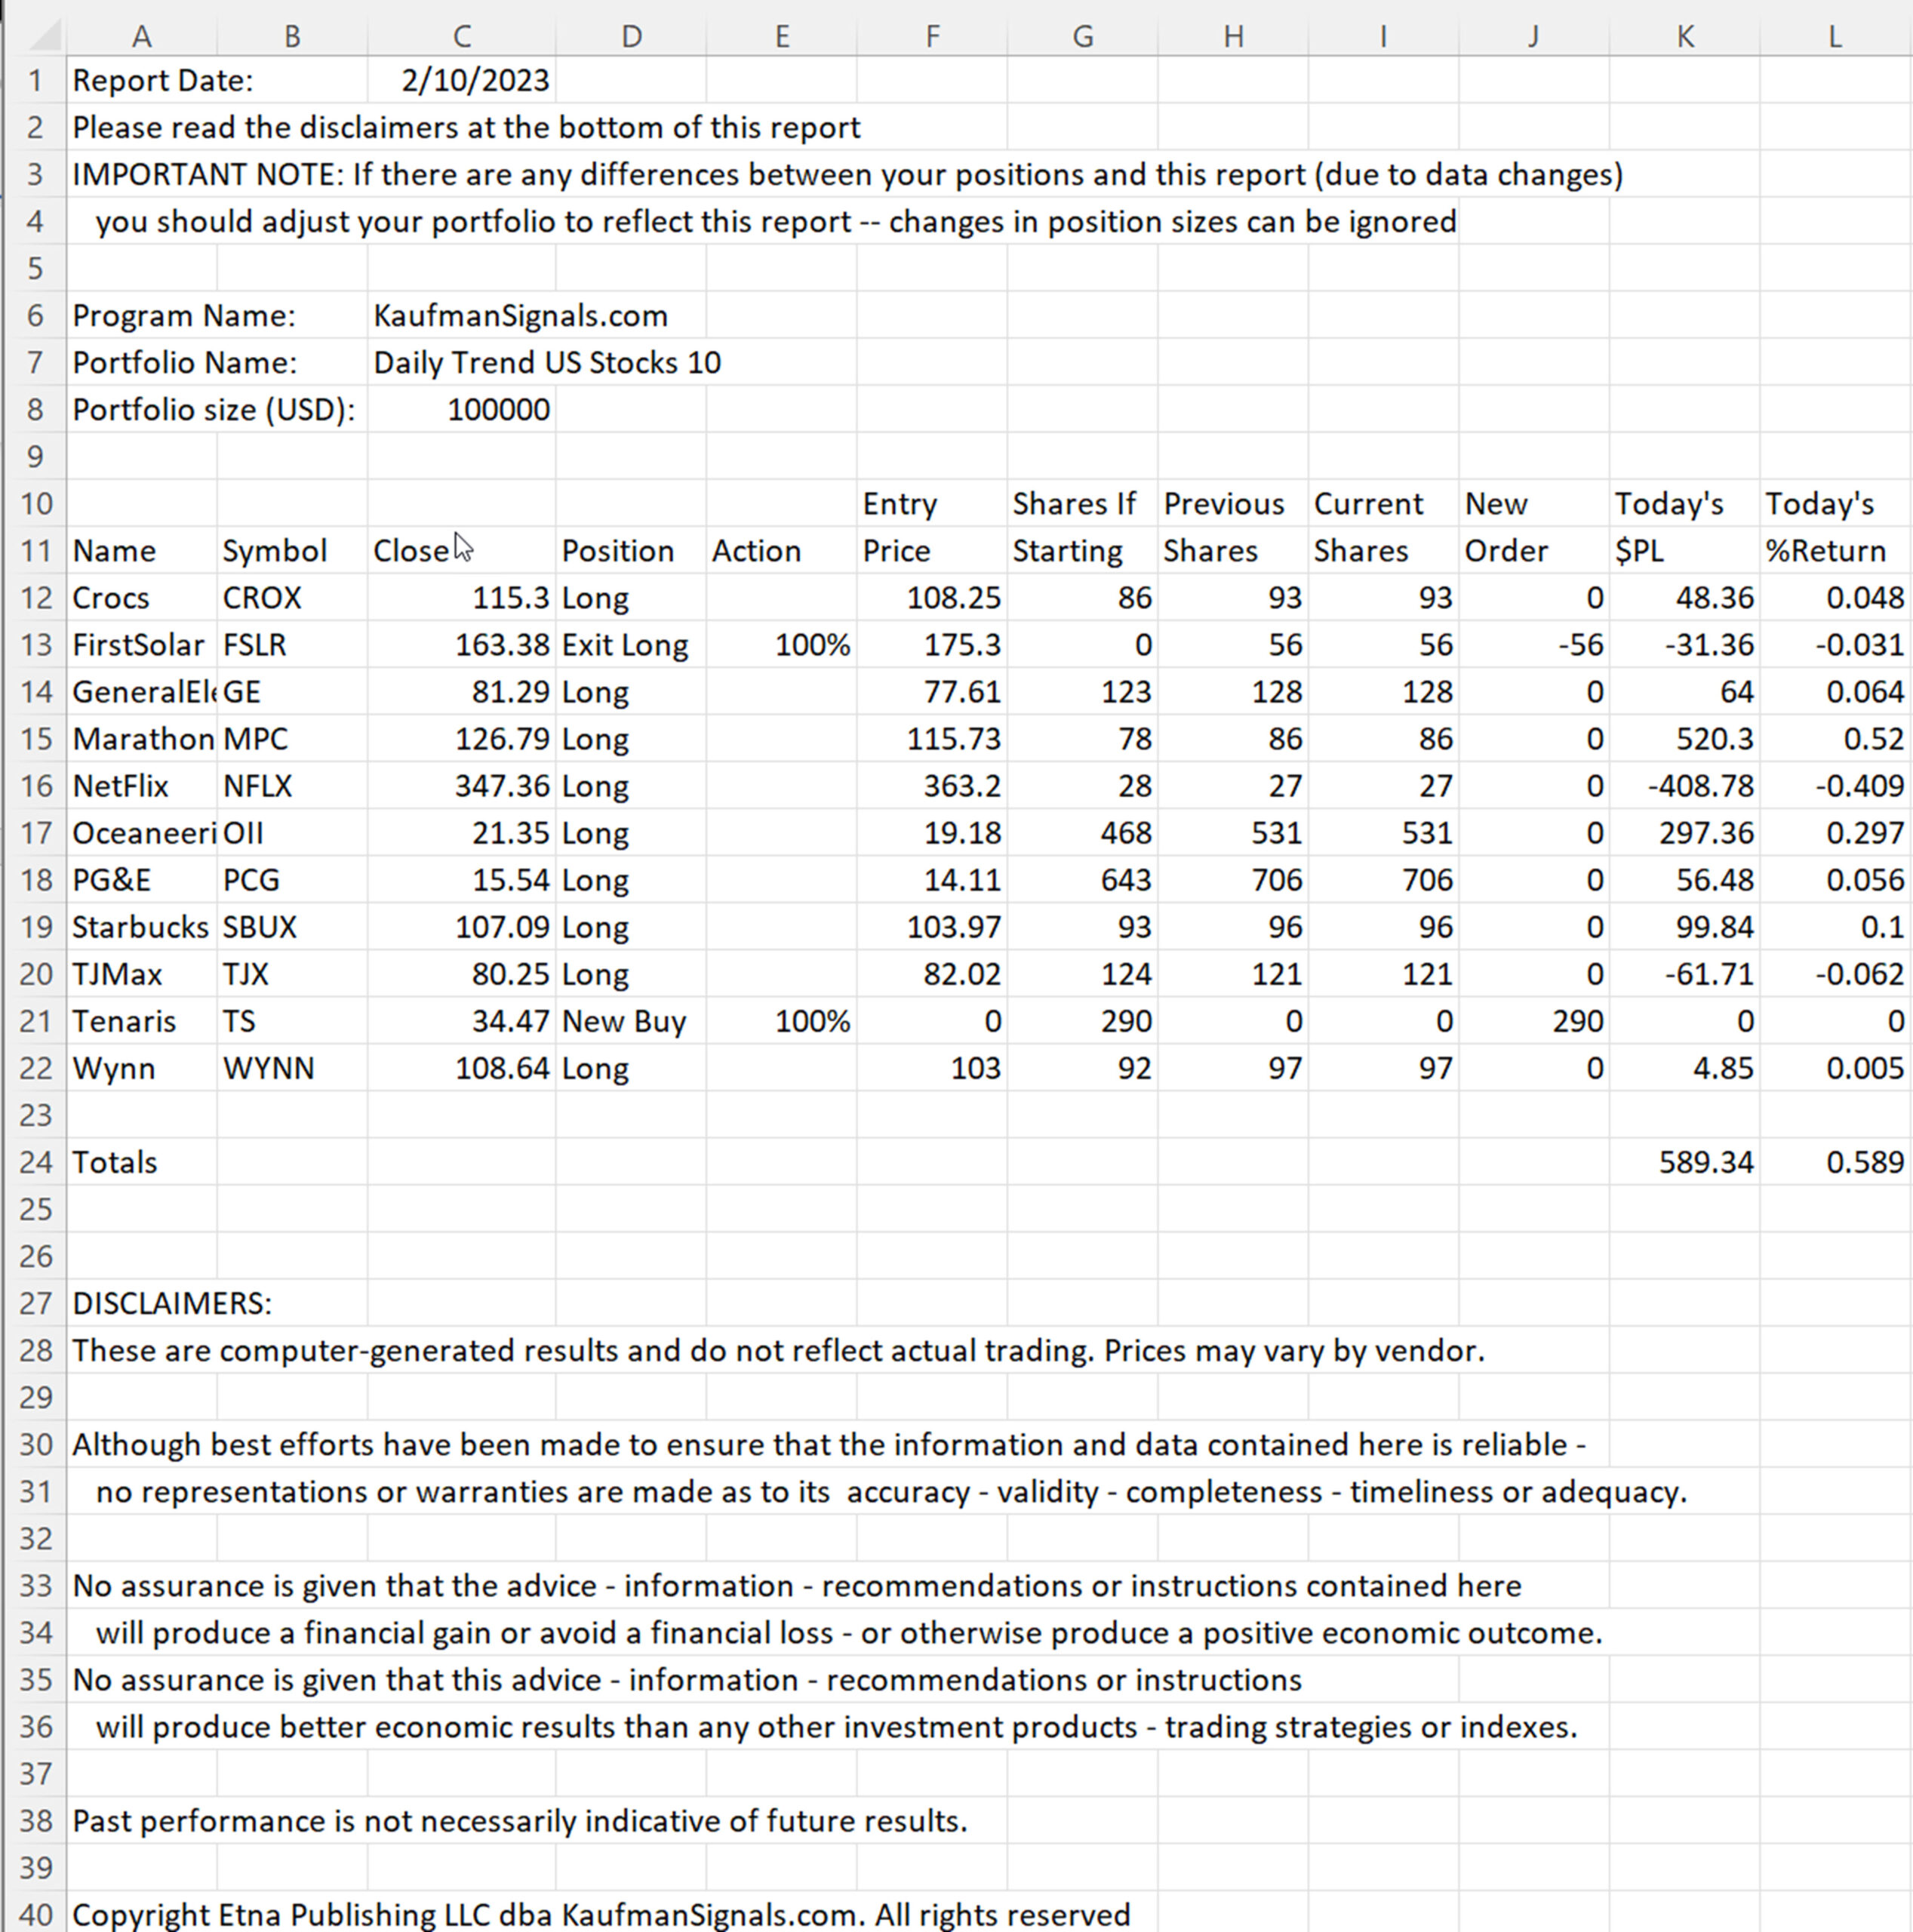
Chart 3. Daily Equity Trend Order sheet.
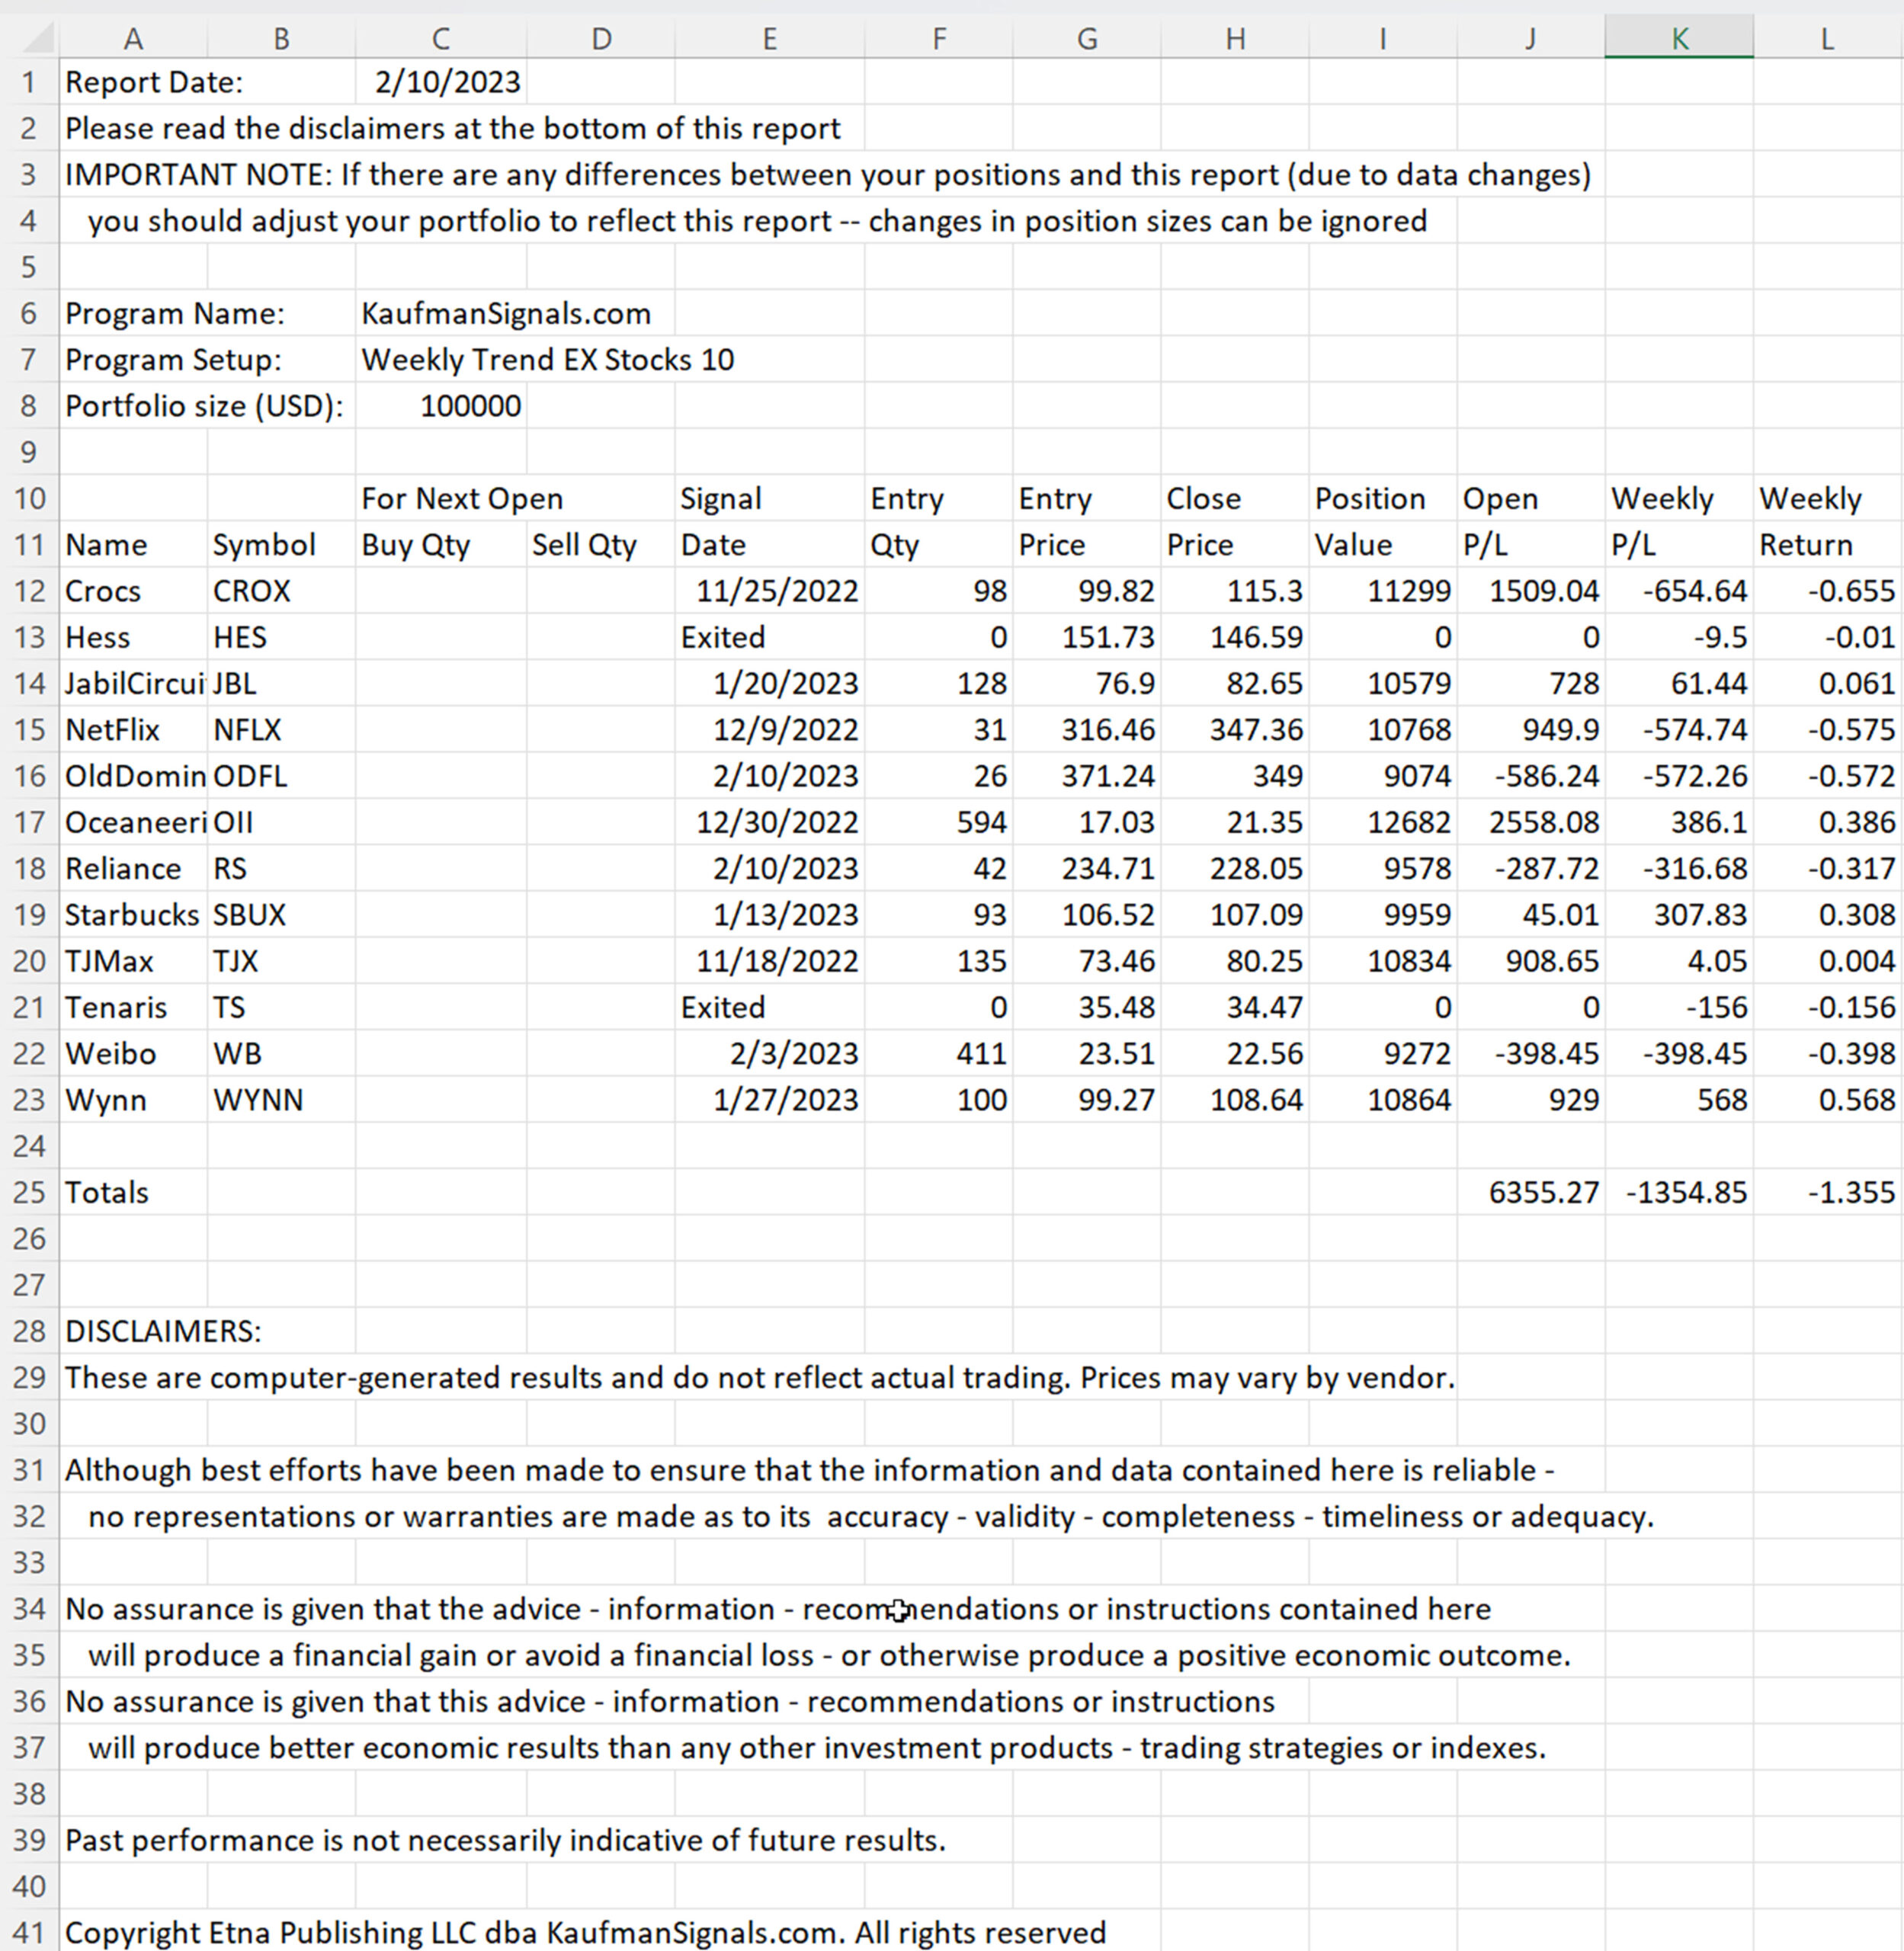
Chart 4. Weekly Equity Trend Order sheet.
The All Orders Report
There is an All Orders Report for the Daily and Weekly Equity Trend programs. It shows the current trading signals for all the markets tracked in that strategy. It can help if you are interested in trading additional stocks and want to know how our system sees the trend. A sample of the Daily All Orders Report is below.
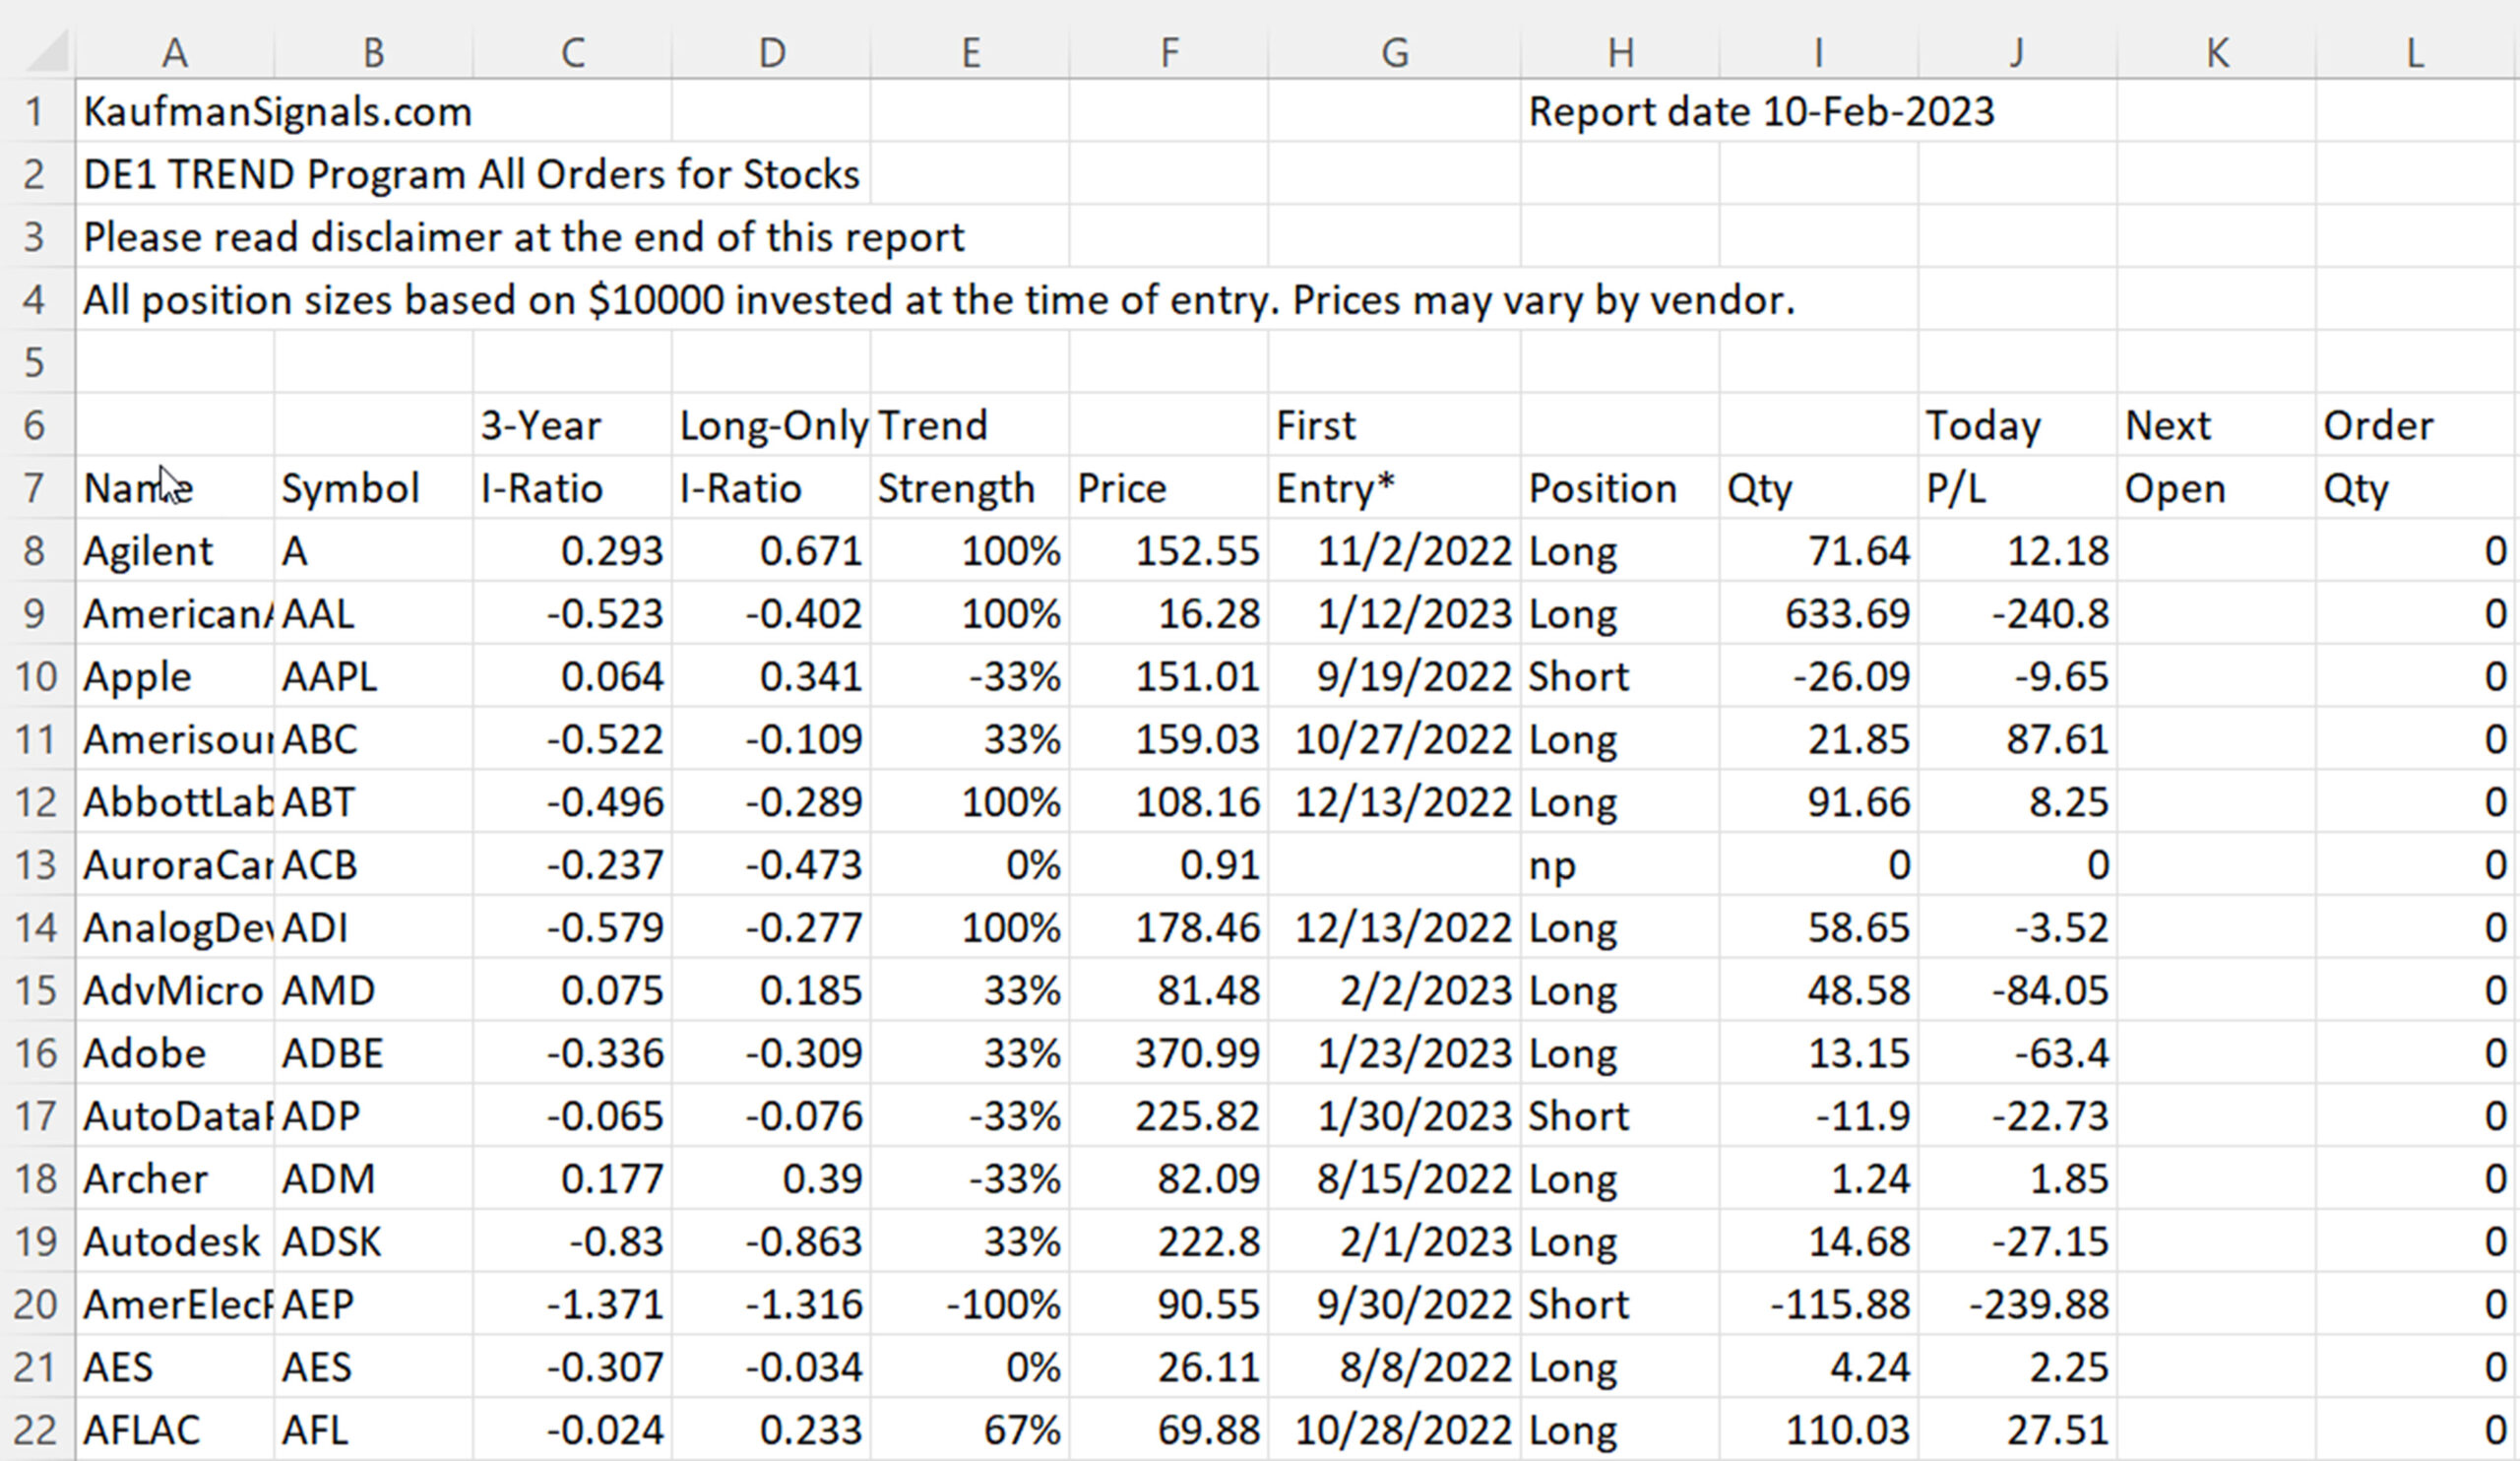
Chart 5. Sample of Daily Trend All Orders Report.
Stock Selection
The Equity Trend program uses the same stock selection process as our other portfolios. We rank how each stock has performed on our system each day over the past few months. The best 10 or 30 are then chosen for the portfolio.
It is not necessary for a trade to be completed for it to be removed from the portfolio. It just needs to fall out of the top 10 or 30 to be replaced by a stock performing better. That often avoids the “give-back” at the end of a trade. This method reduces the holding period in the portfolio for each stock from an average of 60 days to an average of 18 days. Its success is based on the persistence of stock moves.
Extreme Risk Exits for Both Daily and Weekly Programs
Individual stocks can exit on a downturn in the trend or be removed from the portfolio if they move lower in the ranking. There are also two risk controls based on volatility.
Individual stocks are exited and not entered if their annualized volatility exceeds 50%. They can be reentered once their volatility falls below 50%. The entire portfolio is closed-out if the portfolio volatility exceeds 32%, about the same level that the VIX indicator is considered high. At the same time, it must be posting losses. The portfolio will reenter if the volatility falls below 32% and trading shows profits. Both of these extreme risk controls have proved valuable.
The Daily and Weekly portfolios will both get a notice to exit all trades if the portfolio risk is exceeded. Even though the Weekly program gets Orders on Friday, it will get a notice to liquidate during the week. Waiting for the weekend could be too late. Both programs will get orders to reenter during the week as well.
Daily and Weekly Income Focus Programs
Interest rates have been the biggest source of returns for futures traders since 1980 and the basis of income for many investors. Certain ETFs are also of great interest to all equity investors because of their constant income from dividends which can offset downturns and add to the total returns. These stocks tend to have lower returns in exchange for smoother returns and lower risk.
In an article by Mr. Kaufman, “Uncovering the best tradeable bond fund,” published by Forbes in August 2016, the 15 most liquid interest rate ETFs were reviewed for the most likely to perform best based on consistency and returns. The conclusion was that high-yield bonds (JNK) and municipal bonds (MUB) were the clear choices, ranking best regardless of whether you applied medium or long-term trends.
The Method
Interest rate investment vehicles are normally priced in the same way as U.S. bonds and T-Bills. Prices declining means higher yields, and prices rising means lower yields. Since 1980, yields have mostly declined. Only recently, since 2022, have we seen rates rise to stifle inflation. System trading of these interest rates has been profitable only if traded long, expecting lower yields. Periods of rising rates tend to be short-lived and fight with traders, who always seem to believe that rates should be coming down.
We took JNK and MUB and added preferred stocks (PFF), boosting long-term returns and adding some risk but still keeping the risk well below most normal investments. We then track the trends of these three markets and allocate the investment equally when two or three are trending up or placing all the funds in one ETF if that is the only one trending higher.
If none of the interest rate ETFs are moving up, we leave all funds in the money market, the cash 3-month T-Bills. As of 2022, yields have increased, and this program has been out of the market most of the time. It has gotten long from time to time and has taken a small loss. At some point in the not-too-distant future, yields will decline steadily, and the Income Focus program will again generate steady profits.
The Results
The chart below shows the Net Asset Value of the Income Focus Program from October 2007, when these ETFs became available for trading. Note that the drawdown in 2008, caused by the financial crisis, was only 17%, far smaller than the 50% seen by the major index markets, ivory tower Endowment managers, and many other investors. Since 2022, rates have been rising quickly, and the program has been mostly out of the market.
The performance table shown at the top of this note shows the results of both the daily and weekly Income Focus portfolios. The chart below shows the NAVs of both portfolios. The Daily portfolio has performed better because it can change positions mid-week if needed.
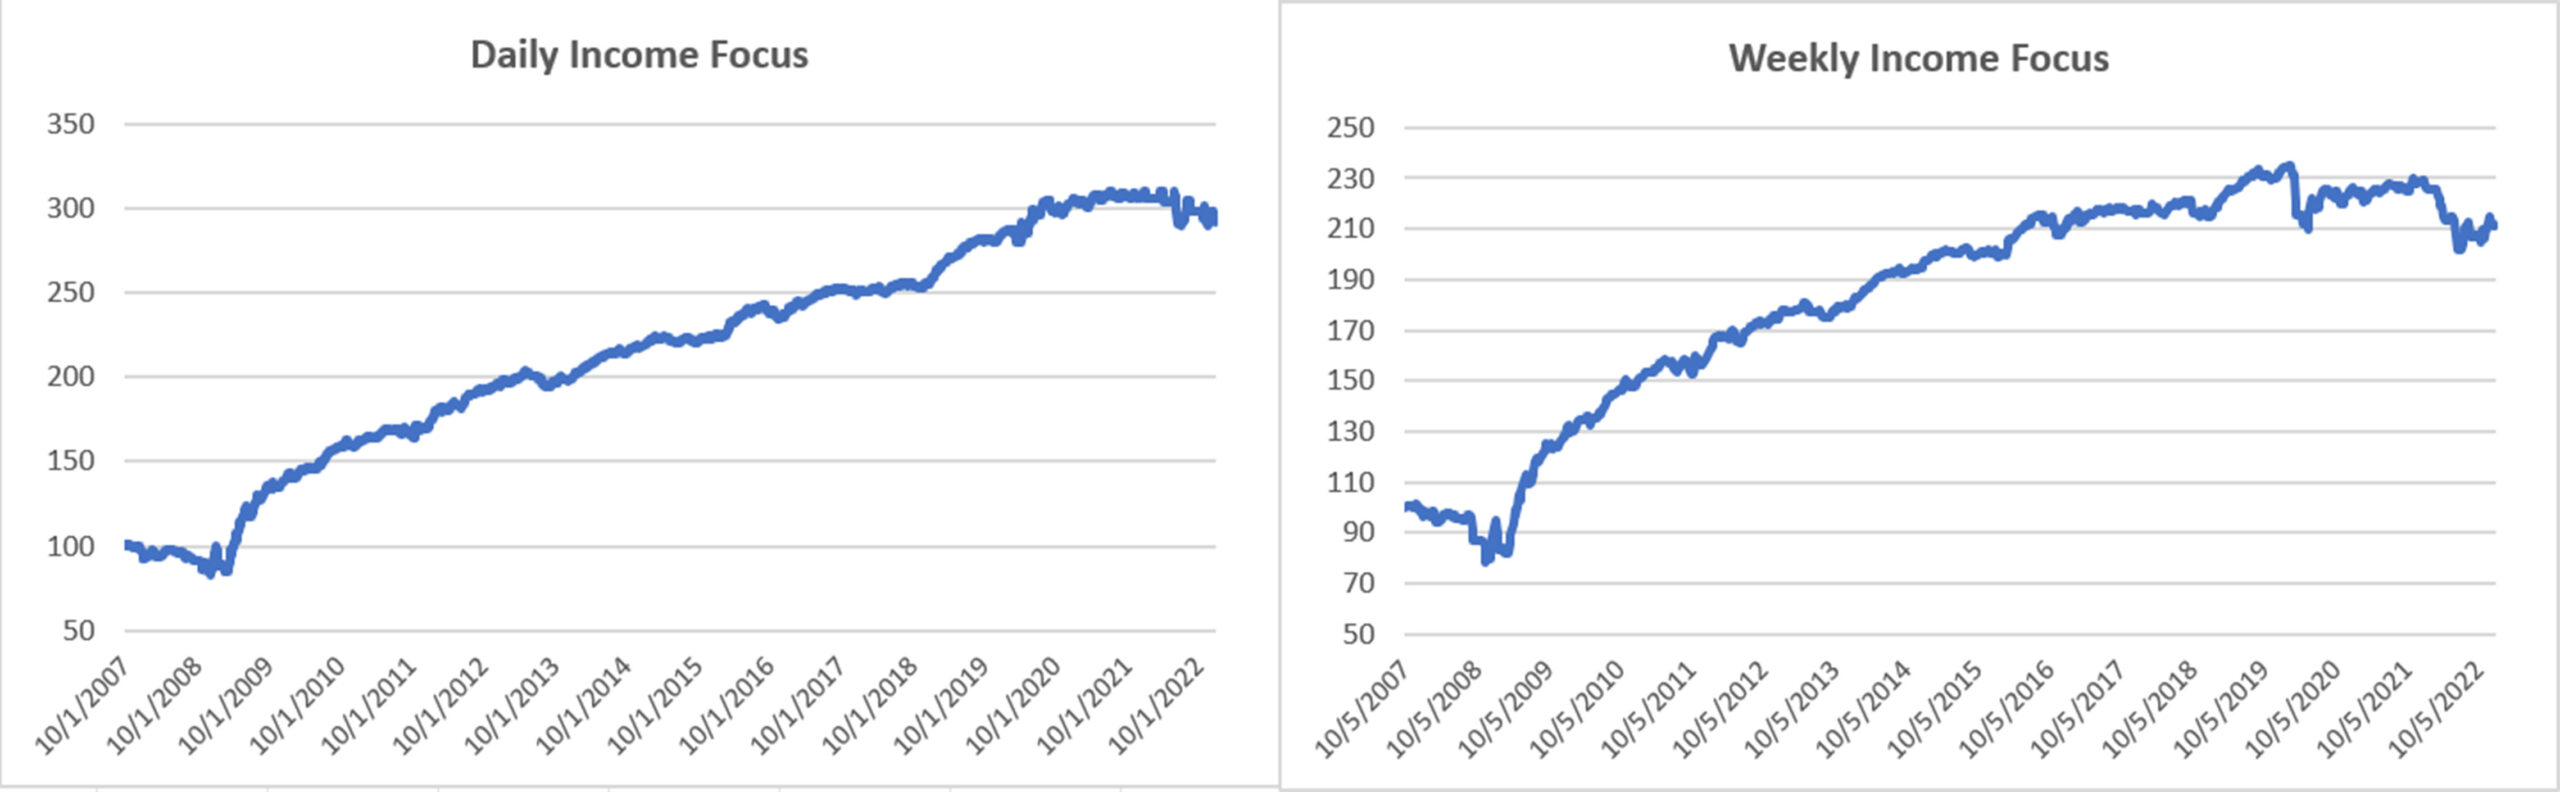
Chart 6. Daily and Weekly Income Focus returns.
For the period of nearly ten years, this program showed an annualized rate of return of 10.1% with an annualized risk of 7.4%, giving an information ratio of 1.37. These results are net of $8 per trade cost. The information ratio is a measure of reward to risk and can be seen as representing the smoothness of returns. In contrast, the S&P has a ratio of about 0.30, indicating that you need to take $1 of risk to gain $0.30 of return.
We believe this program satisfies the needs of many investors looking for decent returns but much lower risk. It is available as part of the Daily Equity Trend Program with a target investment of $30,000 ($10,000 per ETF) but can easily be scaled to any investor’s needs.
Weekly Sector Rotation Program
A new version of this program, introduced in February 2023, is a variation of classic sector rotation, a strategy that has been successful for decades. Normally rebalanced only monthly, we have made this more responsive by changing to weekly and adding a volatility exit when needed.
The program is based on “persistence,” the tendency for a price to continue in the direction it was going. We pick the 3 best ETFs from the 10 most liquid sector SPRDs and allocate 1/3 of the investment to each. These are reevaluated each week. The total investment is $30,000. Below is a chart of the simulated NAVs through January 2023.
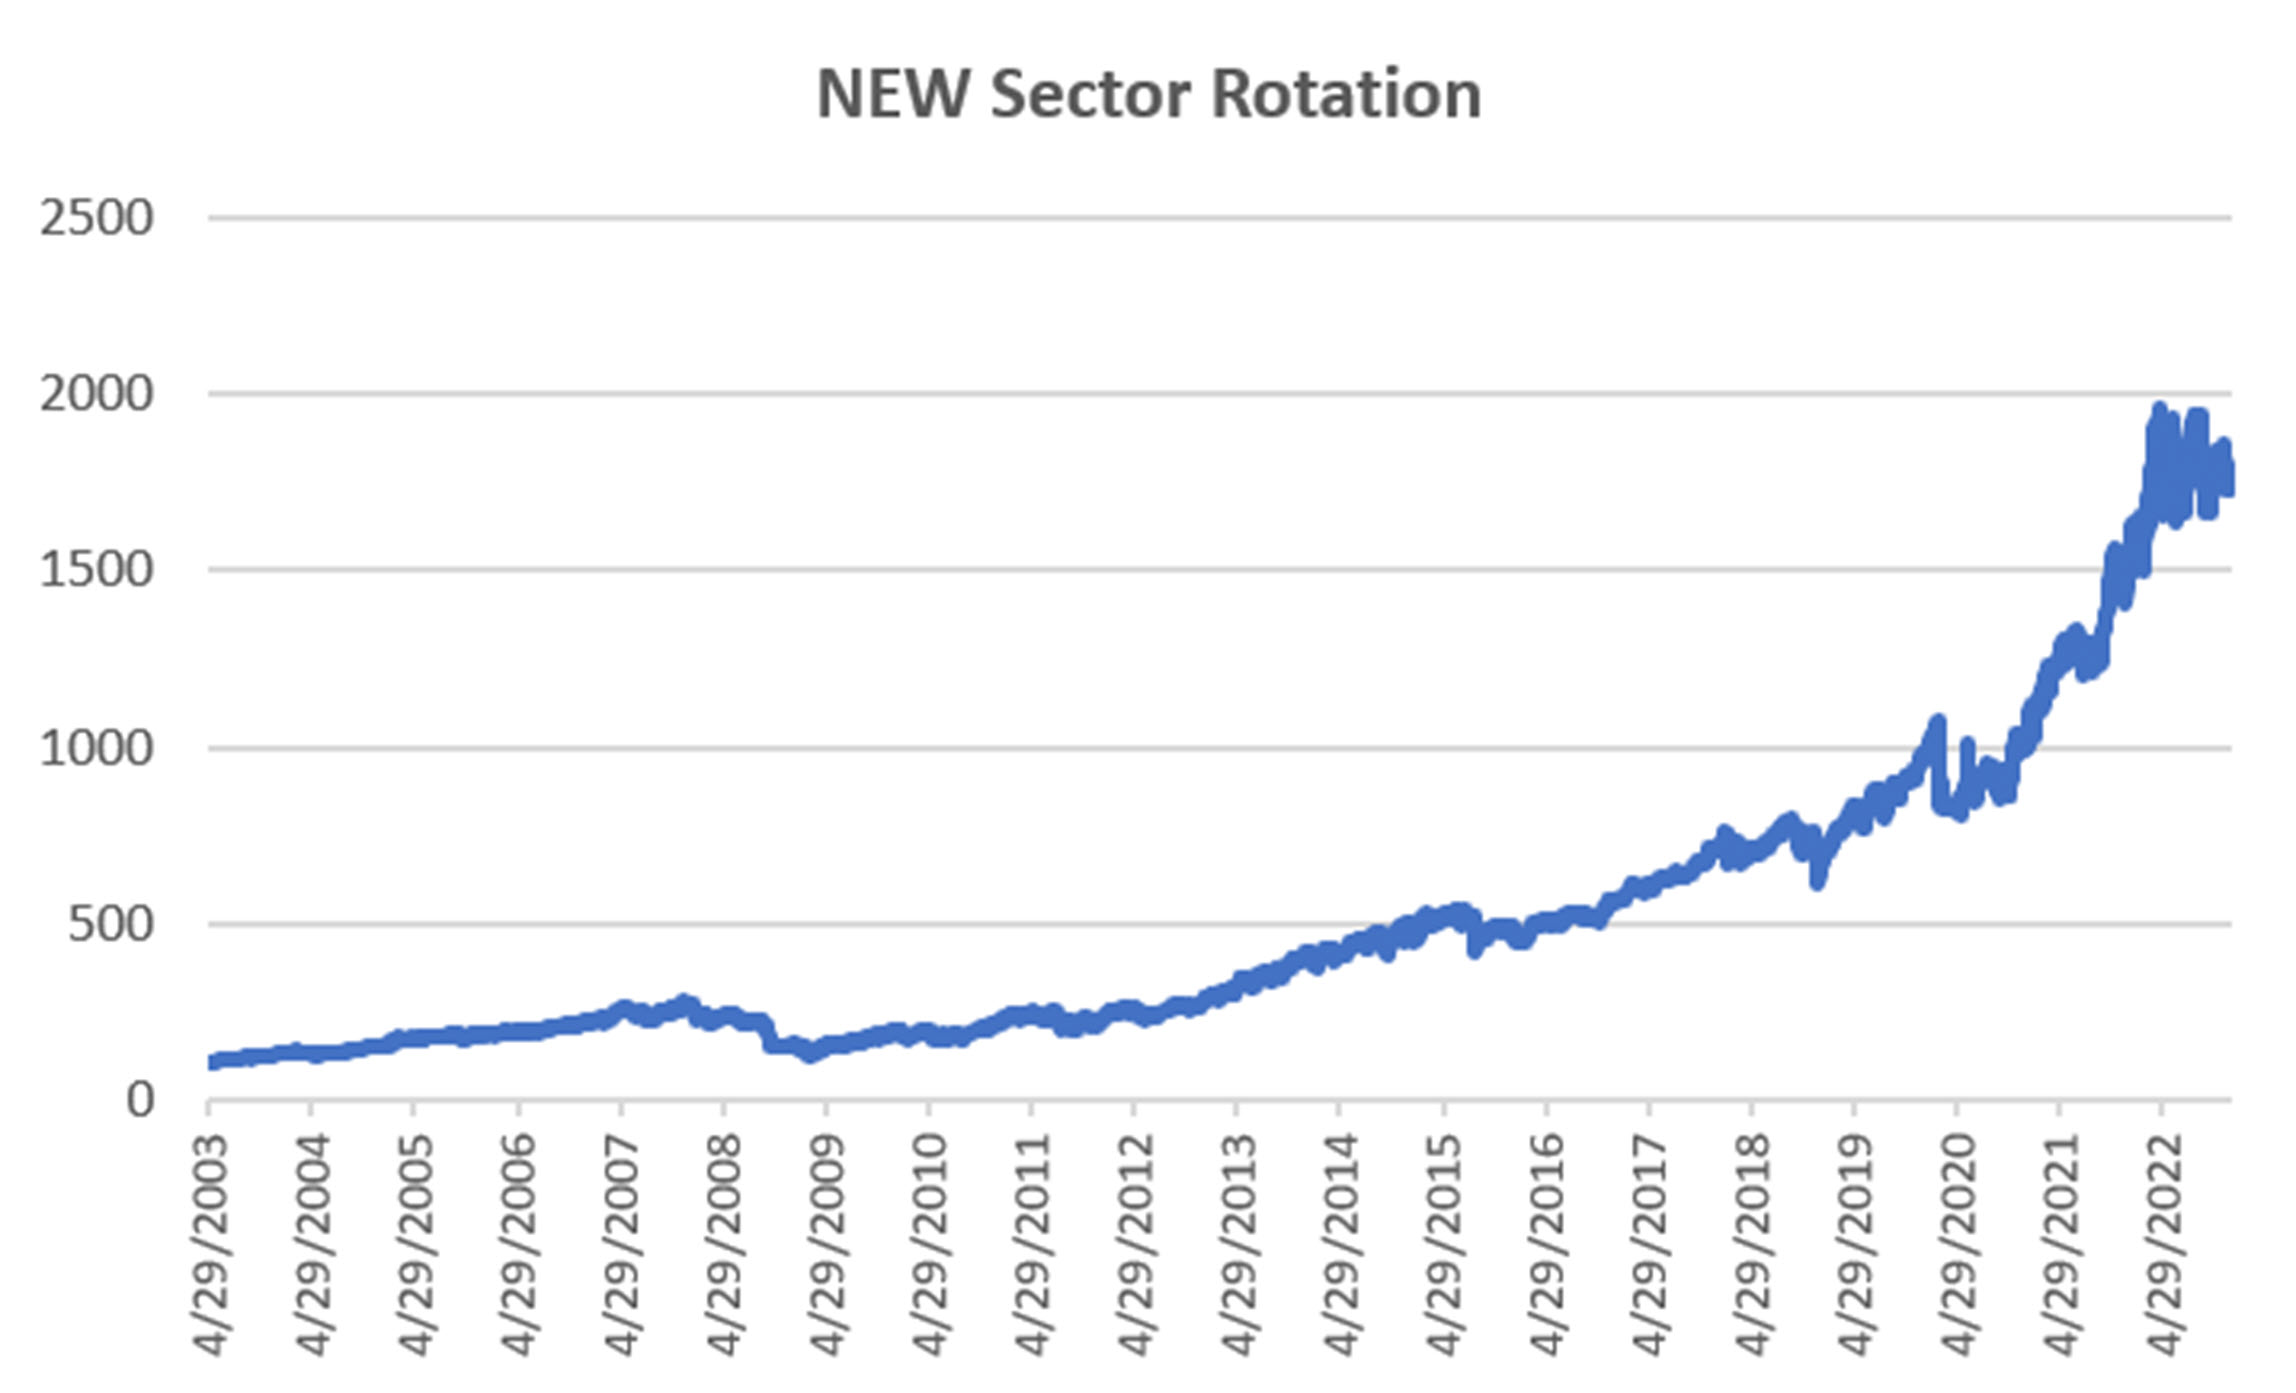
Chart 7. Weekly Sector Rotation NAVs through January 2023.
TRADING FUTURES MARKETS
Futures markets offer many advantages over stocks:
- Greater diversification
- Ability to leverage up and down
- Lower relative commission costs
- Less counterparty risk; that is, a futures market is not likely to be suspended and always has intrinsic value.
But they have disadvantages:
- They require a larger investment
- Leverage, if not properly managed, can lead to larger equity swings
- They are not a guaranteed hedge against a declining stock market
Because the performance of futures can be uncorrelated to stocks, it has been misinterpreted as making money when the stock market is declining. Not so. Uncorrelated means the performance of the two is unrelated. They can profit on the same day or lose on the same day. However, there is only a 25% chance they will lose on the same day, and the percentage loss may be very different. To perform oppositely is negatively correlated, a much more unusual situation.
There have been occasions when future profits have offset stock losses. Notably in 2008 and again in 2022. Because of that, the use of futures has been named “Crisis Alpha.” It works because it is easy to go short futures with high leverage and no additional “short sale” costs. In both 2008 and 2022, a relatively small investment in index futures could have returned 50%.
Futures Portfolios
Futures offer true diversification, spanning a wide range of financial and commodity products. Traditionally, Commodity Trading Advisors and Hedge Fund Managers have used portfolios with fixed allocations; markets have been pre-assigned a specific allocation. For example, the 10-year Note may use 3% of the investment; the Emini-S&P assigned 5%, and so on. These allocations were based on a long-term history of performance. While this worked for many years, it has not done well in the recent past. It obligates the program to trade underperforming markets.
KaufmanSignals has developed a new, dynamic way to choose markets to be added and removed from the portfolios. You can find an explanation in the book, “Kaufman Constructs Trading Systems.” Essentially, we use multiple criteria to rank the markets, then choose the best from each sector. This means we can avoid trading markets that are not performing well for that program. If not enough markets qualify in that sector, we trade fewer markets.
We also try to find markets across three sectors, which we consider sufficient diversification. If that is not possible, we deleverage the portfolio because poor diversification means higher risk.
Performance of the Portfolios
There are four portfolios for the Futures Trend program: $250,000 with only U.S. markets, $250,000 with U.S. and European markets, $500,000 and $1 million portfolios with all markets. The table of returns goes back 31 years, of which the past 12 years have been live ad tracked daily by KaufmanSignals. Before that, a similar concept was used by Mr. Kaufman for trading by several major investment houses. In 2008, we added dynamic market selection and extreme risk controls. Performance has always been consistently good but outstanding in 2022.
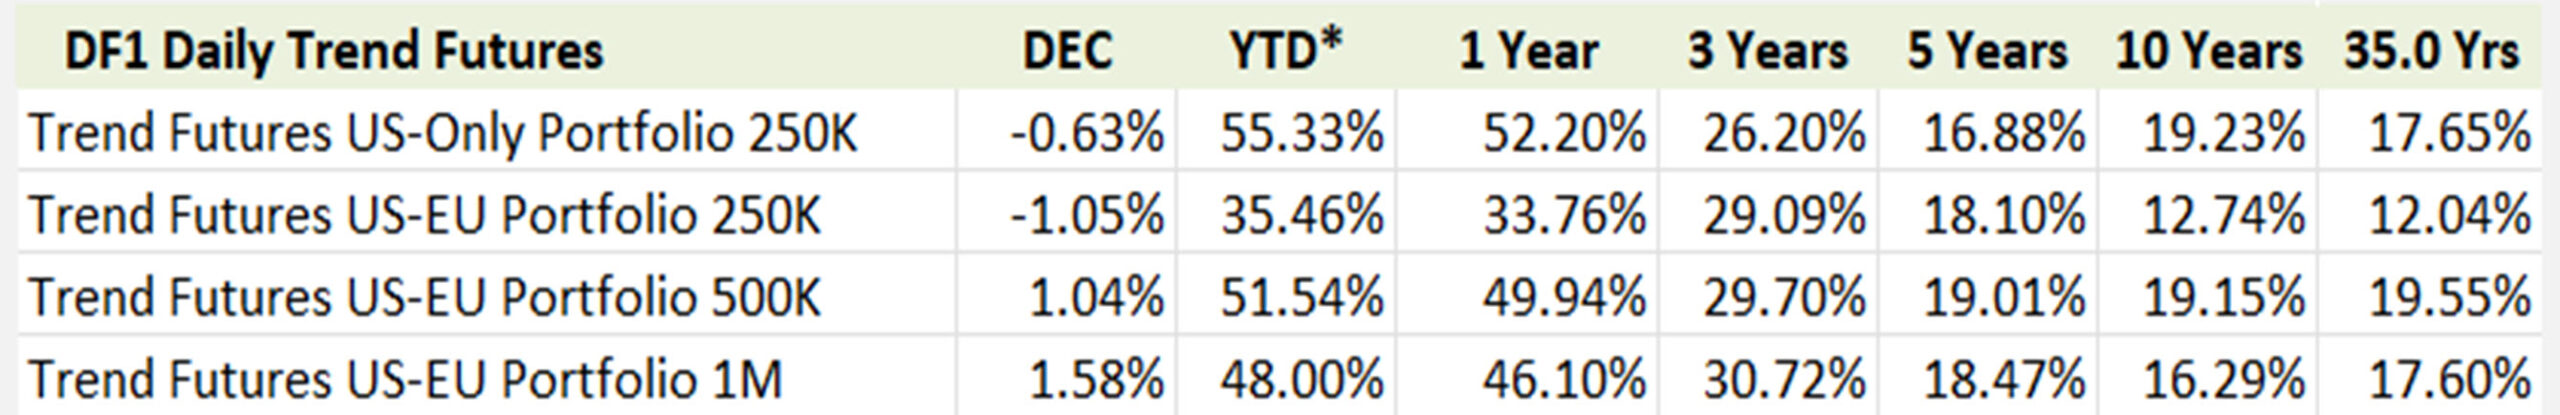
Futures Trend performance tracking through 2022.
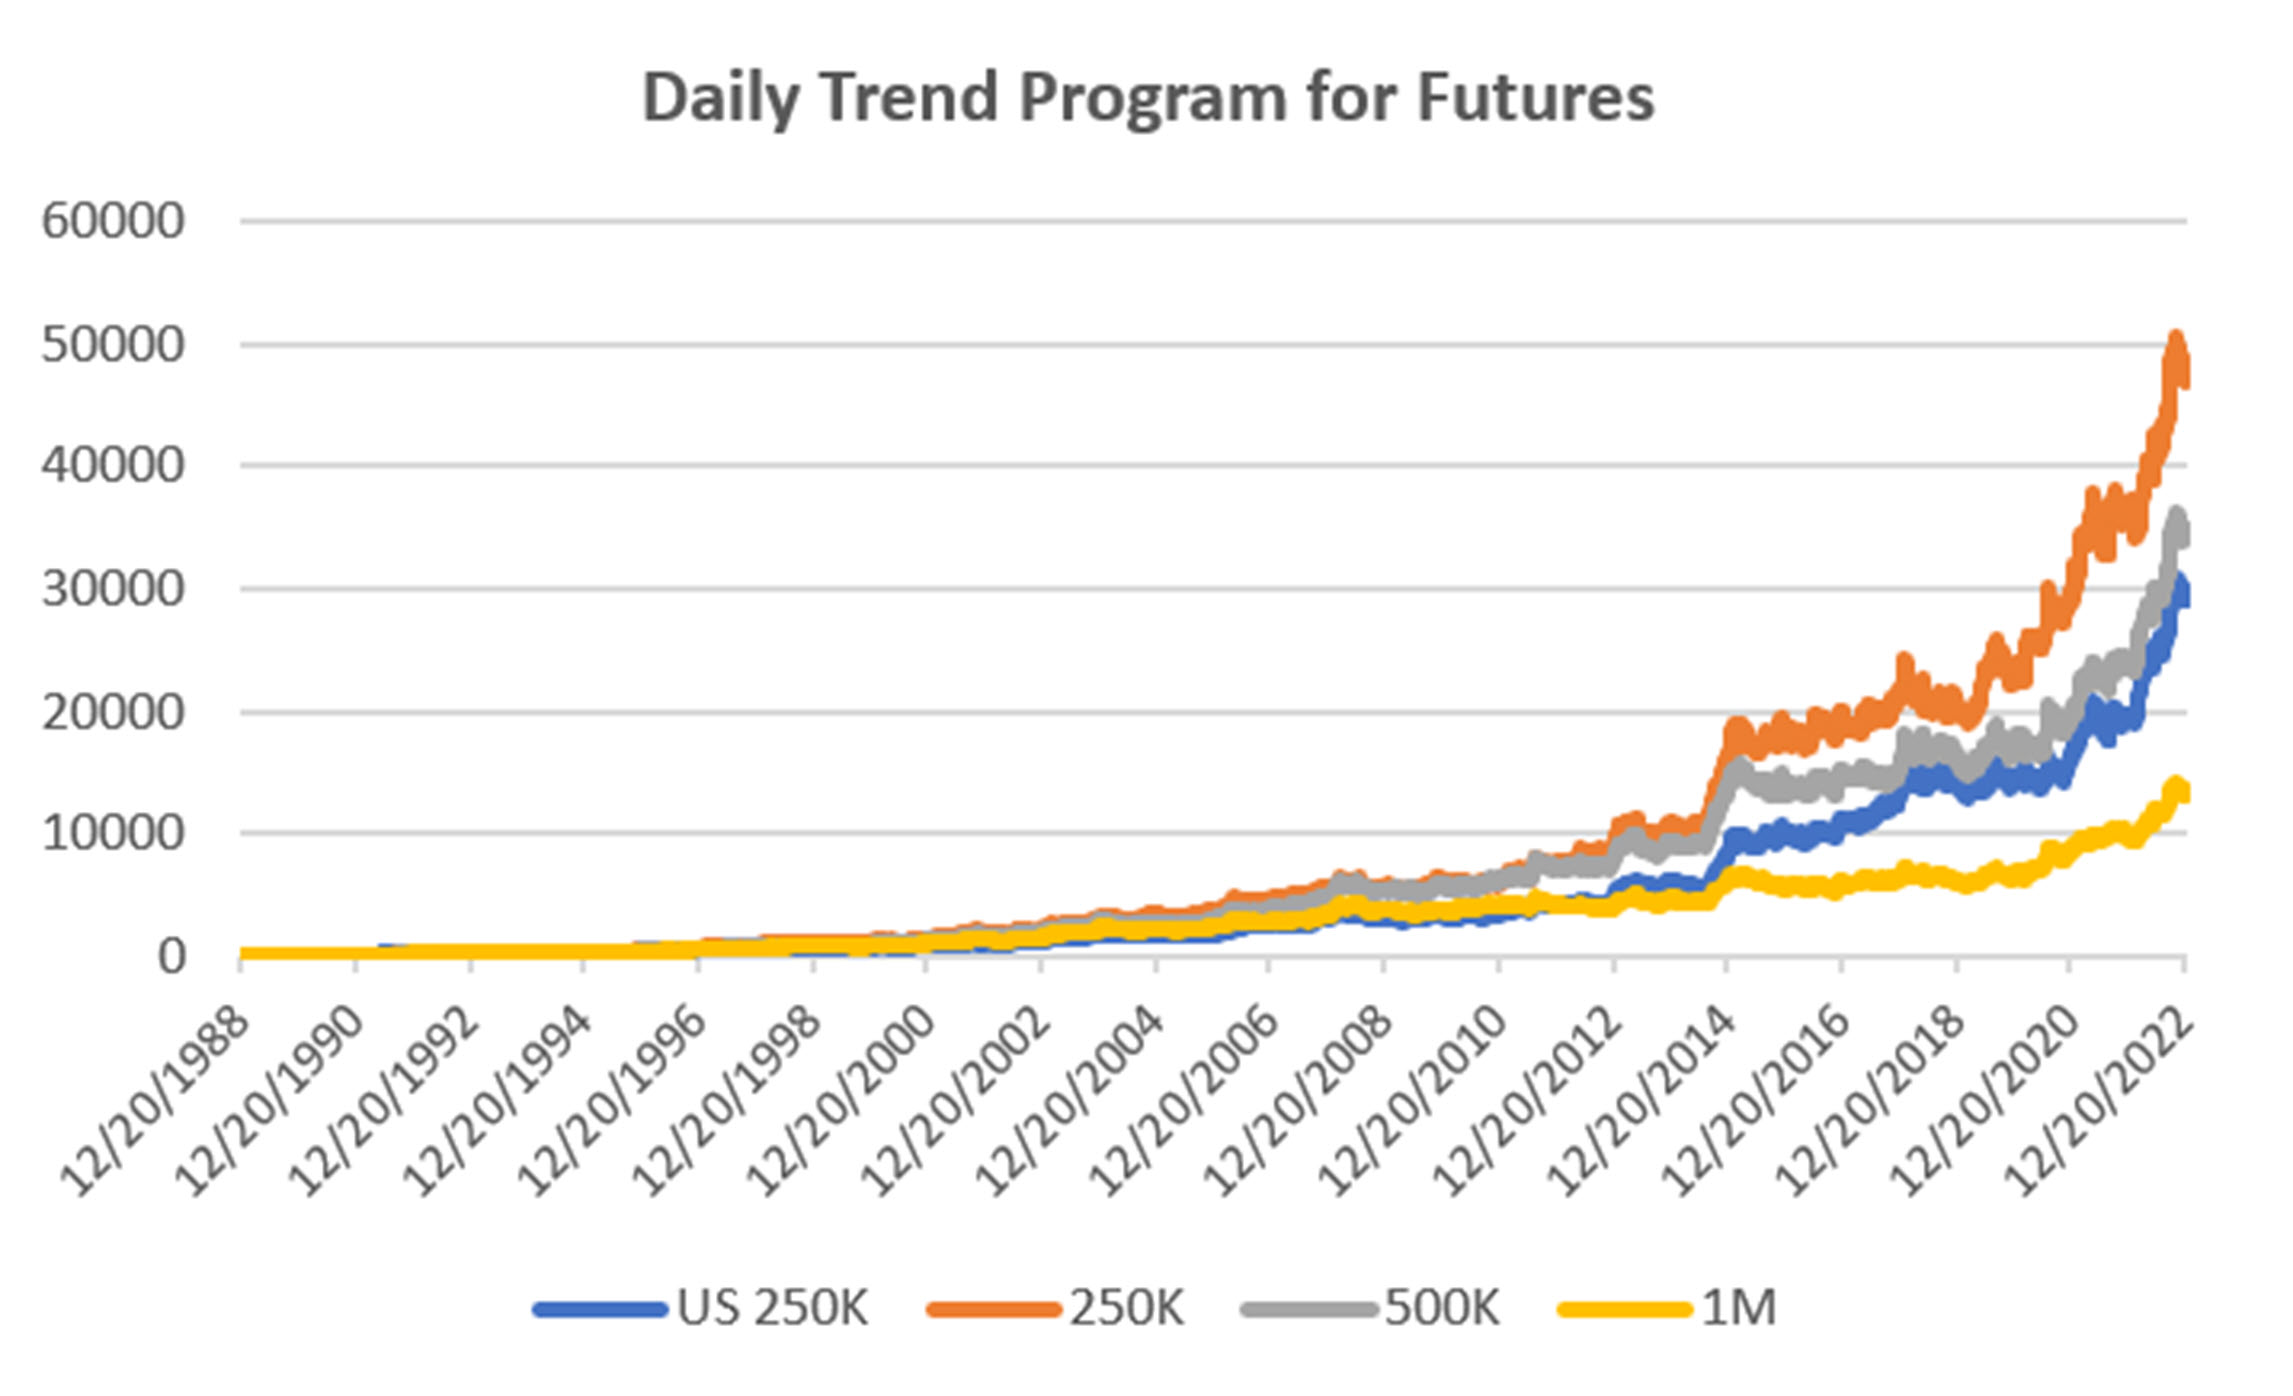
Chart 8. Futures Trend Portfolio NAVs through 2022.
Position Sizing and Daily Orders
Futures positions are sized using volatility parity. Starting with a nominal market allocation, say $25,000, we divide that allocation by the average true range (ATR) of prices times the futures market conversion factor (the value of a one-point move). The markets in each sector are then normalized to our target volatility of 14% by scaling up or down their position size. Once all sectors have equal risk, they can be allocated to the portfolio. With all the sectors at the same risk level, we can now adjust the entire portfolio to our target volatility. This is also done by scaling the position size up or down.
Equal risk at all levels is important because it maximizes diversification at the same time; it controls risk (when it is too high) and improves returns (when it is too low).
In the Order sheet below, the $500K account, the Action column indicates that we need to increase our exposure in Eurodollars and reenter our long copper position. Notice that the size of the positions reflects the volatility of the market.
On the far right is a suggested execution time, close to what used to be the official open of the market. To be clear, our system posts entries and exits at the close of trading. We cannot trade the open, which occurs about 30 minutes after the close. Our experience tells us that “sooner is better,” so we show the time you could enter in the morning. It is your choice.
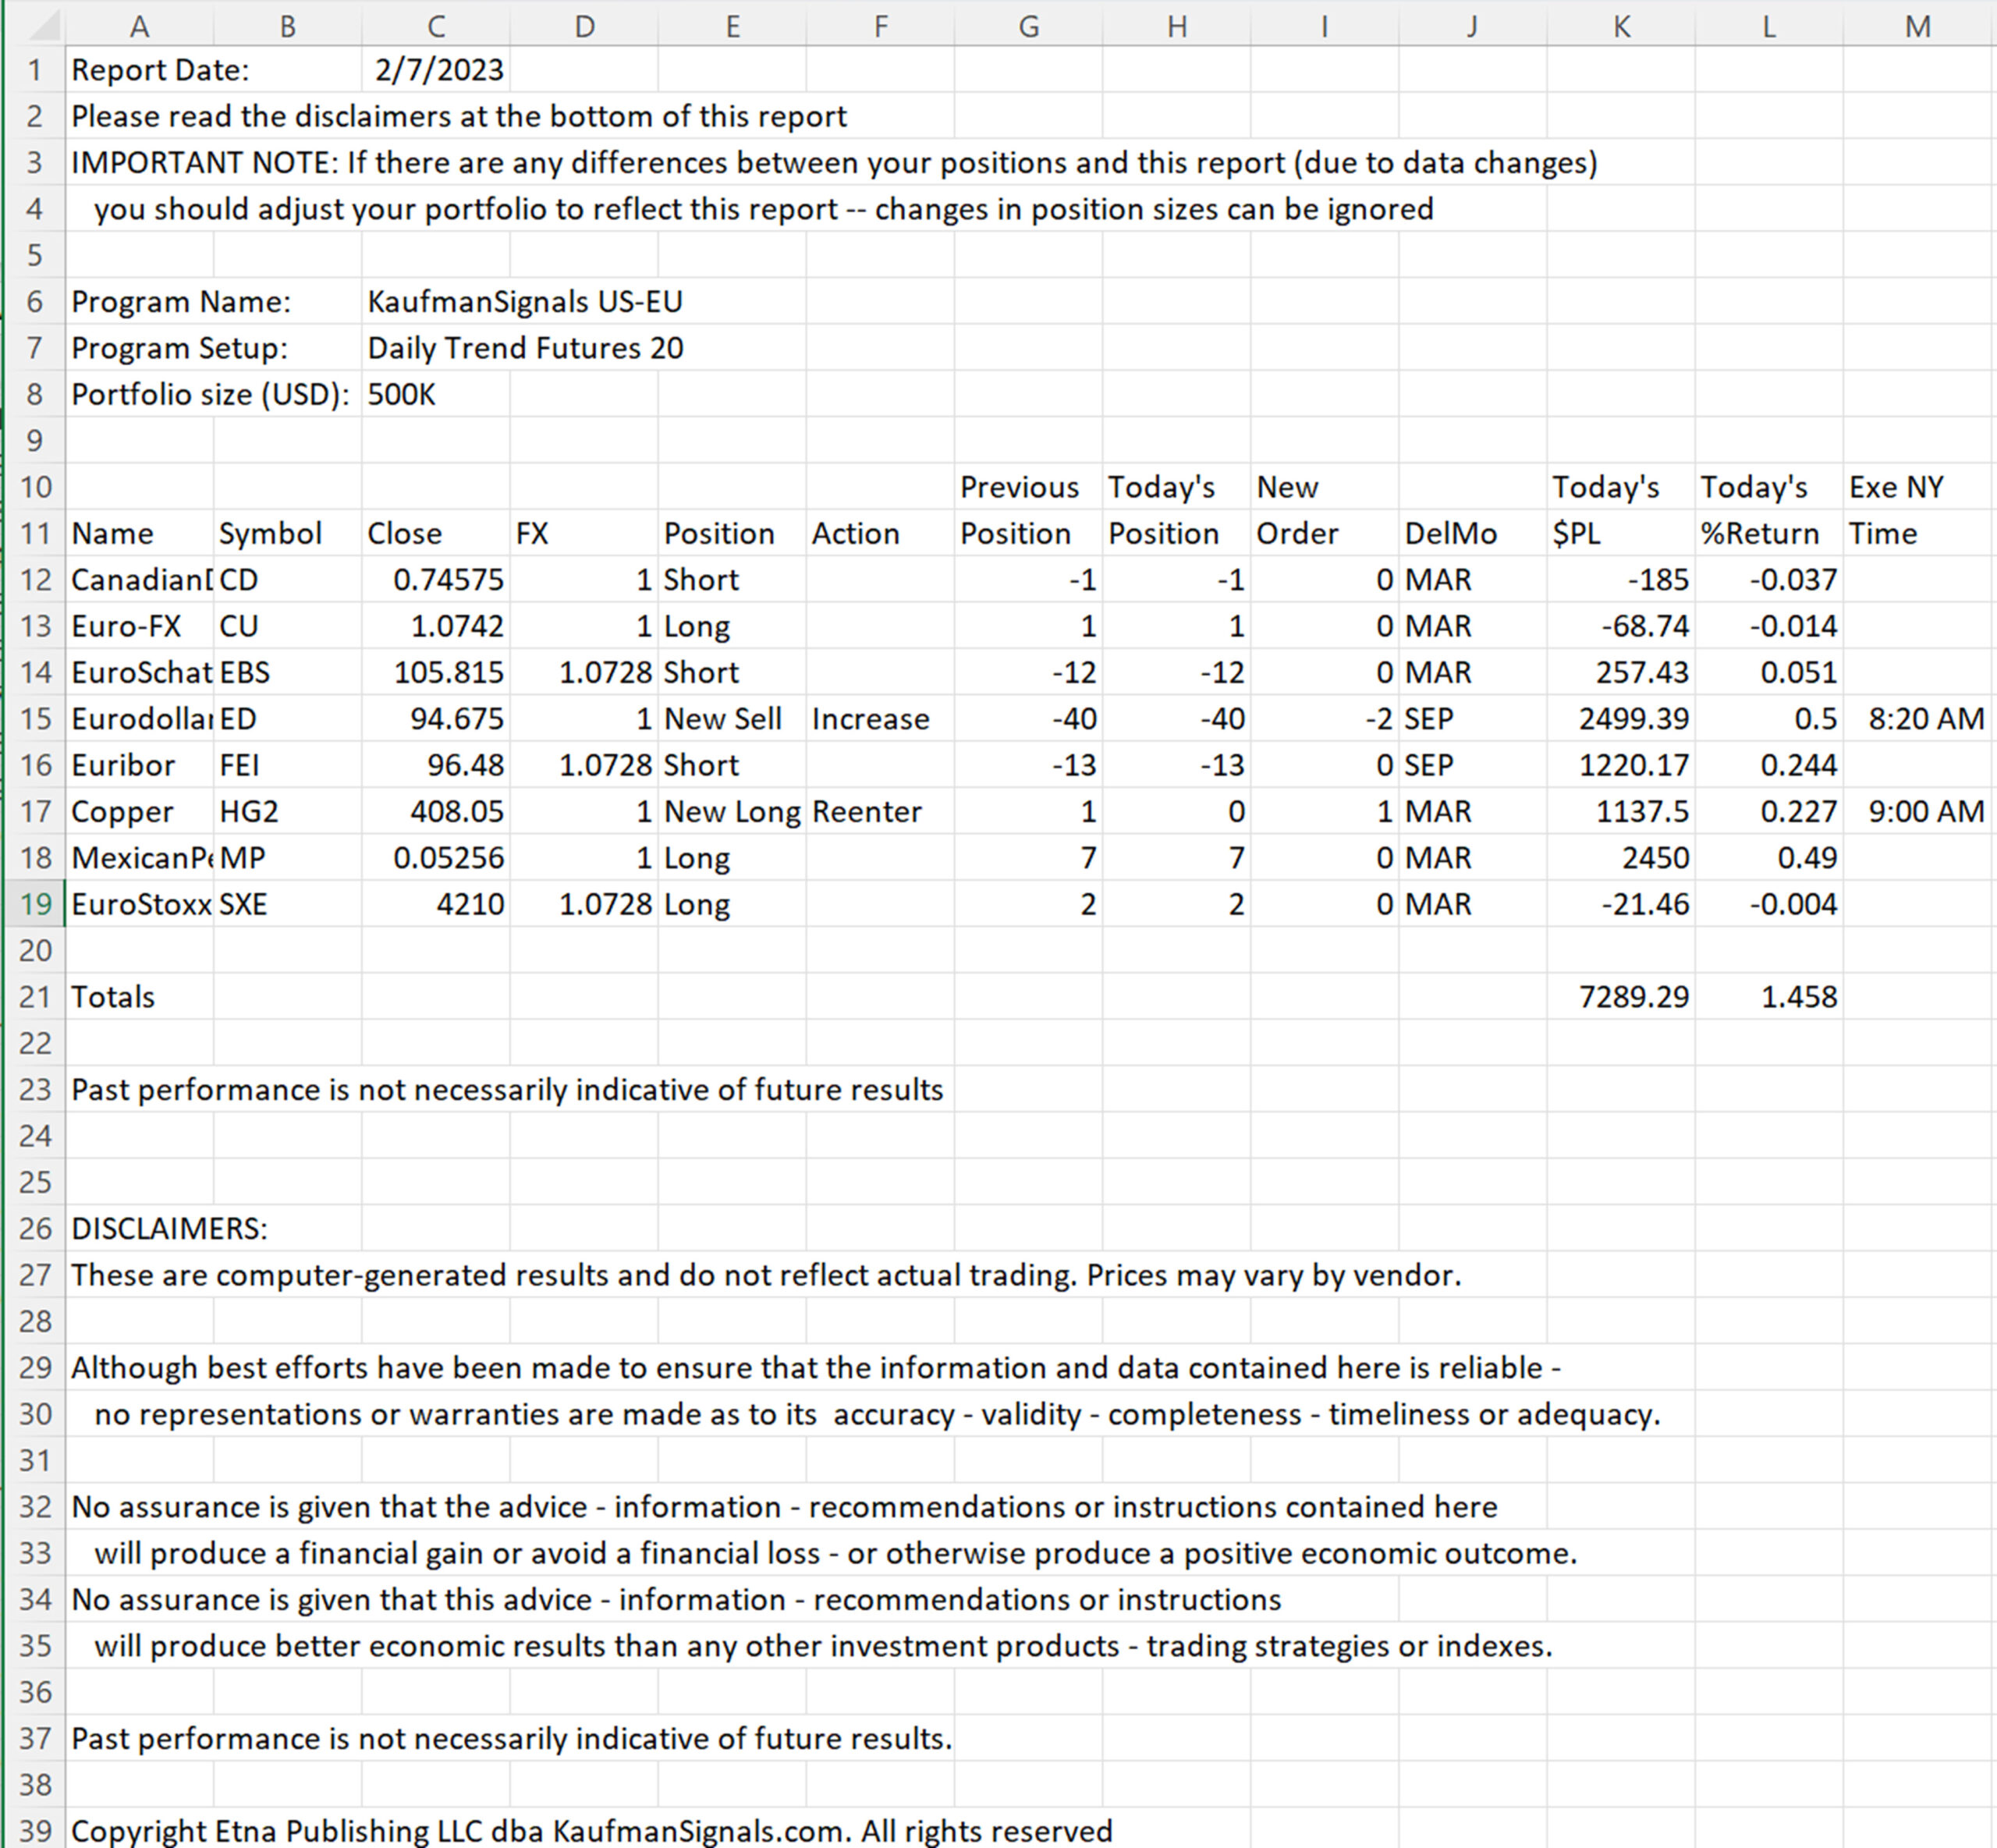
Chart 9. Sample Daily Futures Trend Order sheet.
The All Orders Report
As with all our programs, a report shows the trading signals in every market. For futures, the markets are arranged by sector and grouped in what we hope is a logical order. A sample of the report is shown below. Note that each market has a suggested execution time for traders who want to enter the market sooner than the close.

Chart 10. Futures Trend program All Orders report.
Become a Paid Subscriber and receive trading signals from KaufmanSignals.com every morning before the opening bell.