

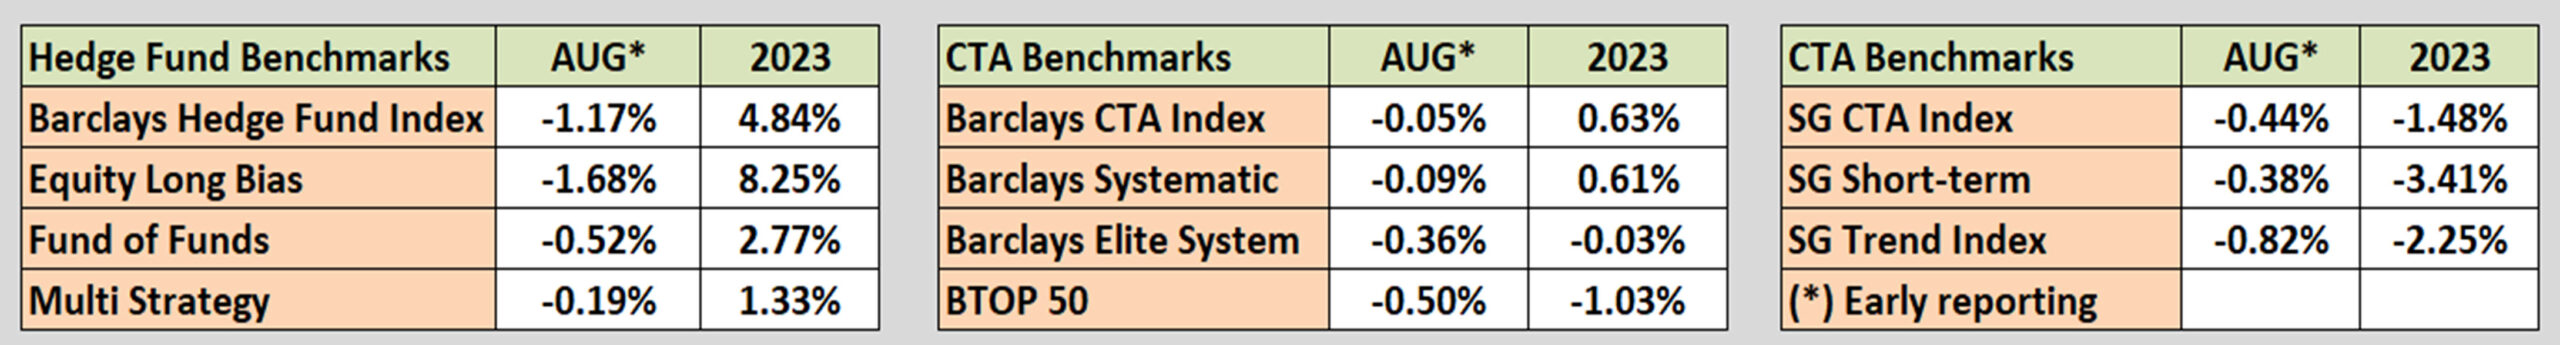
Industry Benchmark Performance
Another month of “wait-and-see” if the Fed is done raising rates. The first 2/3 of the month saw performance decline and the last 1/3 saw it rise, just not enough to offset the earlier losses. However, the market remains optimistic.
Hedge funds held onto profits after taking small losses for August. CTA performance was very subdued although we would expect that there was some volatility during August. Overall, CTA are flat to down slightly for the year.
Kaufman’sMost Popular Books (available on Amazon)
Trading Systems and Methods, 6th Edition. The complete guide to trading systems, with more than 250 programs and spreadsheets. The most important book for a system developer.
Kaufman Constructs Trading Systems. A step-by-step manual on how to develop, test, and trade an algorithmic system.
Learn To Trade. Written for both serious beginners and practiced traders, this book includes chart formations, trends, indicators, trading rules, risk, and portfolio management. You can find it in color on Amazon.
You can also find these books on our website, www.kaufmansignals.com.
Blogs and Recent Publications
Find Mr. Kaufman’s other recent publications and seminars at the end of this report. We post new interviews, seminars, and reference new articles by Mr. Kaufman each month.
August Performance in Brief
Much the same as the hedge funds and overall markets, our programs mostly netted losses in August. Performance in equities followed the same pattern as the hedge funds, lower for the first 2/3 of the month, then rallying in the last 1/3, but not enough to recover all of the losses. Only futures showed small gains. Still, most of our programs are positive for the year and the last quarter tends to be good for stocks.
Major Equity ETFs
August posted modest losses in all the major equity ETFs but held on to good gains in the S&P and NASDAQ. The chart below shows the decline during the first 2/3 of August, followed by a rally. If the Fed pauses rate hikes at their next meeting, we should see new highs in these index markets.

CLOSE-UP: Where is the Trend?
In my experience, most trading is improved by knowing the direction of the trend. Equity markets favor an upwards trend while only a few (mostly VIX, perhaps cryptos) favor a declining trend or no trend. We can use the trend directly to trade or we can use it as a filter for nearly any strategy and expect better results.
2023 has not been an easy year for traders. Would it be improved by knowing the trend of the market you are trading? We can only look backwards to see which trends would have resulted in profits, but that can teach us a lot.
Over the long term, we know that trend following is a successful strategy. But do the trends that worked for the past 20 years still work? Given that macrotrend traders have been struggling this year, I want to see what happened to those profitable trends which we all counted on. Then we want to know what trends work now, and for what markets.
Selecting the Markets
I’ve picked what I think are the most popular and/or likely markets to profit since 2022. They are the S&P (SPY), Nasdaq (QQQ), the technology ETF (XLK), the energy ETF (XLE), Eurodollar futures (SR3), and 20-year U.S. bonds (US). The data starts in 1998 or in the case of the ETFs, at inception.
We will apply a simple moving average system, entering on the close when the price crosses the moving average. The position size for equities will be a $100,000 investment divided by the price. For futures it will be volatility parity, a $25,000 investment divided by the dollar value of the 20-day average true range.
Starting with the S&P
All the markets will be evaluated in the same way, but we will start with SPY from 1998. We will run an “optimization” which shows how each moving average calculation period performed. The results will separate the long and short positions. We will compare the results from 1998 to the present with the results from 2022 to the present.
Chart 1 shows the results of trading both long and short positions in SPY. The full period from 1998 is in blue and the period of 2022-2023 is in orange. As you can see, there is no consistency and most of the results, especially from 2022, are losses. It is not very promising for trends.
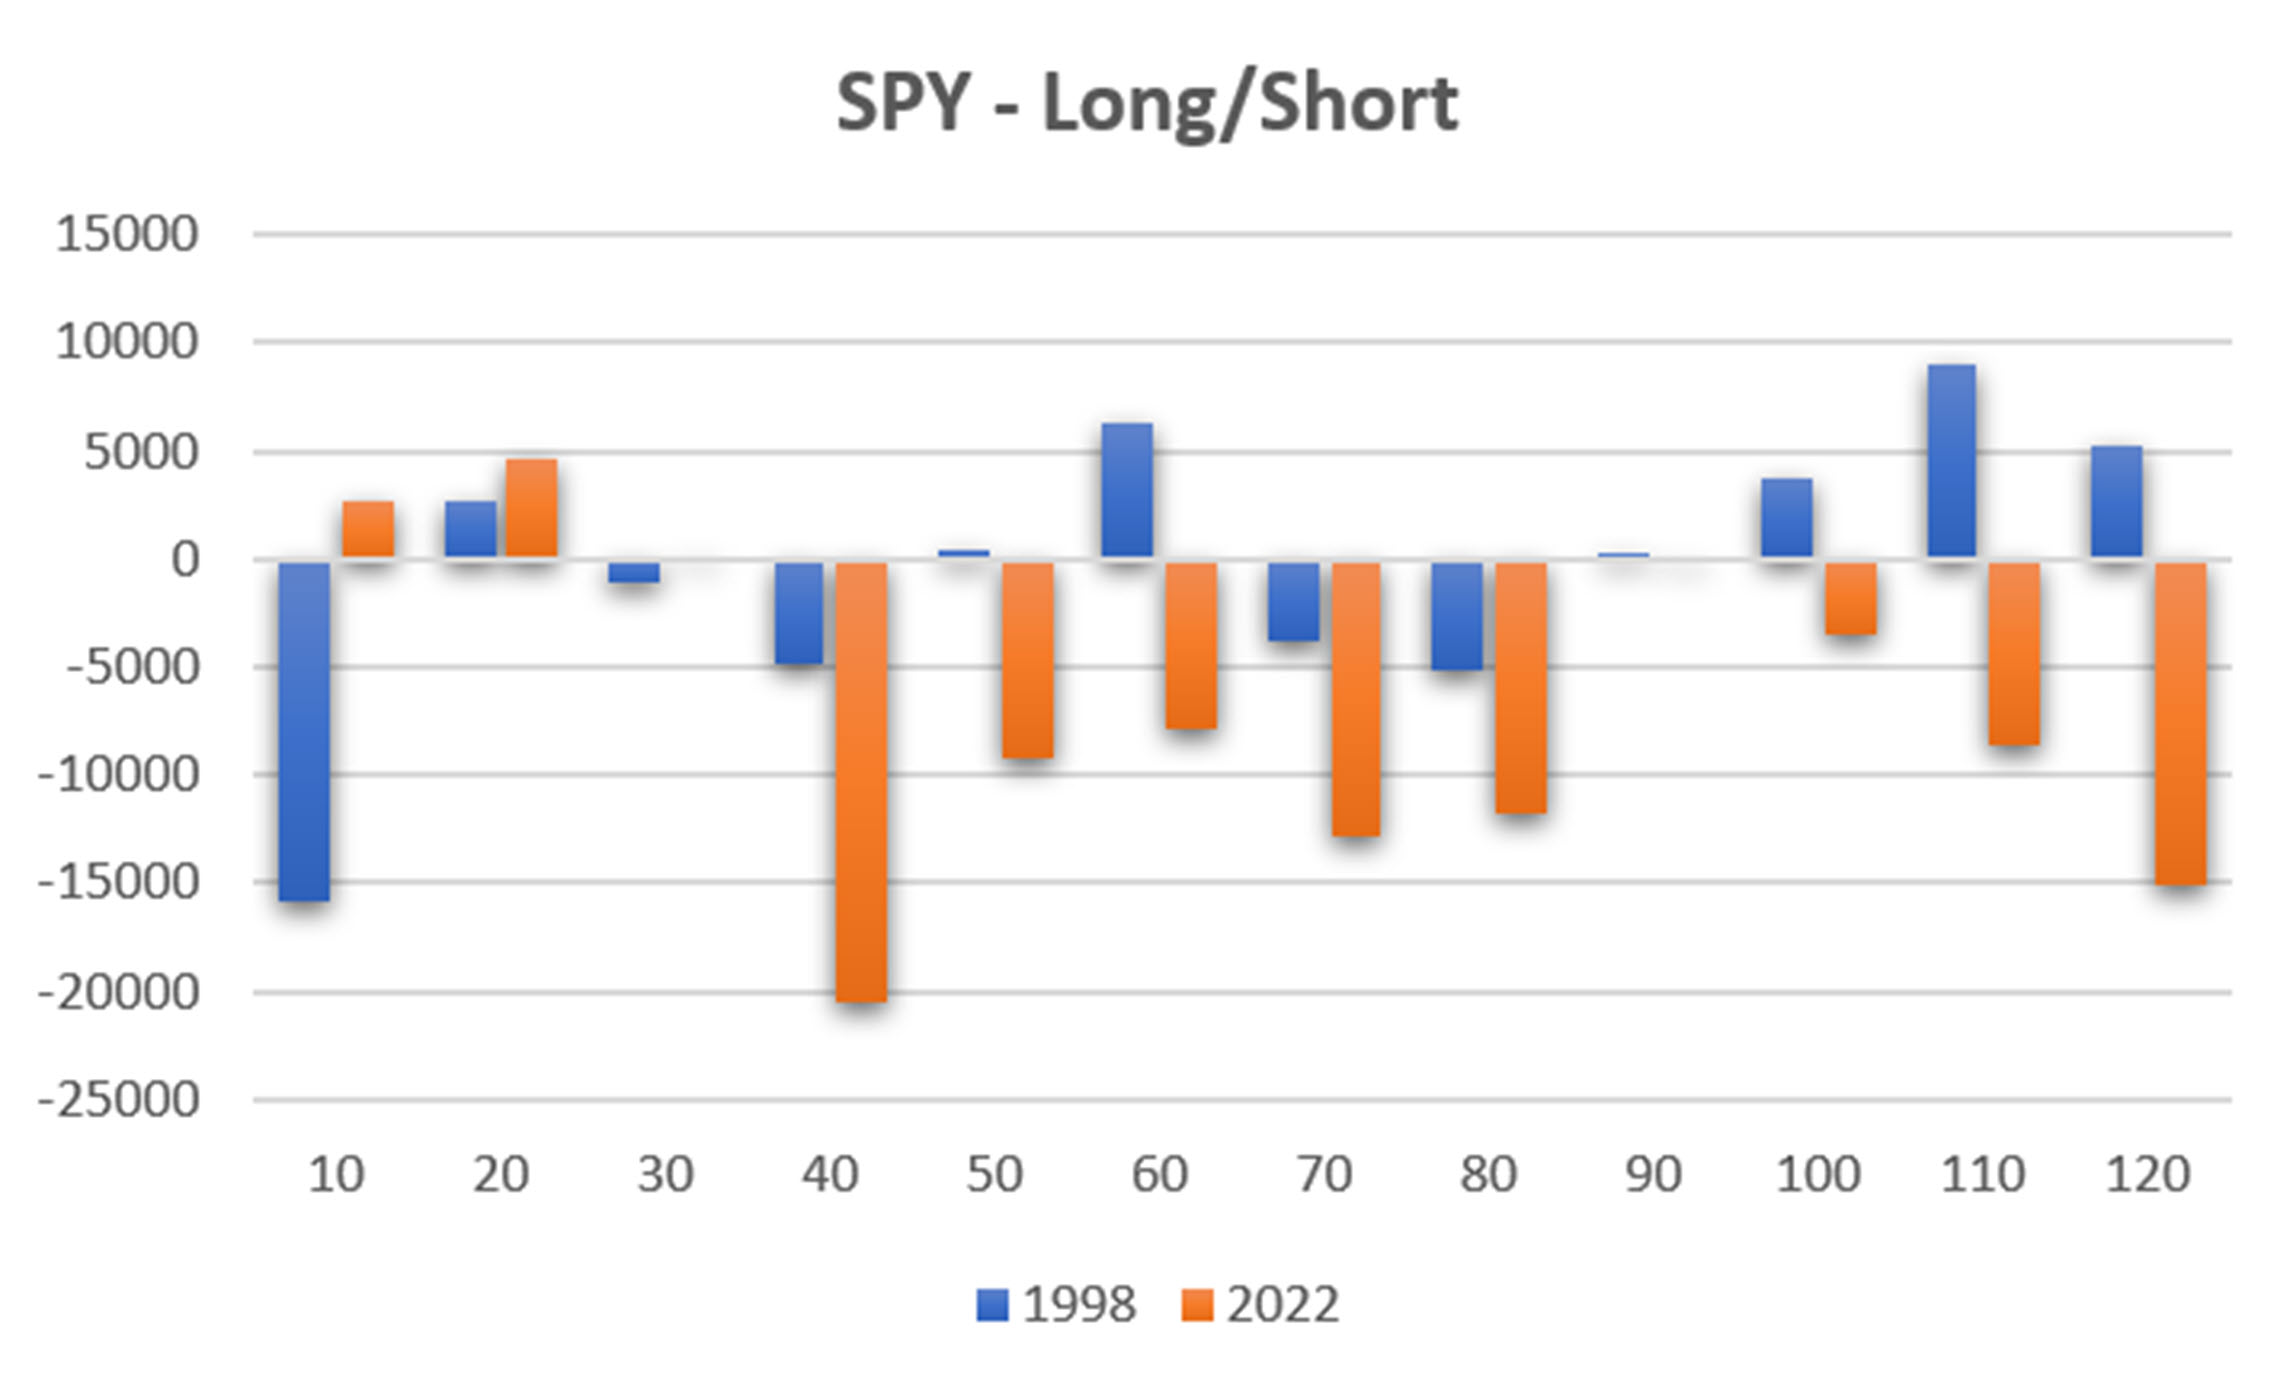
Chart 1. SPY moving average tests from 1998 to now and from 2022 to now.
But we know that there is an upwards bias in the stock market. Most investors are long, and every month new money is added from pension funds. In my own trading, I do not sell short any stocks. With few exceptions, sell-offs are fast and the recoveries occur before you can capture any profits. You can do better with futures because of the leverage, but it is best to avoid short sales. Chart 2 shows the results of the SPY moving average test long-only.
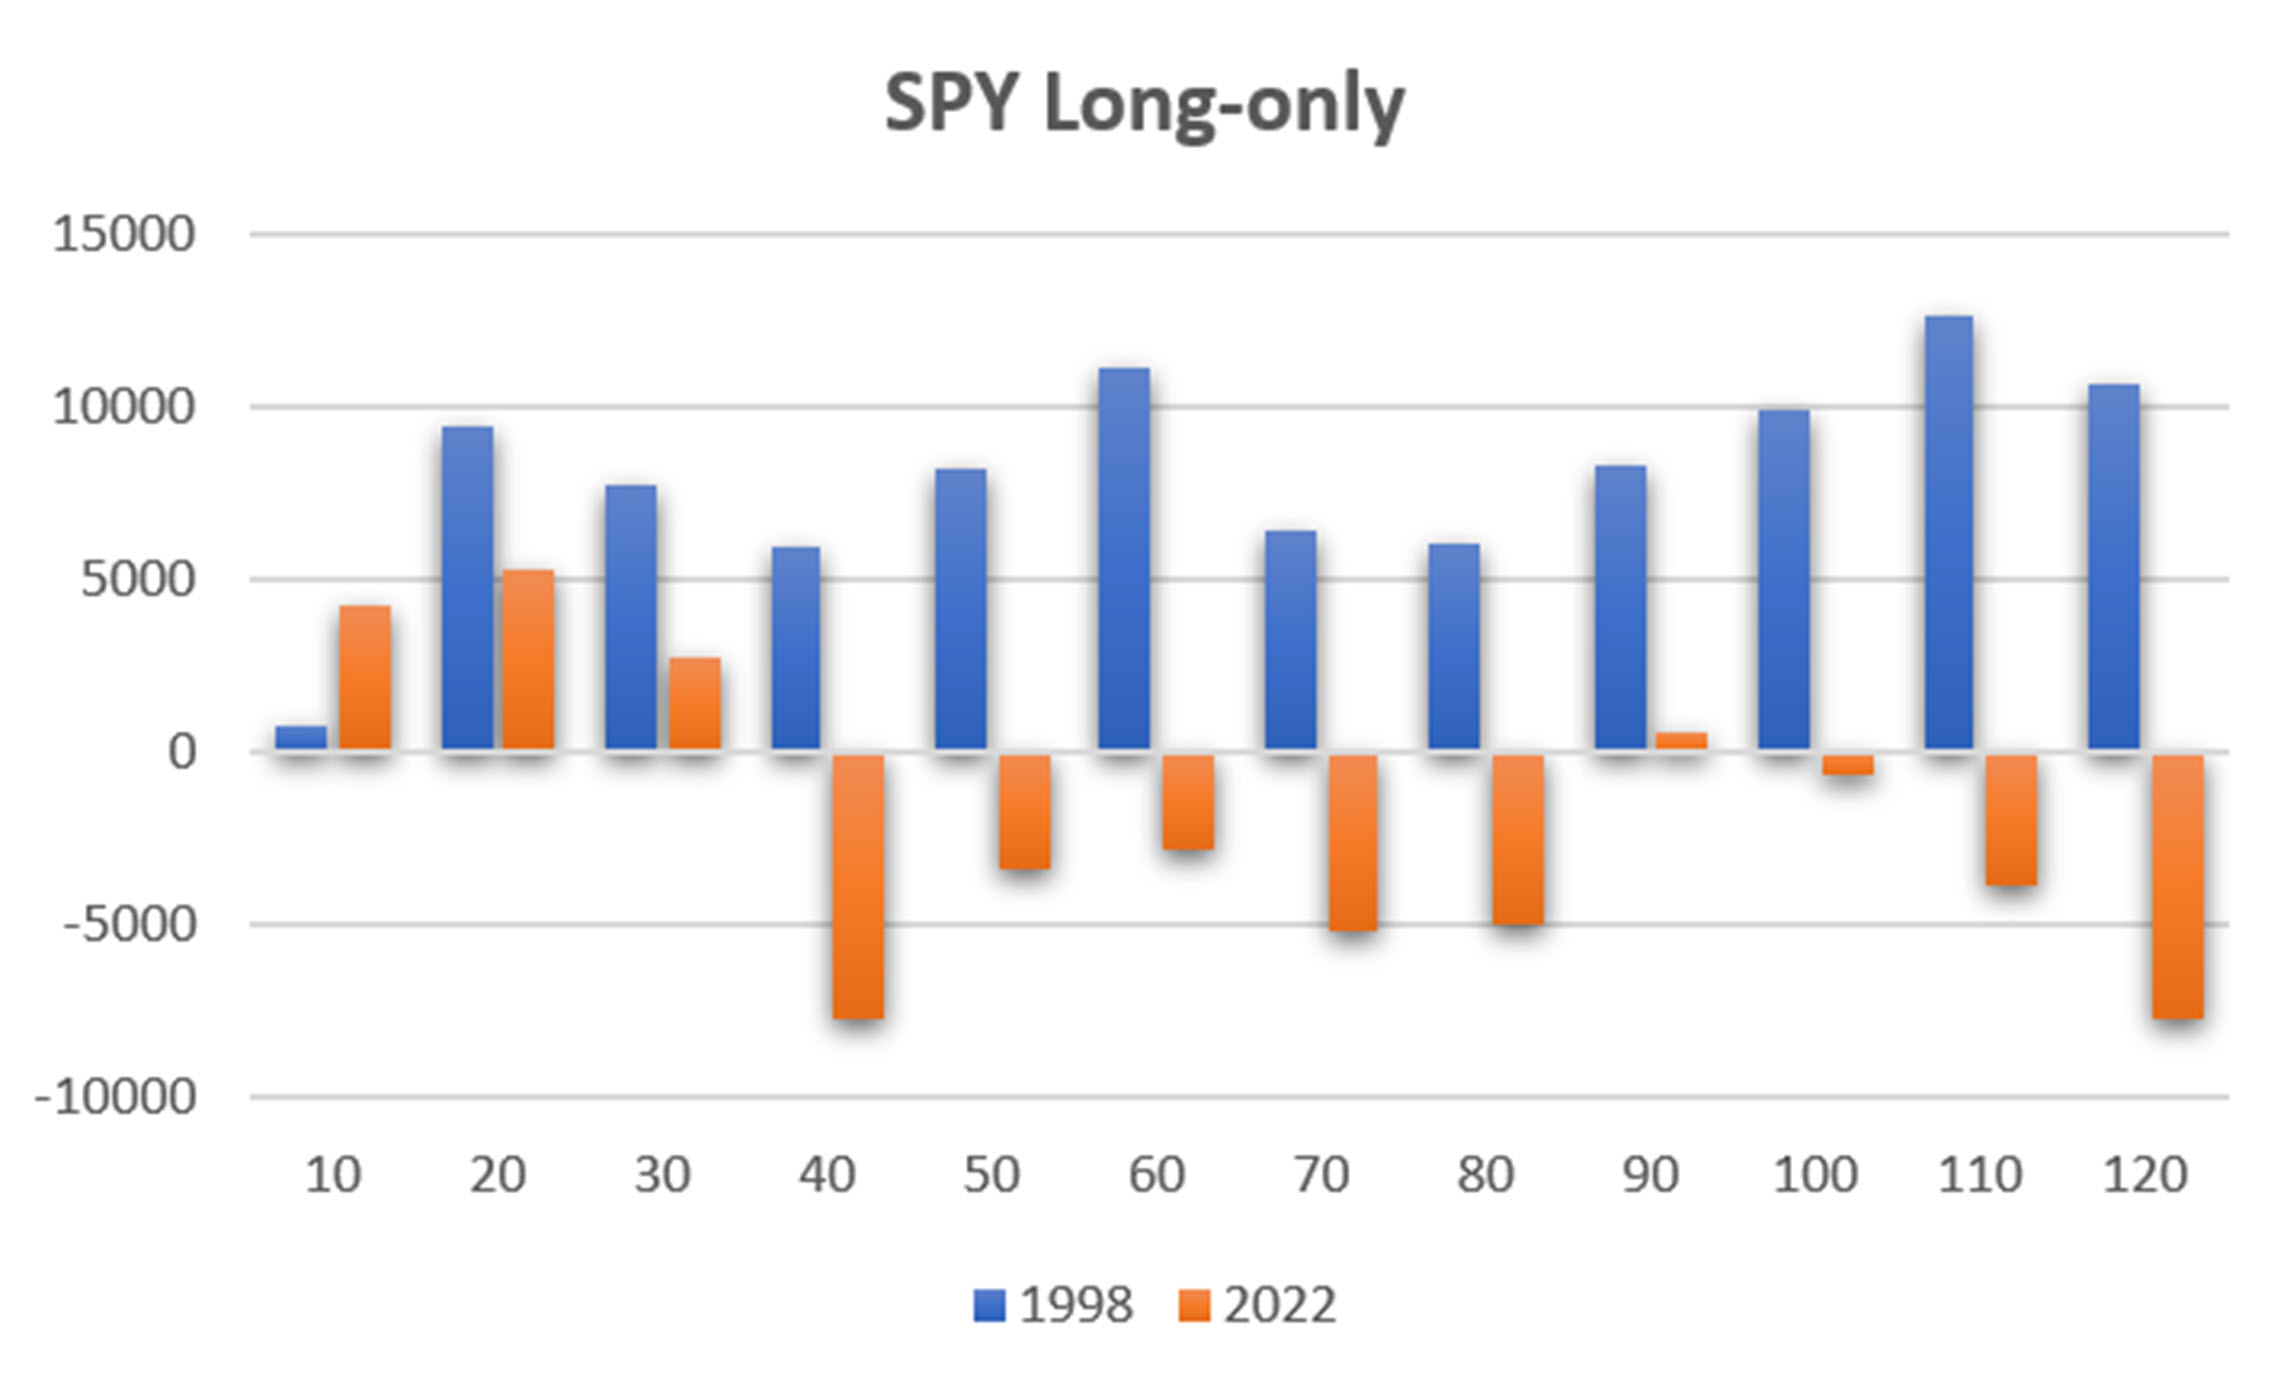
Chart 2. SPY moving average tests, long-only.
The long-only results look quite different, profits at every calculation period using data from 1998, and some profits beginning in 2022 using the faster moving averages. Just to be clear, Chart 3 shows the same test for short sales only.
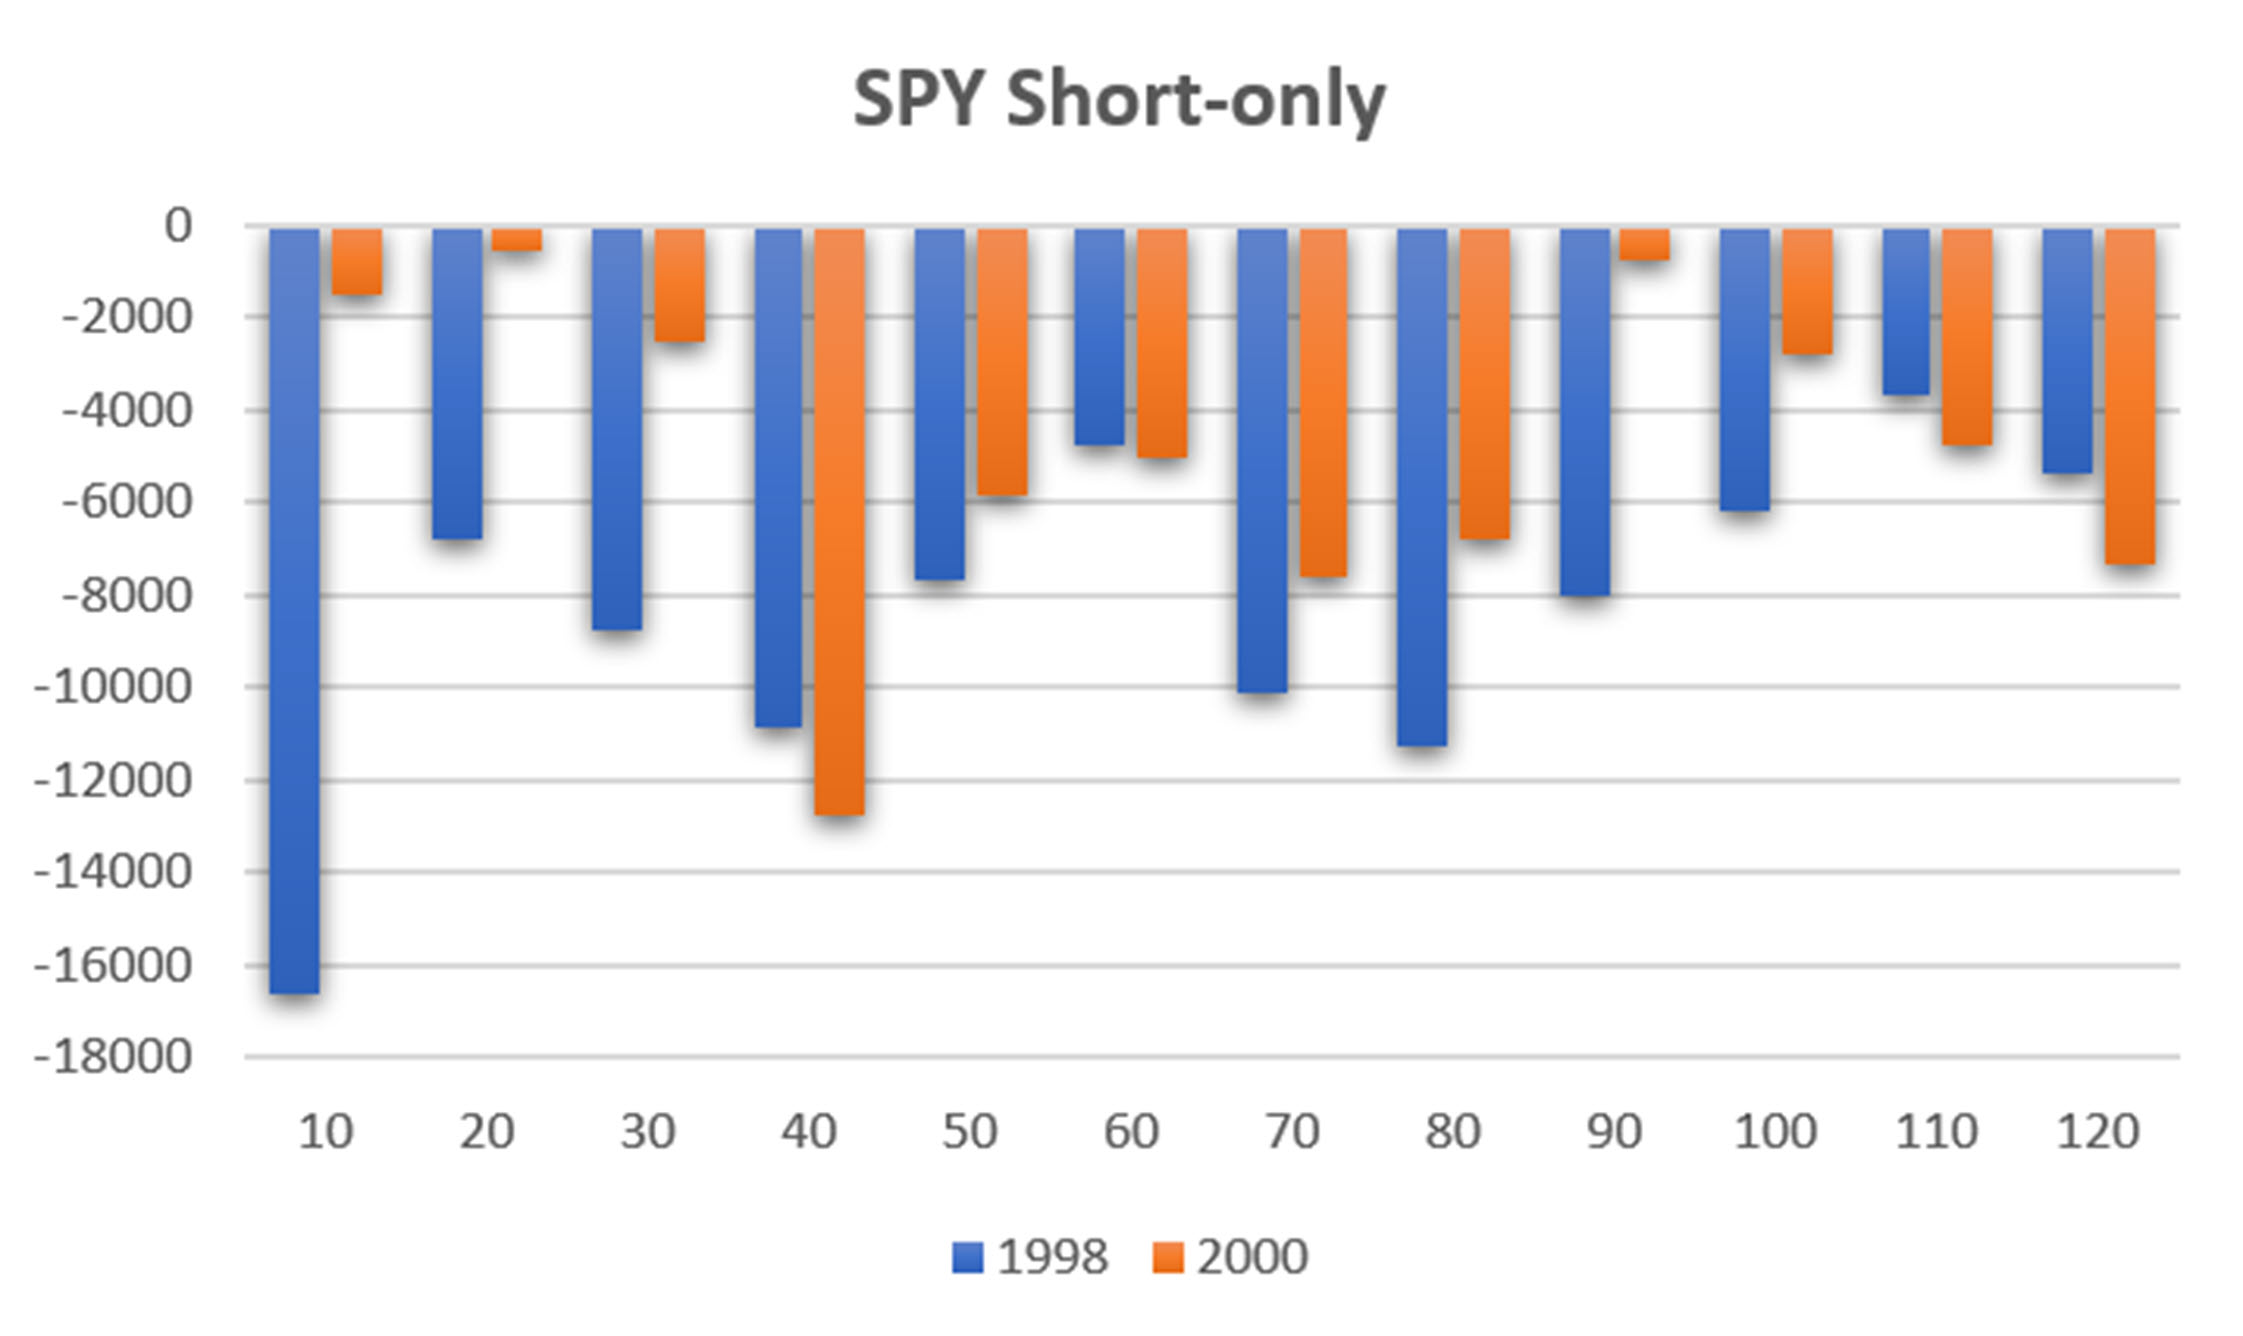
Chart 3. SPY moving average tests, short sales only.
You can see that there are no profits during either time interval, no matter what moving average we use. I won’t repeat all of these tests for most markets if you accept that short sales are a difficult way to make money.
Choosing Between a Slower or a Faster Trend
We have identified that, if you traded a 20- or 30-day moving average, long-only, you would have netted a profit from the longer 1998 period, as well as 2022-2023. But the total would be smaller than using a 110-day average, even when we include the past two years.. Macrotrend traders, typically using calculation periods from 80 days and higher, would be taking varying amounts of loss during the past year.
The best we can do is to look at Chart 2 and decide which result that includes both 1998 and 2022 is the best trade-off. Now it becomes your choice. Do you use a 20-day average and show profits for the entire period, or a 110-day average that makes more but shows a loss from 2022? I can’t answer that for you. Perhaps looking at the results of other markets will help.
NASDAQ (QQQ)
It should not be a surprise that QQQ has a similar pattern to SPY, although it tends to be more volatile and moves faster. Chart 4 compares the total profits for moving averages, both long and short positions, over the same time intervals. We see profits for 2022-2023 for the 10, 20, and 30-day trends, and higher profits for the longer calculation periods.
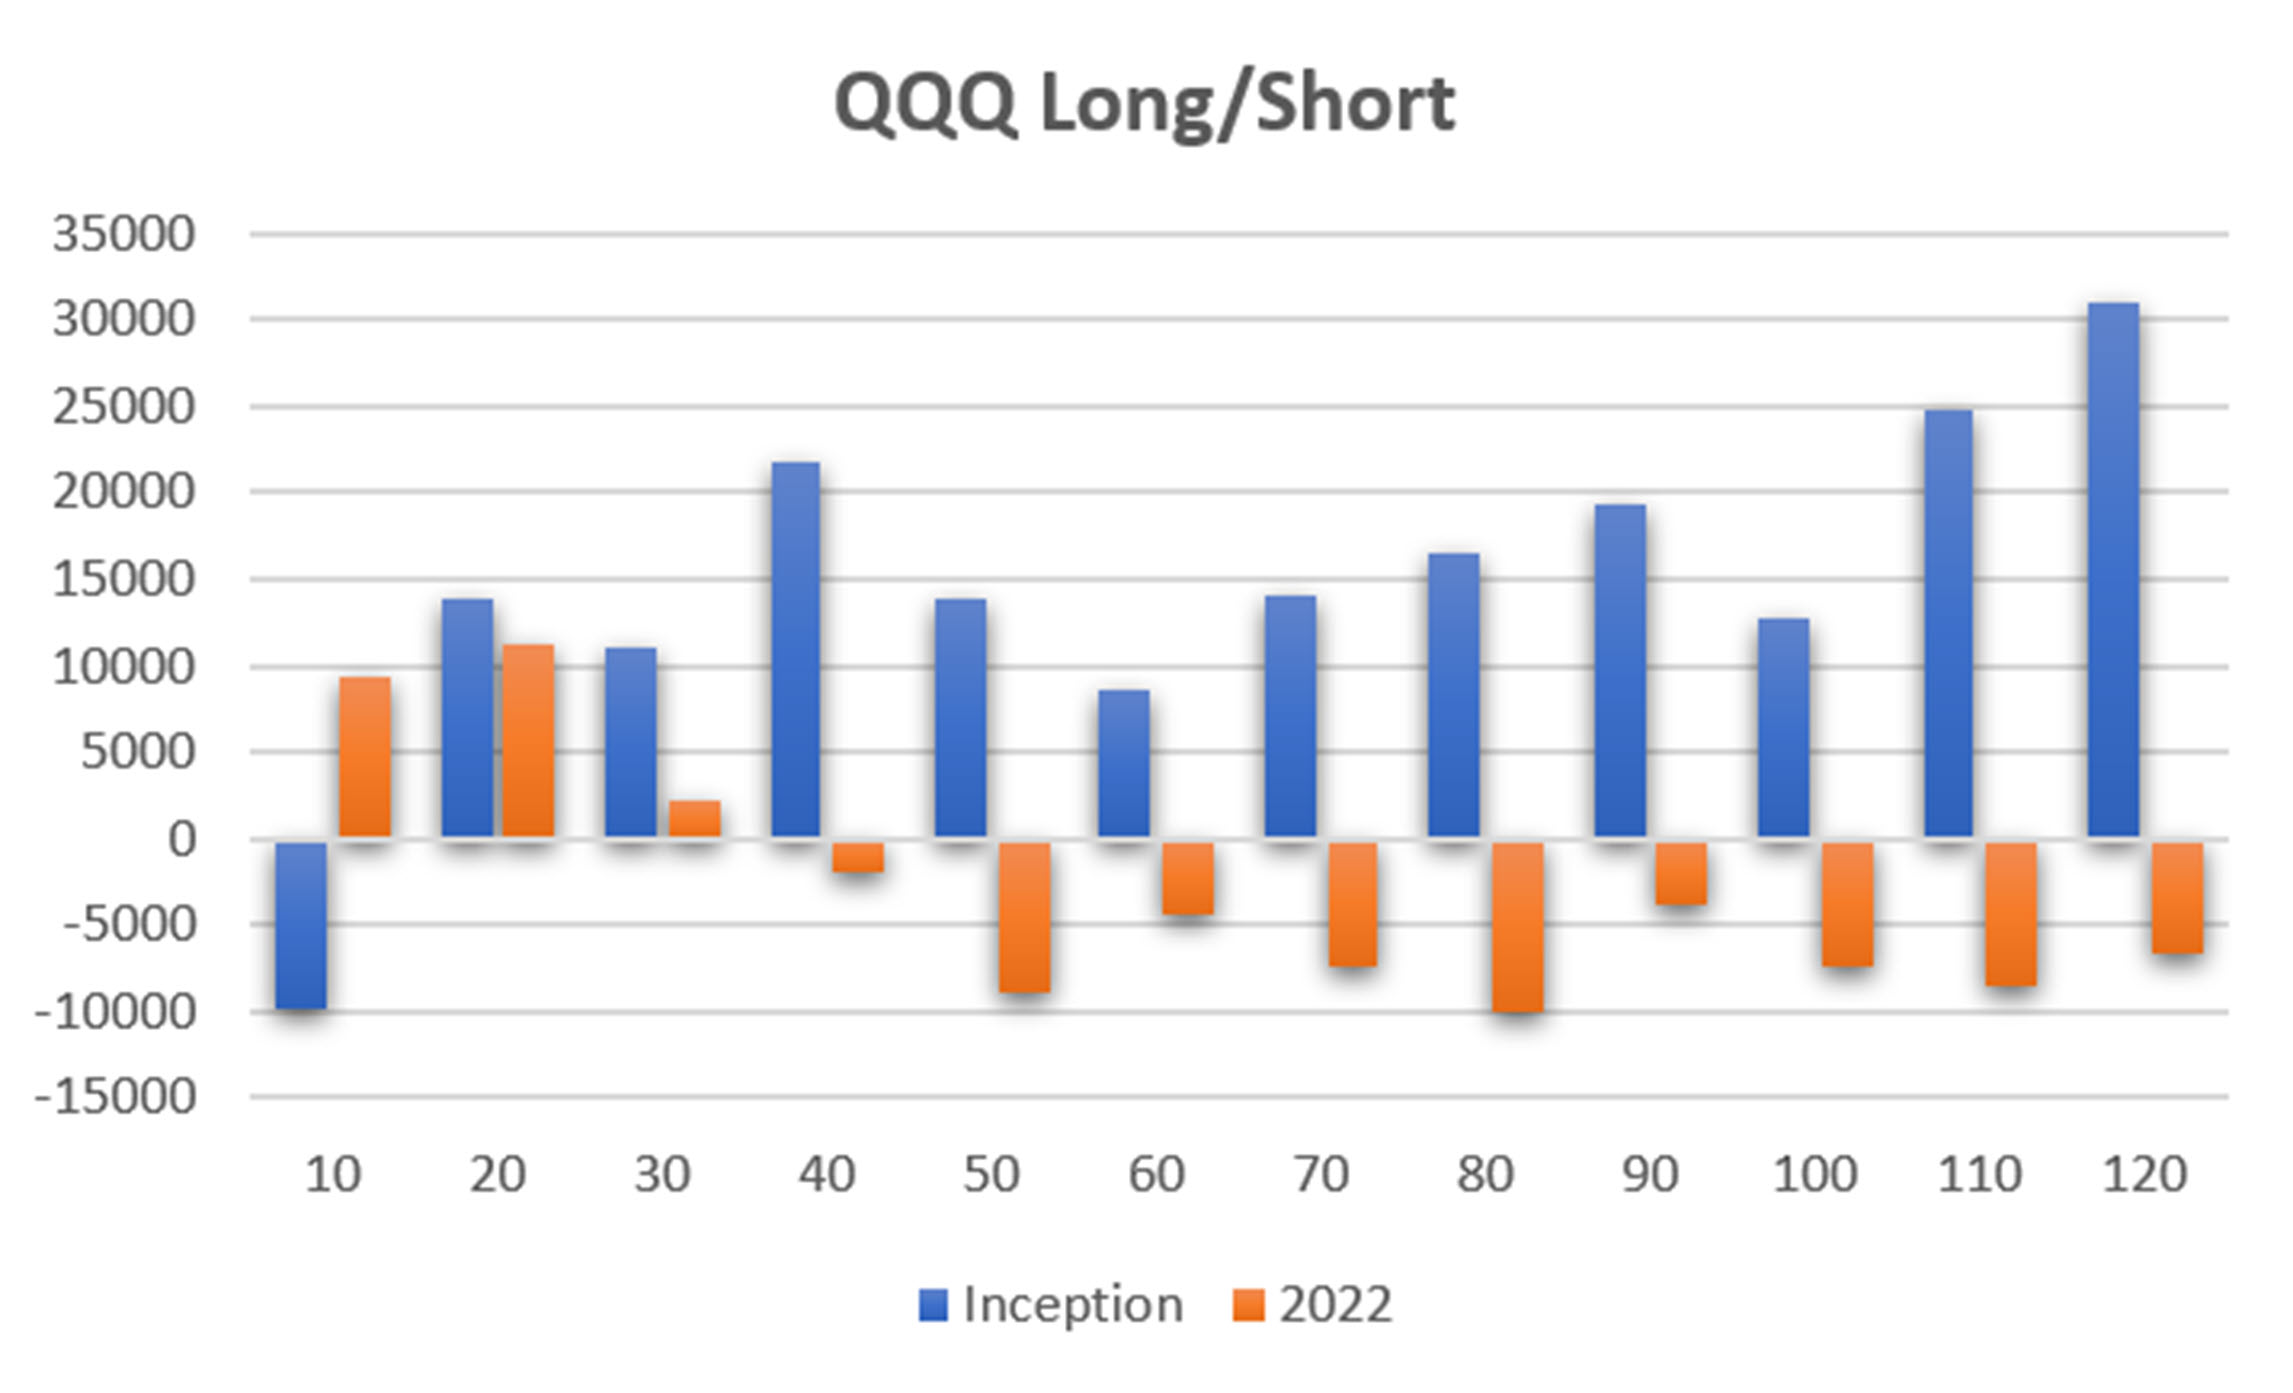
Chart 4. Trend tests for QQQ showing the results of two test periods.
If we also look at taking only long positions, the results are much more uniform, but profits in the 2022-2023 period are still limited to the faster trends. In choosing which might be best, the 40-day trend has good returns for the entire period, as well as some profit in the past year. But it might be an outlier, while the results of calculation periods from 80 to 120-days are consistent.

Chart 5. Trend tests for QQQ long-only.
Technology and Energy ETFs
Moving on, we now look at the two most interesting ETFs, technology (XLK) and energy (XLE). Both have had significant moves and high volatility.
I’m going to short-cut this and go directly to the long-only test of XLK, Chart 6. We can immediately see that it looks nearly identical to the QQQ test. That should not be surprising because the high-cap technology stocks, Google, Apple, and others, account for a large part of the Nasdaq 100 Index. In this test, the 40 and 50-day trends look a bit more tempting and do not lose money in the past year.
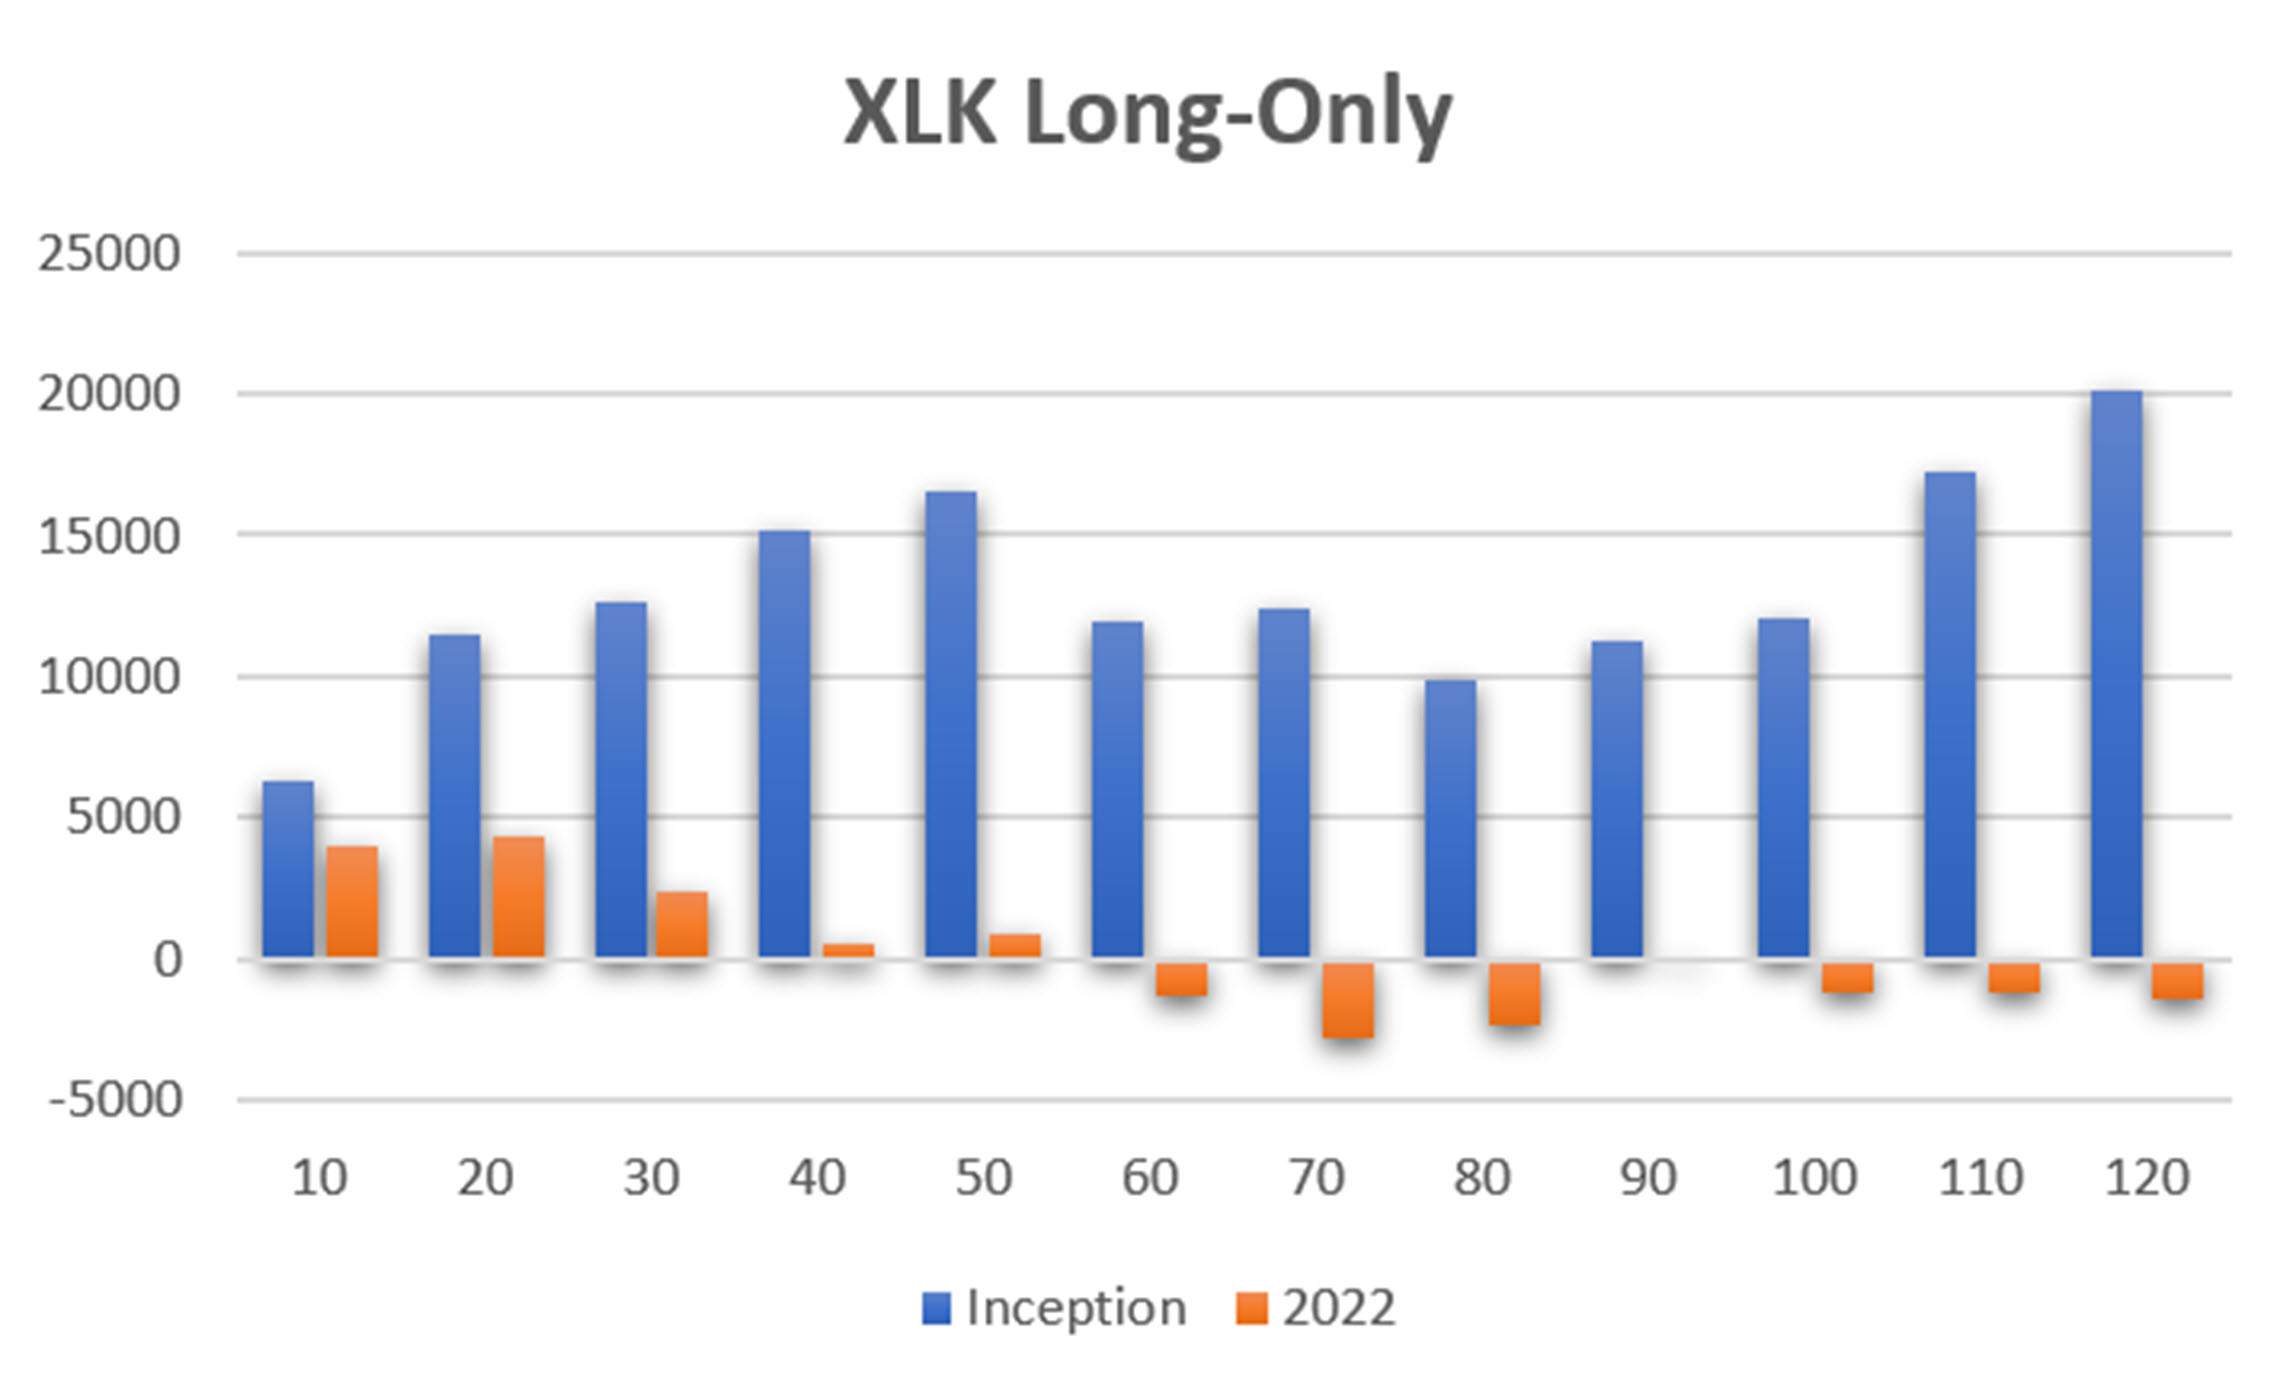
Chart 6. Trend tests of the technology ETF (XLK).
Energy is different. It is volatile and has had large price swings, even though it has recently gone quiet. Crude oil, having been up to $150/bbl, down to $30, up to $110 and down again, we could expect it to have netted profits on both longs and shorts. However, this is not crude oil, but stocks in the energy business. And because they are stocks, they end up with a pattern similar to SPY, as shown in Chart 7. None of the short sales are profitable.
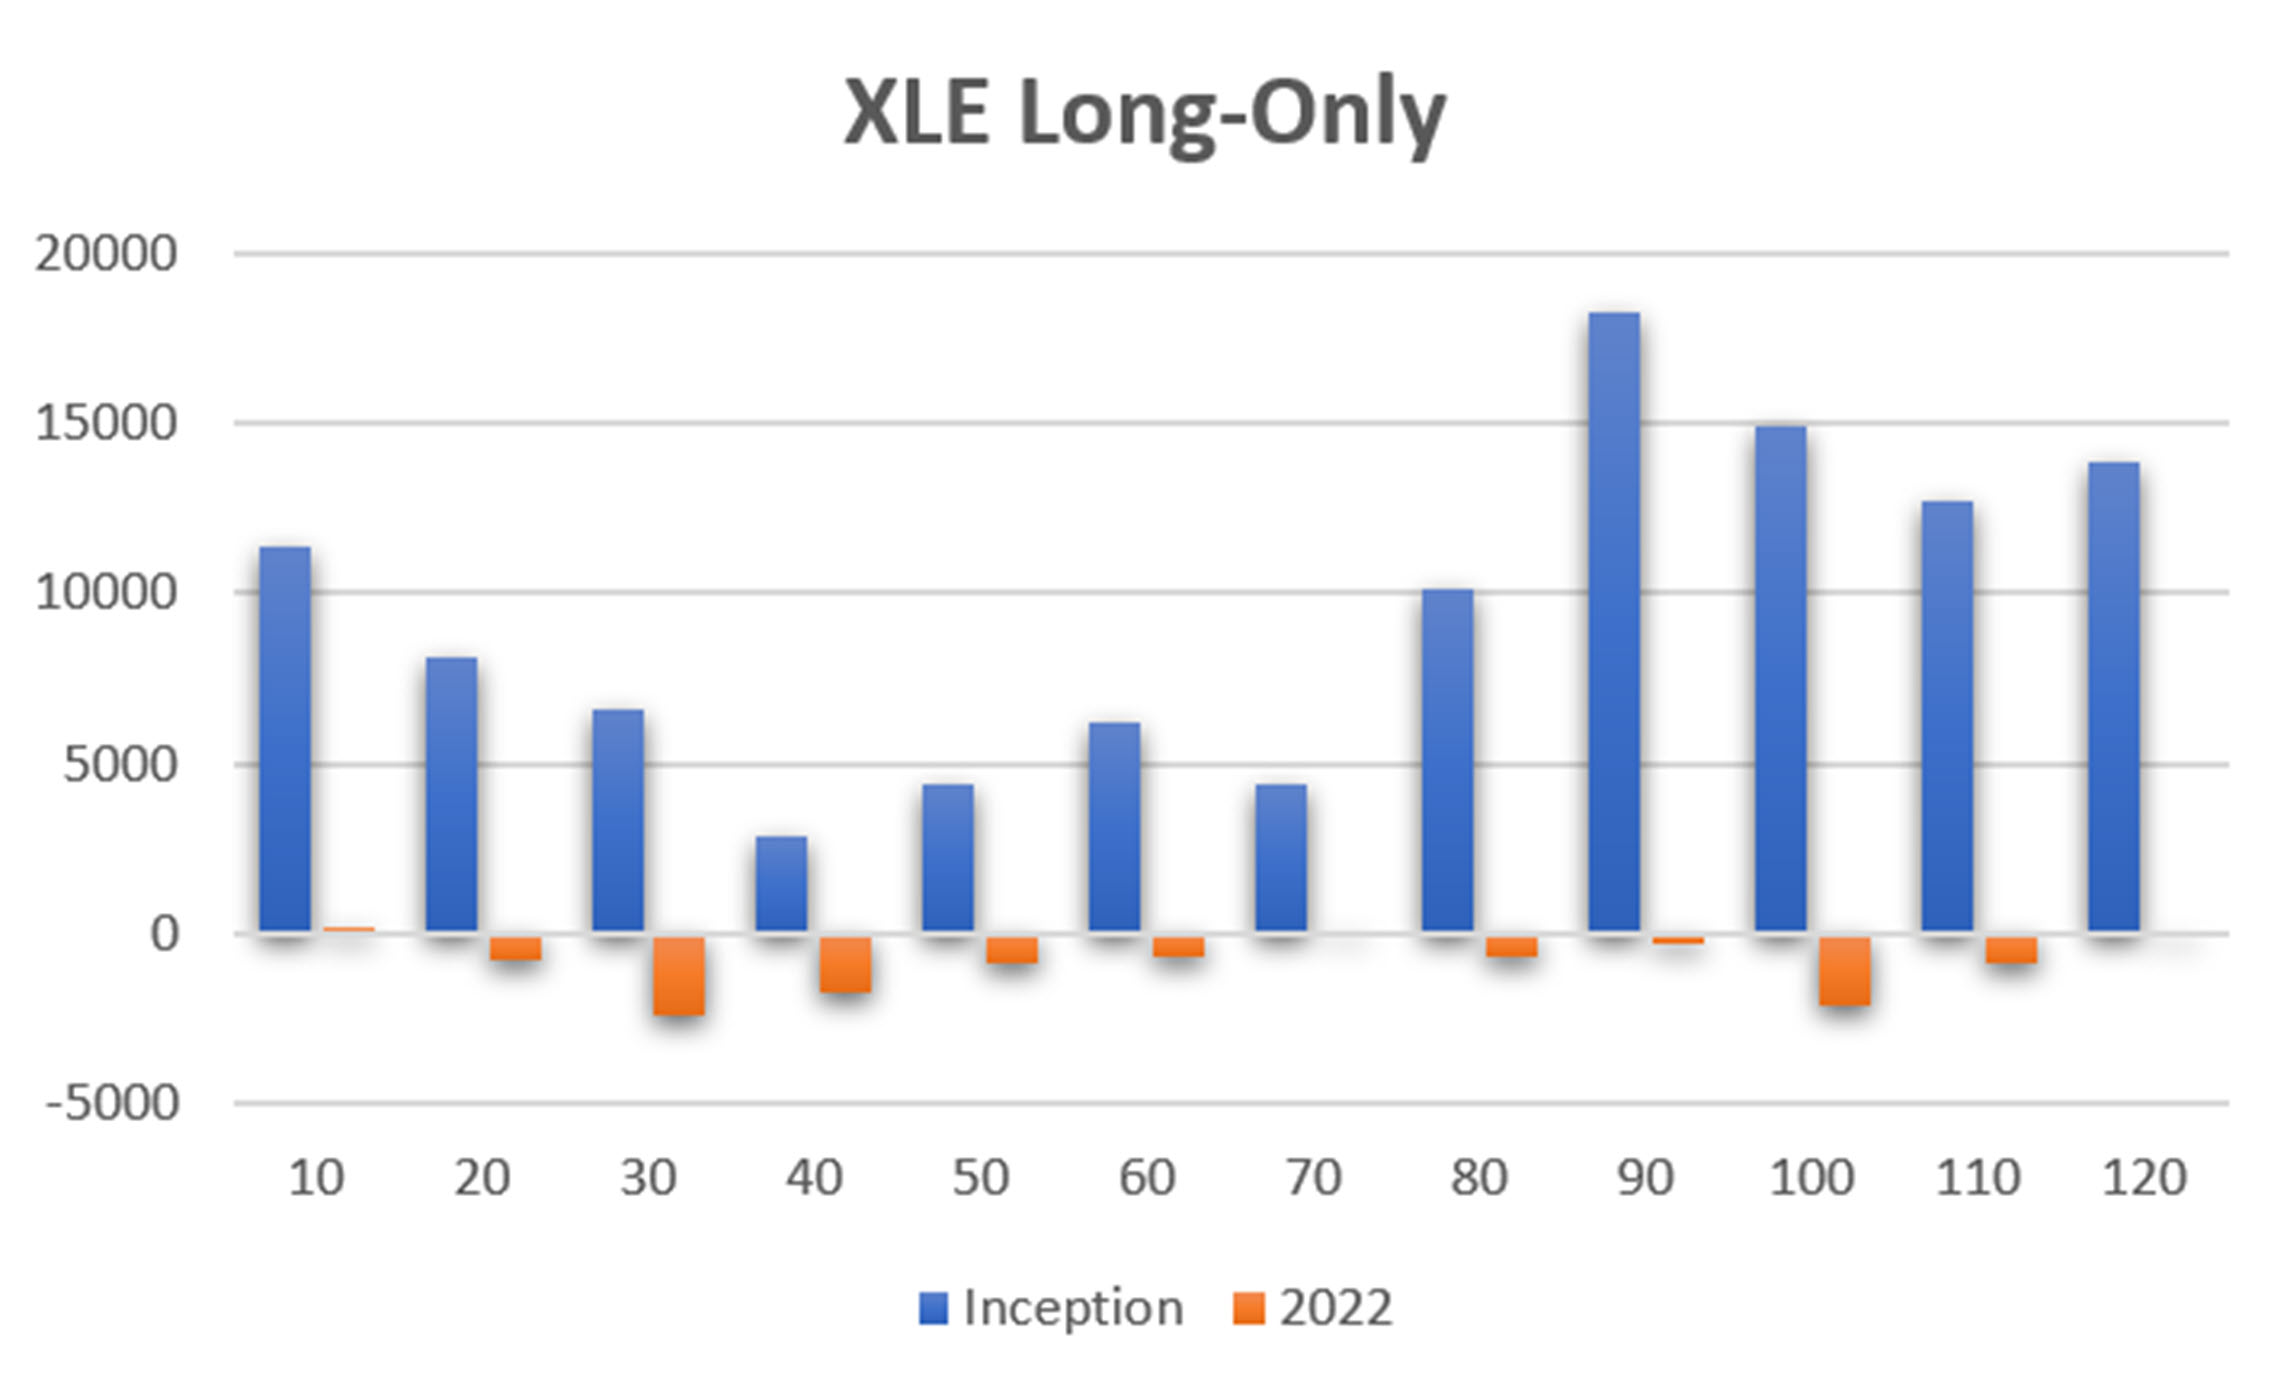
Chart 7. Trend tests of the energy ETF (XLE).
Futures: Crude Oil, Eurodollars, and U.S. Bonds
Now we will look at crude oil futures, a completely different market from energy stocks. Chart 8 shows that there were good profits to be made during the entire period from 1998, but consistent losses from 2022. It seems like a familiar story. What makes this different is that peak profits occur at both ends of the calculation periods, 20 and 120. Given that, I would choose the slower trend because the faster one is surrounded by losses. A small change in the timing van turn a profit into a loss.

Chart 8. Crude oil futures trend results for long and short trades.
When we look at Chart 9, the long-only trades, we see a similar pattern. The interesting point is that the net profits are about one-half of those in the long-short chart, indicating that the profits from shorts were about the same as longs during the period from 1998.

Chart 9. Crude oil futures trend results for long-only trades.
The short-only crude trades are shown in Chart 10. The profit pattern for the entire period is similar to the long-only trades, but the 2022 results show a mixture of small profits and losses.
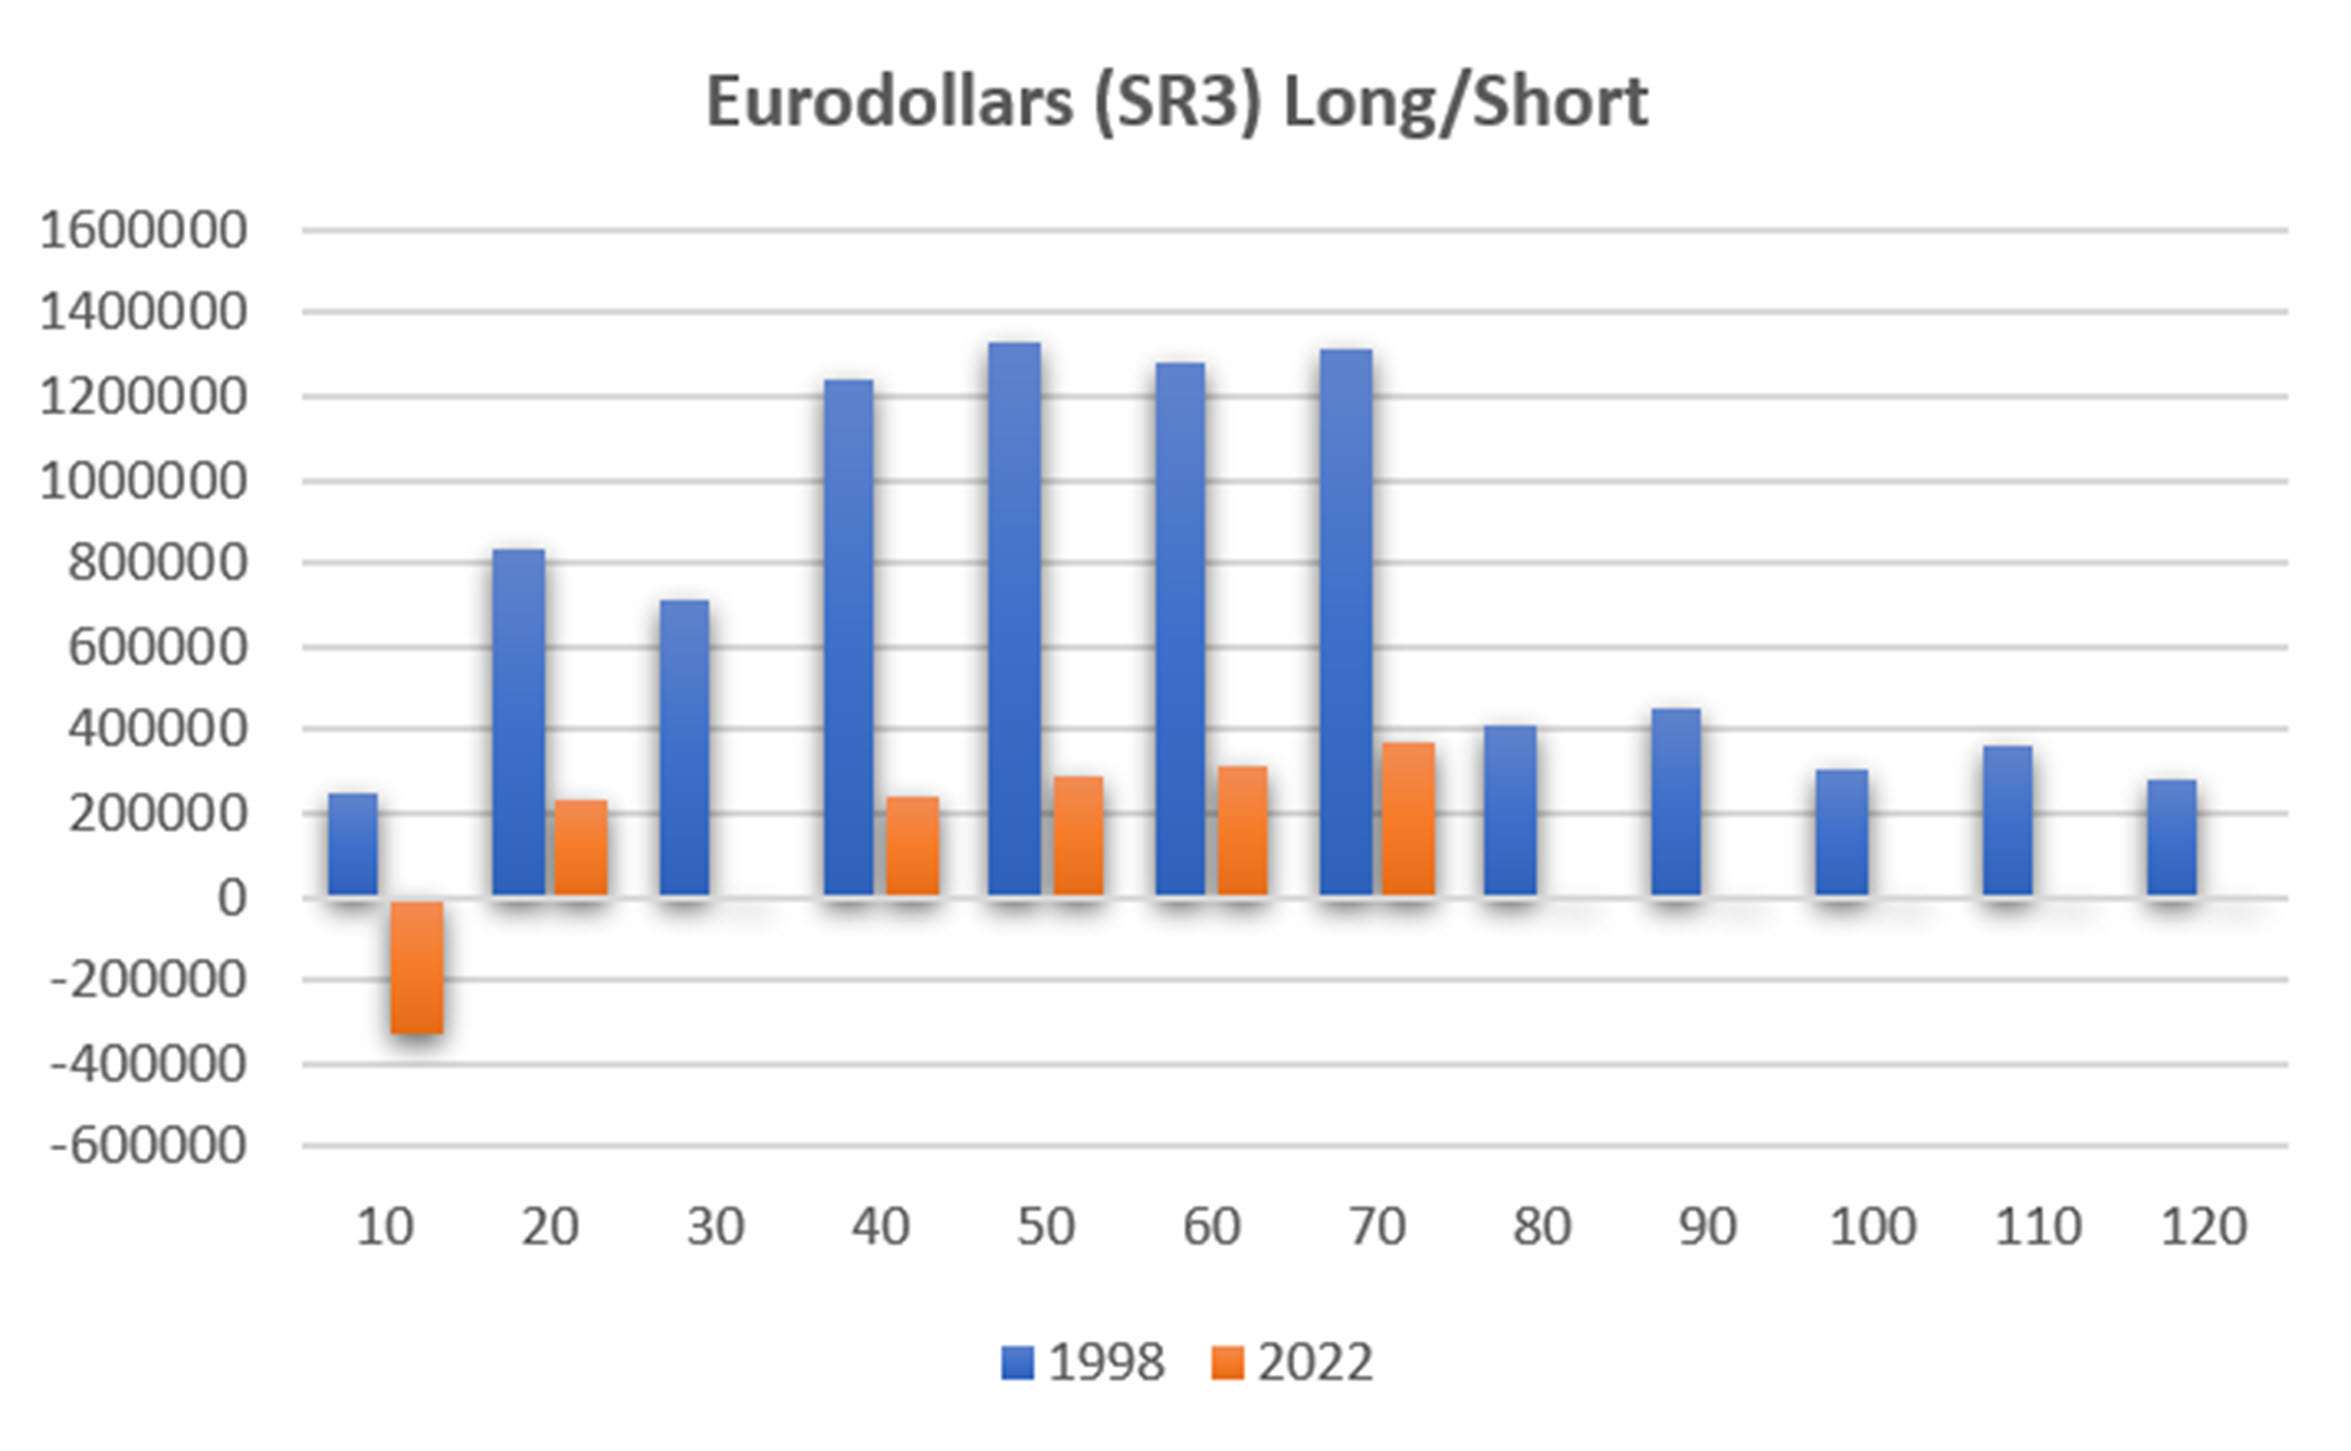
Chart 10. Crude oil futures trades, short-only.
Trying to figure out the best trend speed for crude futures means accepting both long and short trades. I would favor choosing from the slower trends, 90- to 120-days. While they show losses from 2022, those are more likely from long trades, while the short sales show mostly small gains.
Eurodollars
In all the studies that I’ve done, and backed up by trading, Eurodollars futures (SR3), or generally 3-month interest rate futures (for example, short sterling and Euribor), have the most trend of all markets. They also have higher risk because their volatility is small which requires much larger positions to balance their returns in a portfolio. These smoother price series tends to favor faster trends as shown in Chart 11.

Chart 11. Eurodollar (SR3) futures moving average tests.
Notice that the 2022 results do not show the results for trade with trends of 80 days and longer. That’s because the long-term trends turned down and stayed down. The profits shown occurred prior to 2022.
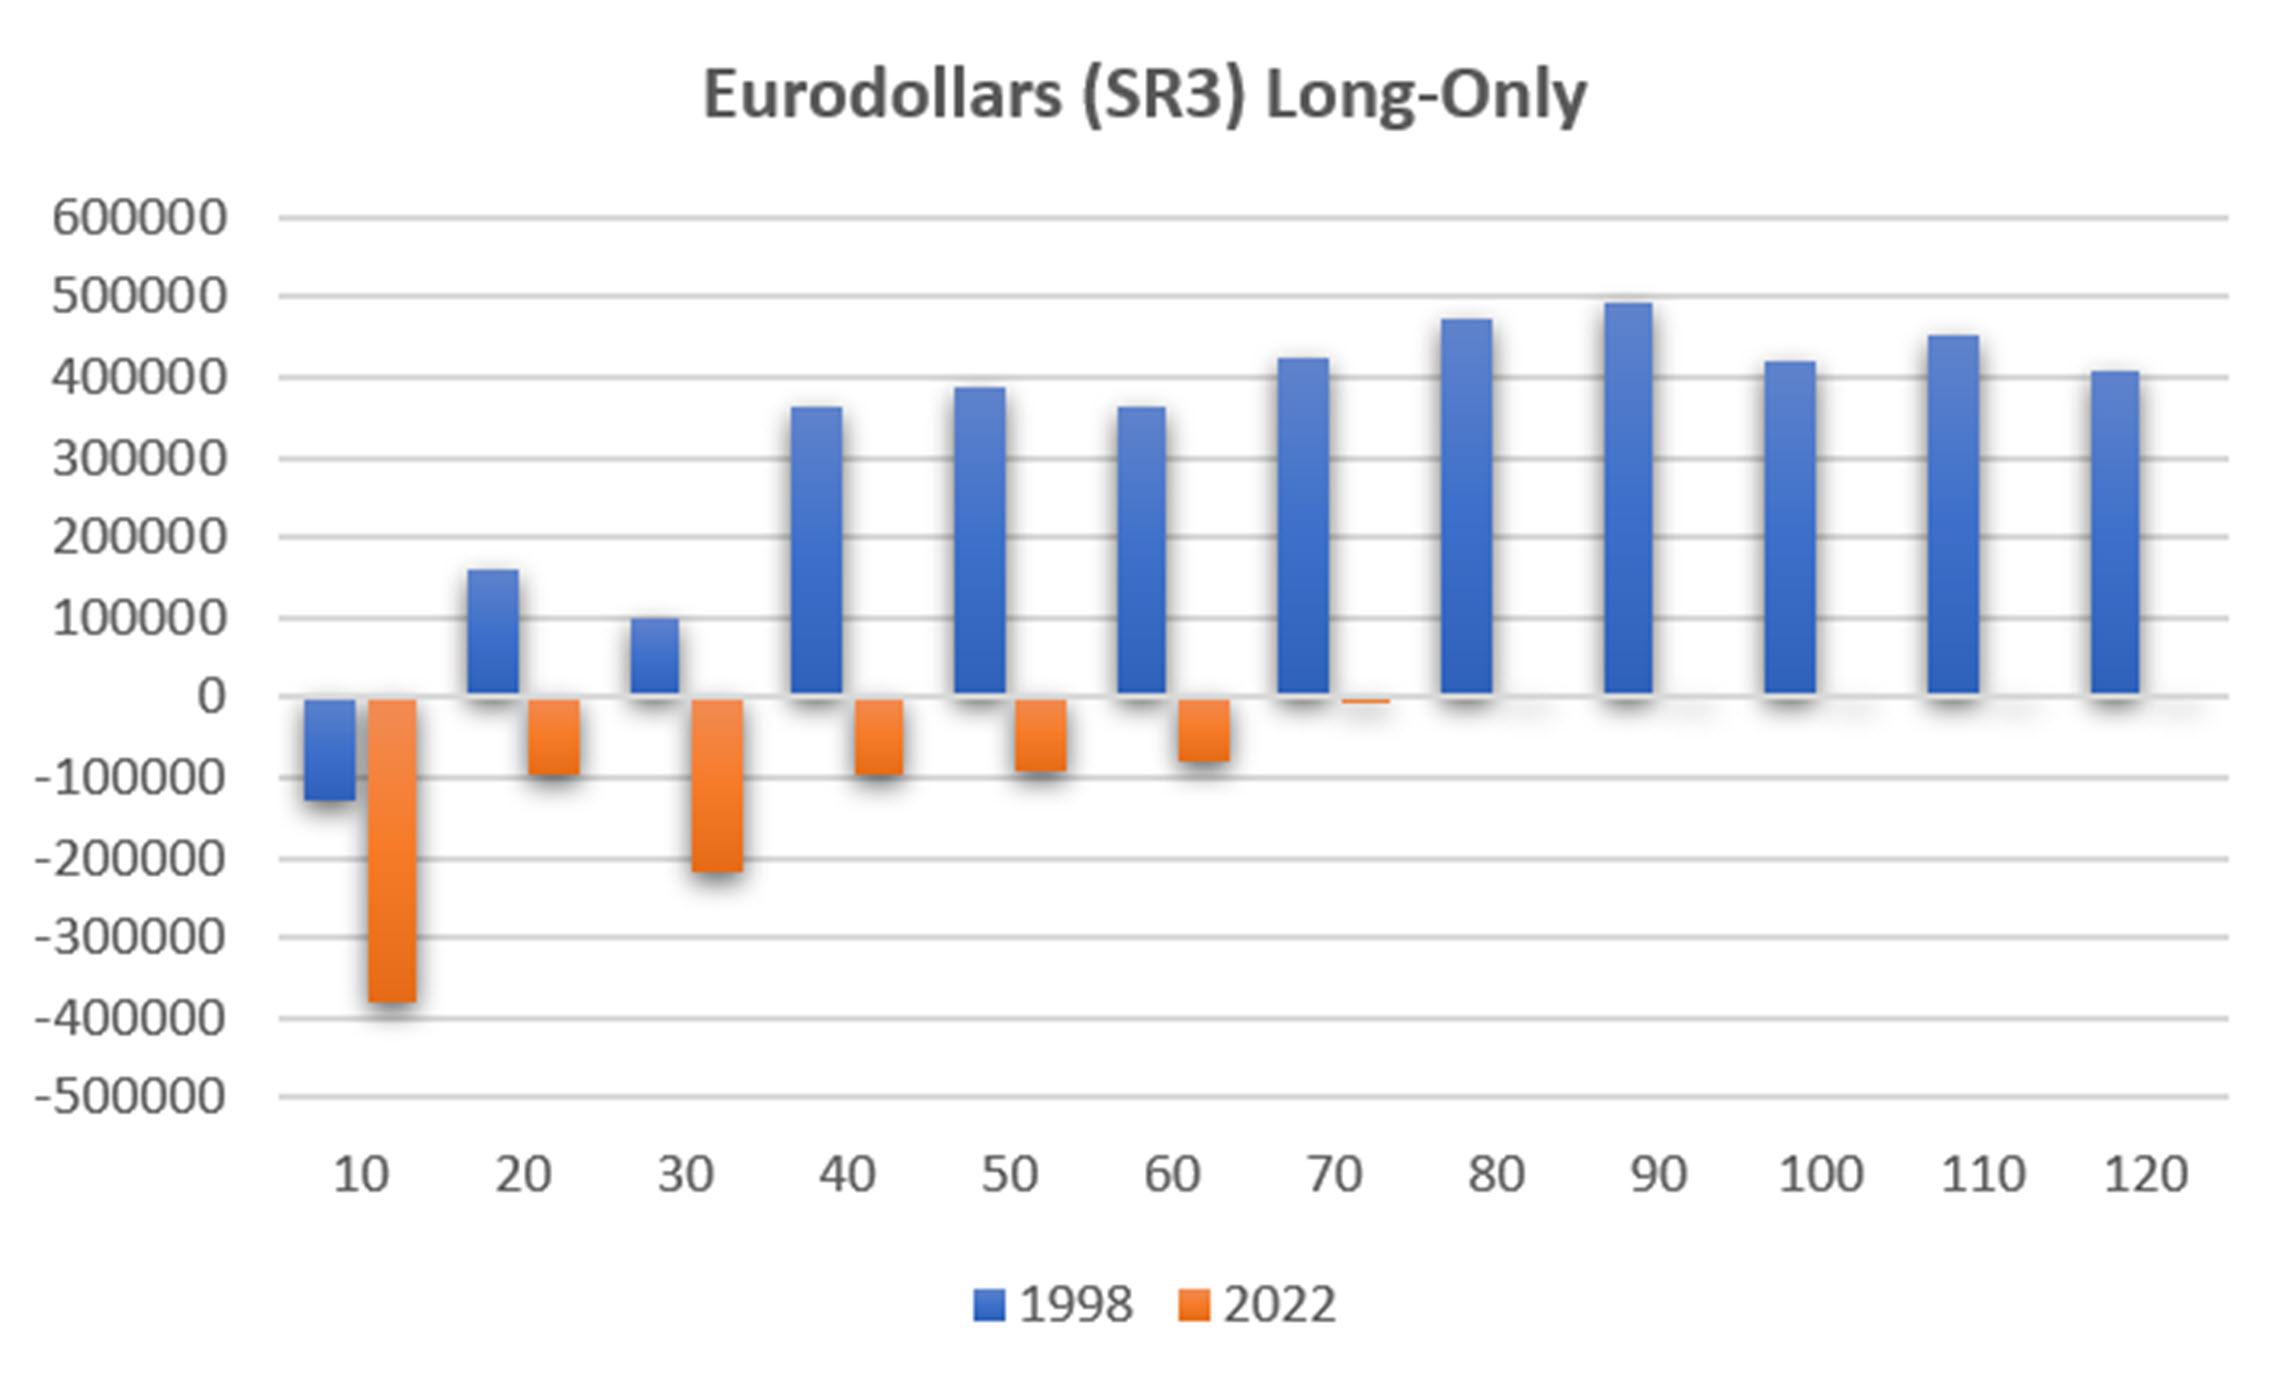
Chart 12. Test results for Eurodollar (SR3) futures, long-only.
During the past two years, the short sales are the most interesting and the most profitable. Chart 13 shows that the recent period accounted for a large part of the Eurodollar short-sale gains. The rest was probably the rise in rates ahead of the 2008 financial crisis. Again, the lack of data from the 80-day trend and higher is because TradeStation does not post results from open trades, and SR3 has been short for months. We should expect large profits from short sales during the past year.
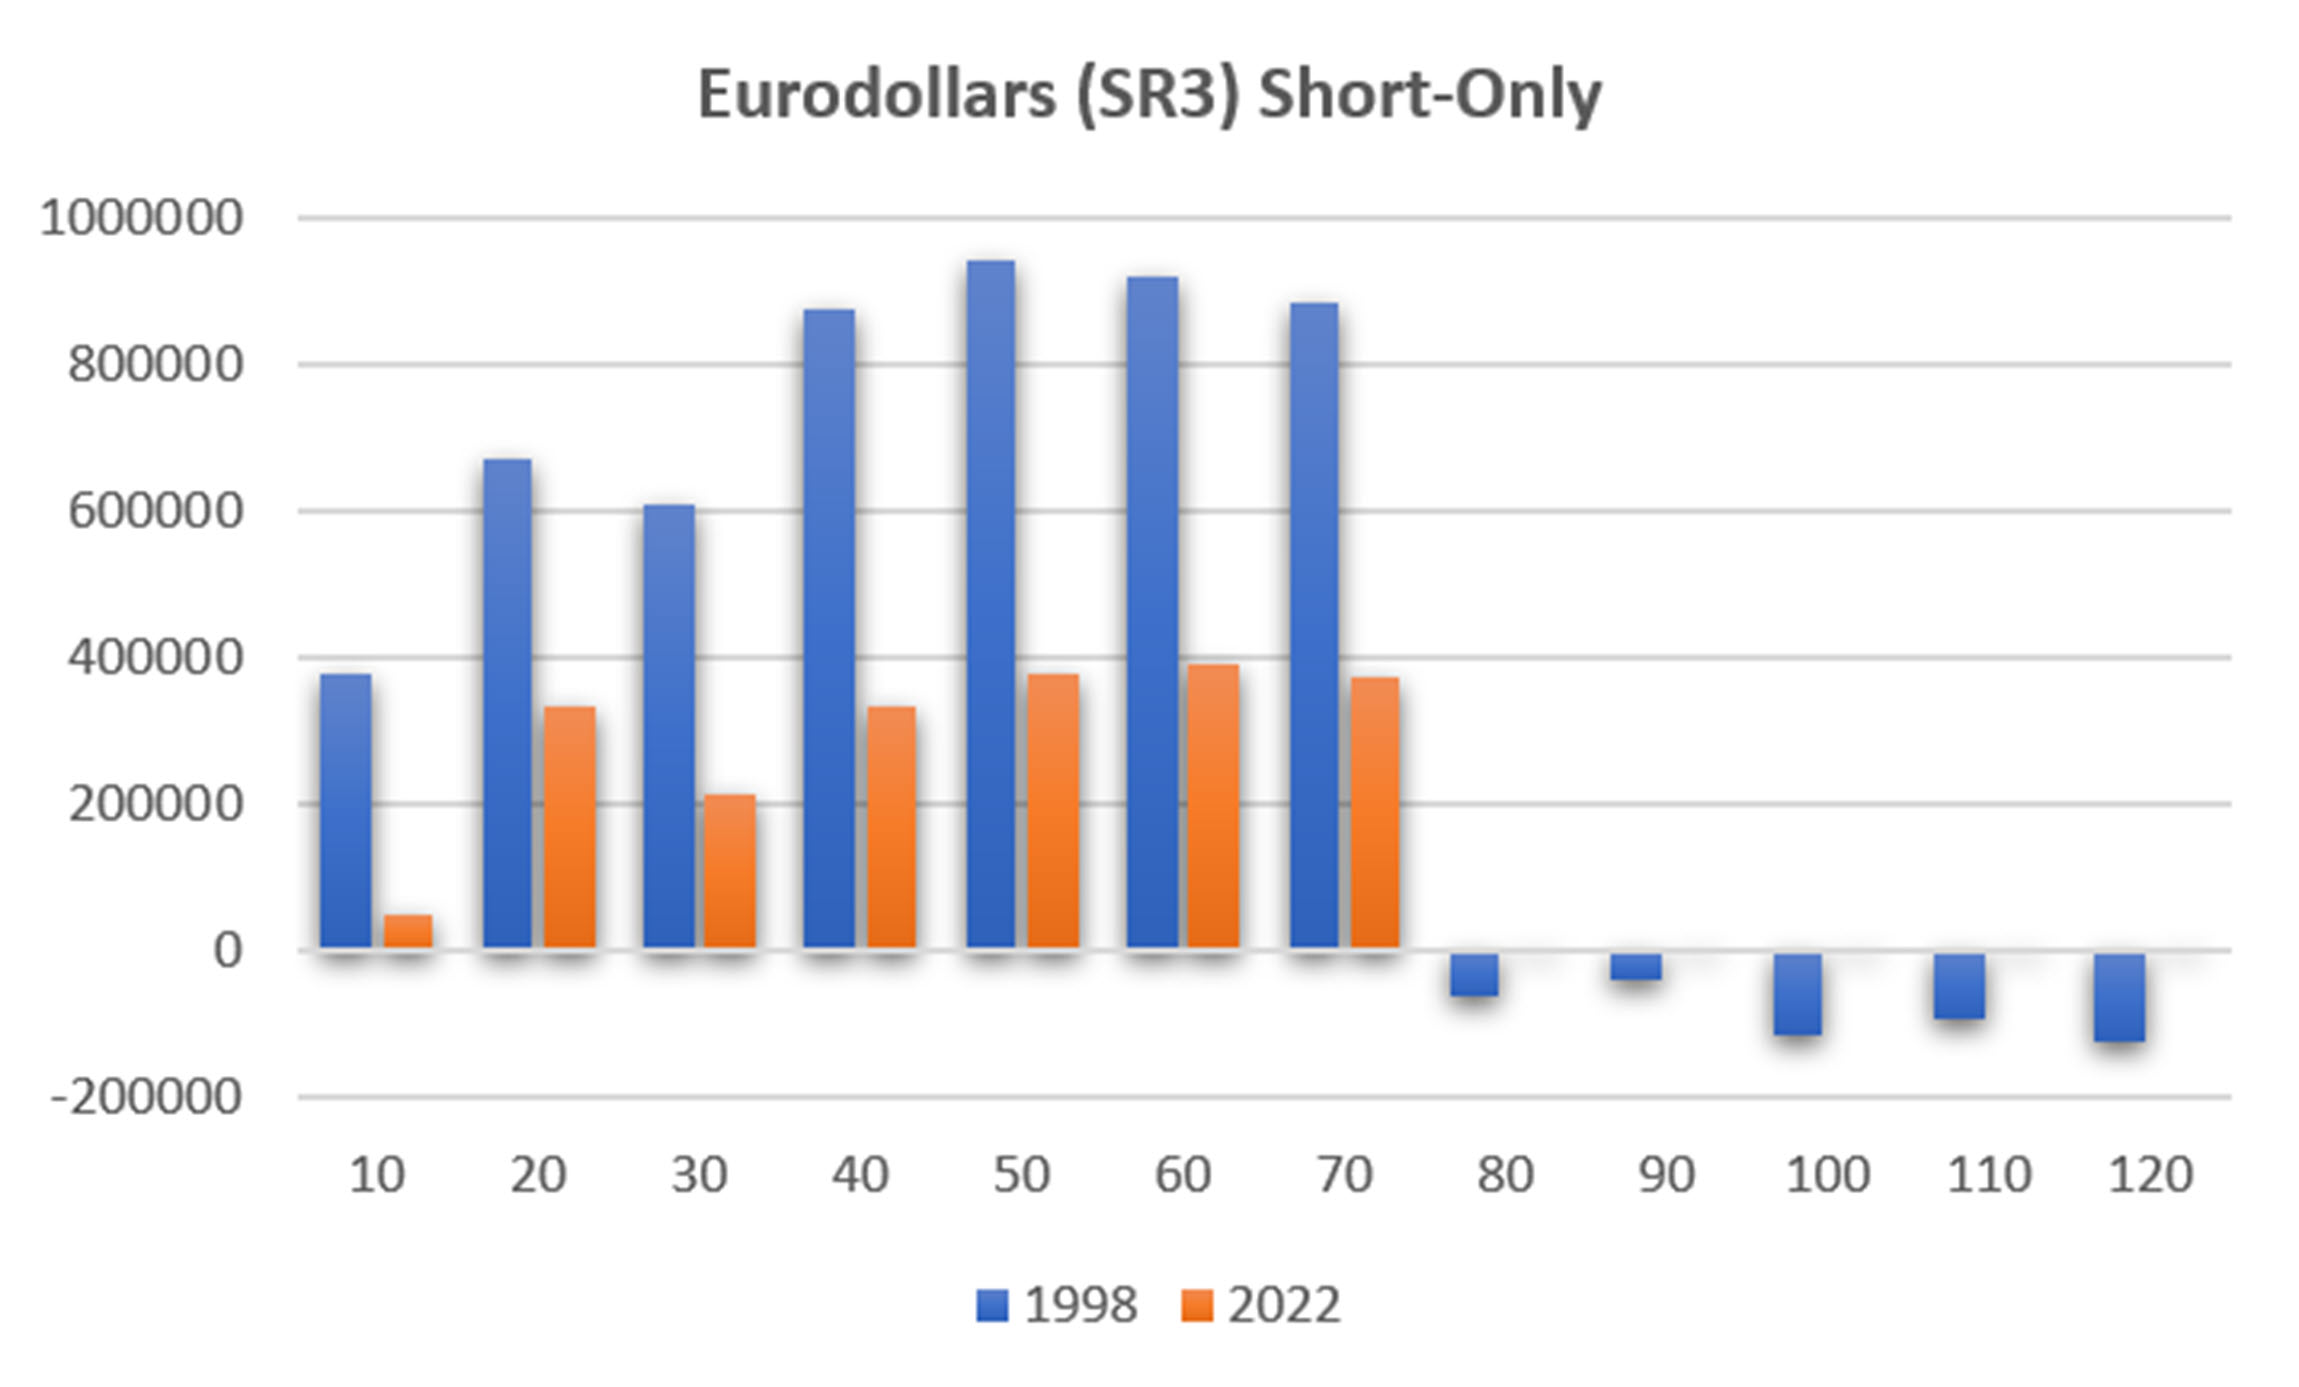
Chart 13. Test results for Eurodollar futures, short-only.
In choosing a trend period for Eurodollars, it seems that any period is profitable from 40-days and longer. That is the results of a highly-trending market. It is also the market that would have generated the greatest profits from 2022, offsetting losses in most other markets.
U.S. 20-Year Bond Futures
Are the long bonds performing the same as Eurodollars? Not at all. While Eurodollars, or any short-maturity rate will track Fed policy closely (the “Discount Window”), as the maturity increases, so does the speculation on where rates will be in the long term. I won’t show the long-short results because the results for 2022 are so small they don’t show on the chart. Instead, Chart 14 shows the long-only trend results for bond futures from 1998.

Chart 14. Trend tests for bond futures, long-only.
Clearly, results are consistently good for all trends, peaking at 80 and 90 days. If we isolate the short-only trades, shown in Chart 15, we can see on the left scale that the profits are tiny, the reason why they don’t show on the long-short chart. Any open trades are not shown.
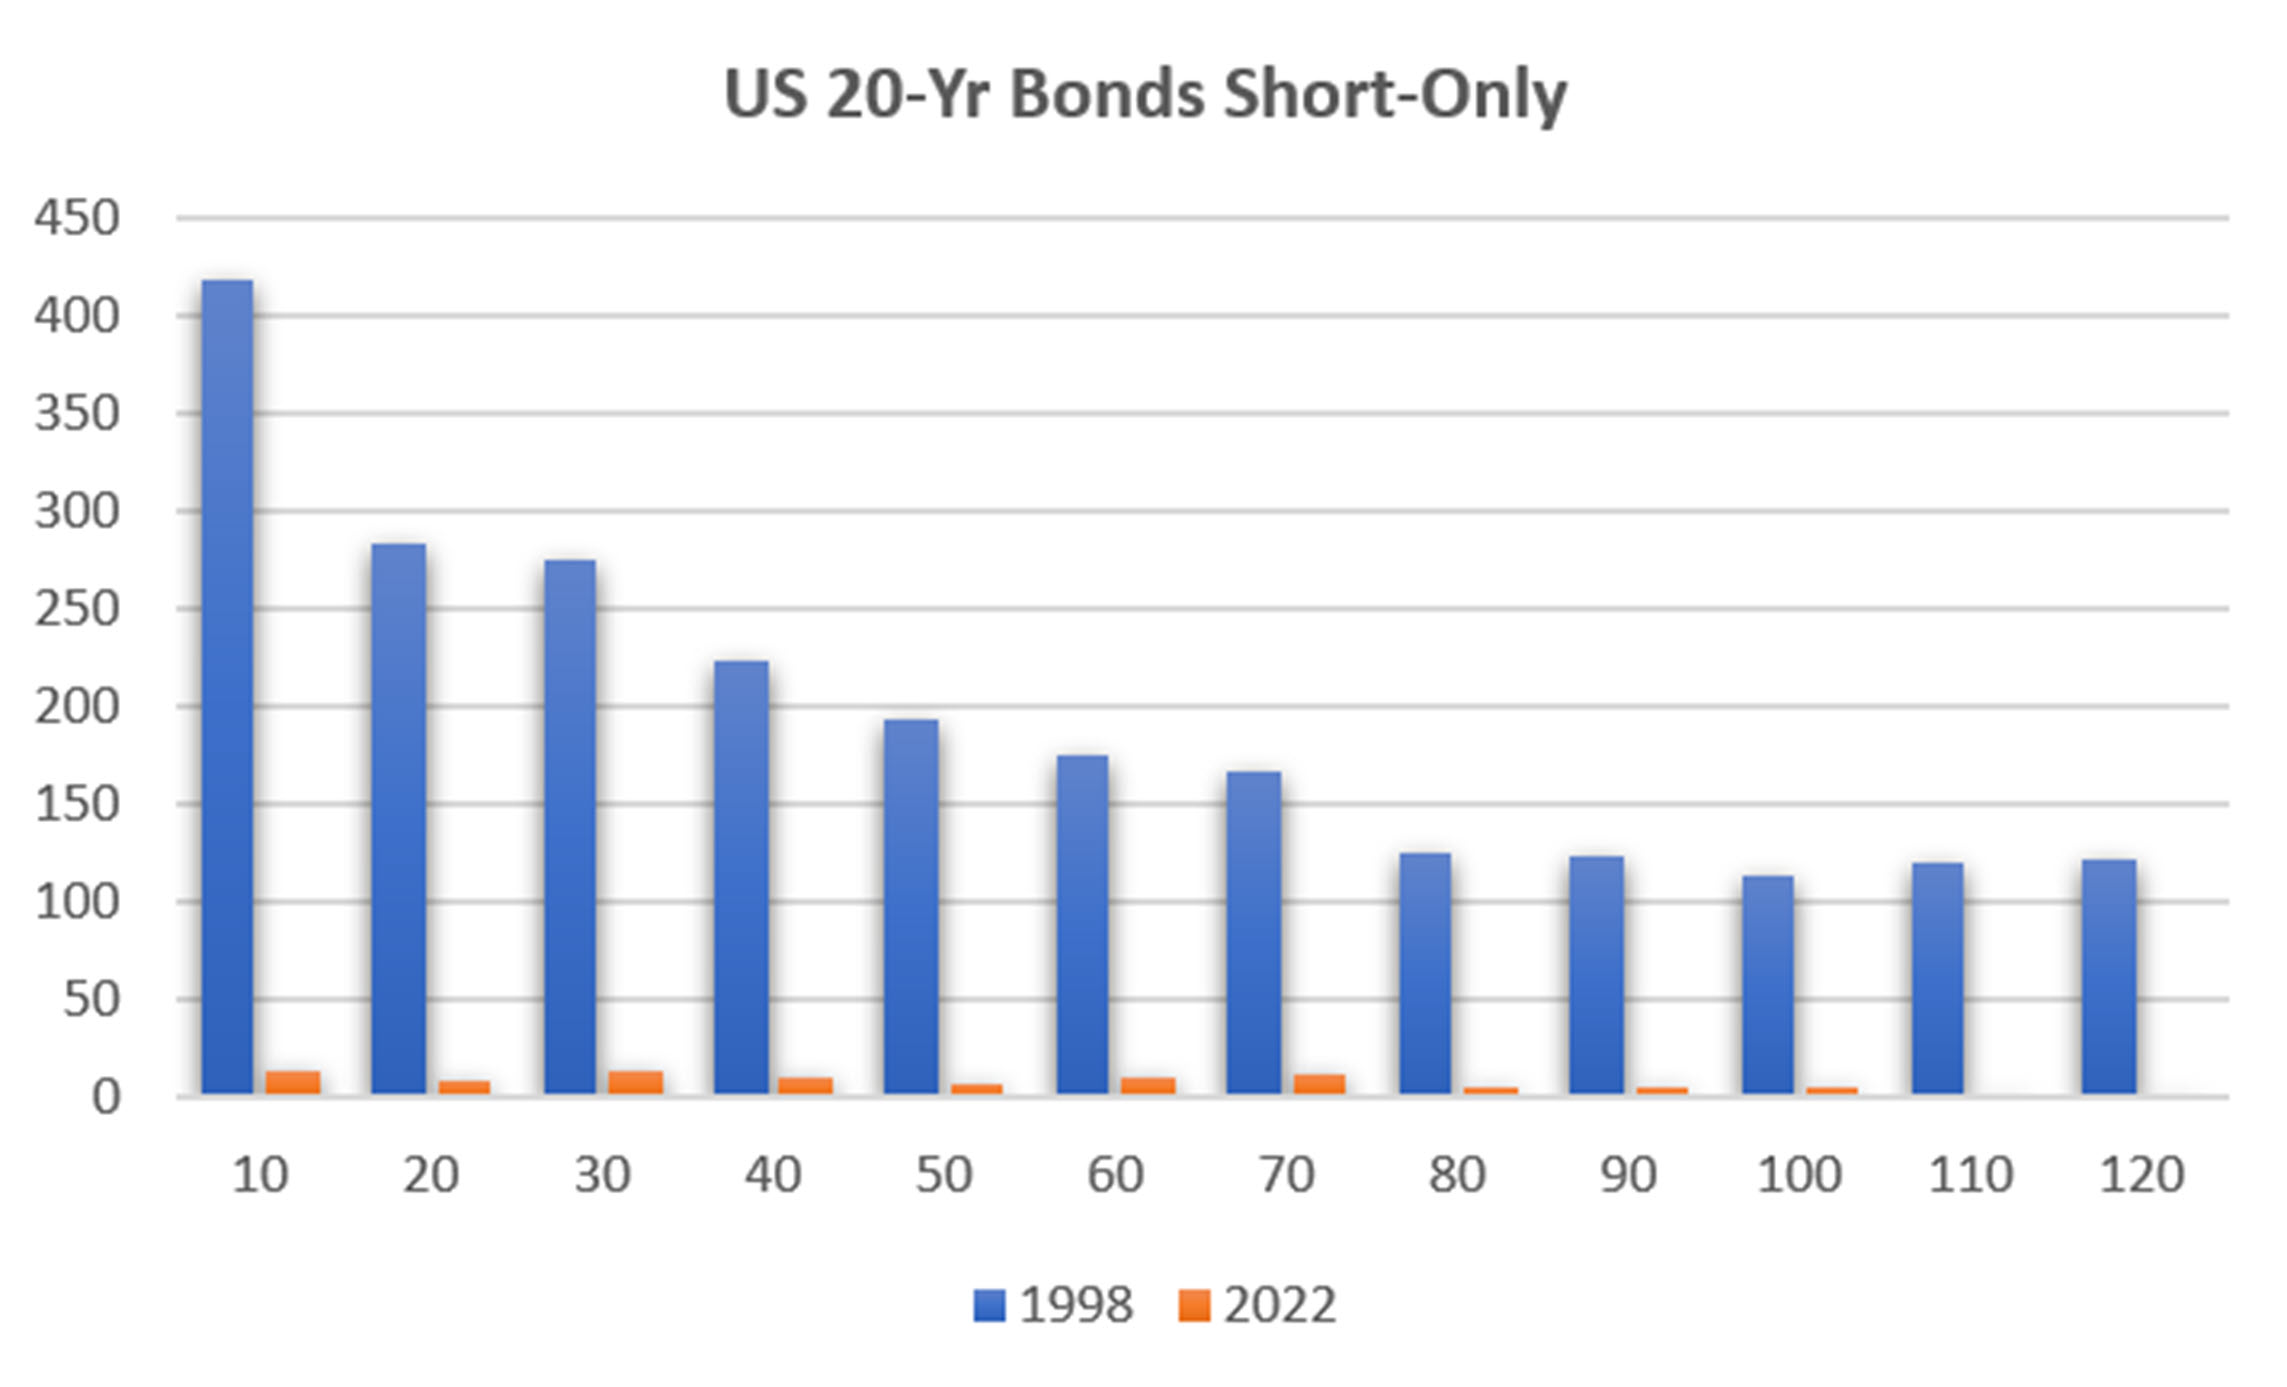
Chart 15. Test results for bond futures, short-only.
Short sales in bonds means rising interest rates, a situation that has rarely happened during the past 40 years. Even recently, the long bond has resisted higher rates, anticipating that the Fed will stop raising rates at any time. It has led to an inverted yield curve, with short-term rates offering higher returns than long-term rates.
Chart 15 shows more profits with faster trends, indicating that short sales are short-lived and it is best to capture profits quickly.
Summary
I’m sure that seems like a lot of comparisons when the result that only Eurodollars futures, and likely Euribor and short sterling, would be profitable in both the long-term (from 1998) and the short-term (from 2022). But you need to see it to believe it. Unfortunately, if we want a diversified portfolio, we can’t just trade Eurodollars, and the other markets that we showed have been very profitable before this recent period of high inflation and rising interest rates.
While it is possible to have switched from a long-term trend to a shorter one and captured profits, I personally would not have known when to switch. So I stay with the longer-term trends and accept some losses to offset years of gains.
I still believe in diversification, but it is clear that short-term interest rates futures should be part of a portfolio, if at all possible. Equity traders should look at ETFs that represent short-term rates, such as BIL, or floating rates, FLRN. They would have helped stabilize your results during the past year.
A Standing Note on Short Sales
Note that the “All Signals” reports show short sales in stocks and ETFs, even though short positions are not executed in the equity portfolios. Our work over the years shows that downturns in the stock market are most often short-lived and it is difficult to capture with a longer-term trend. The upwards bias also works against shorter-term systems unless using futures, which allows leverage. Our decision has been to take only long positions in equities and control the risk by exiting many of the portfolios when there is extreme volatility and/or an indication of a severe downturn.
PORTFOLIO METHODOLOGY IN BRIEF
Both equity and futures programs use the same basic portfolio technology. They all exploit the persistence of performance, that is, they seek those markets with good long-term and short-term returns on the specific system, rank them, then choose the best, subject to liquidity, an existing current signal, with limitations on how many can be chosen from each sector. If there are not enough stocks or futures markets that satisfy all the conditions, then the portfolio holds fewer assets. In general, these portfolios are high beta, showing higher returns and higher risk, but have had a history of consistently outperforming the broad market index in all traditional measures.
PERFORMANCE BY GROUP
NOTE that the charts show below represent performance “tracking,” that is, the oldest results since are simulated but the returns from 2013 are the systematic daily performance added day by day. Any changes to the strategies do not affect the past performance, unless noted. The system assumes 100% investment and stocks are executed on the open, futures on the close of the trading day following the signals. From time to time we make logic changes to the strategies and show how the new model performs.
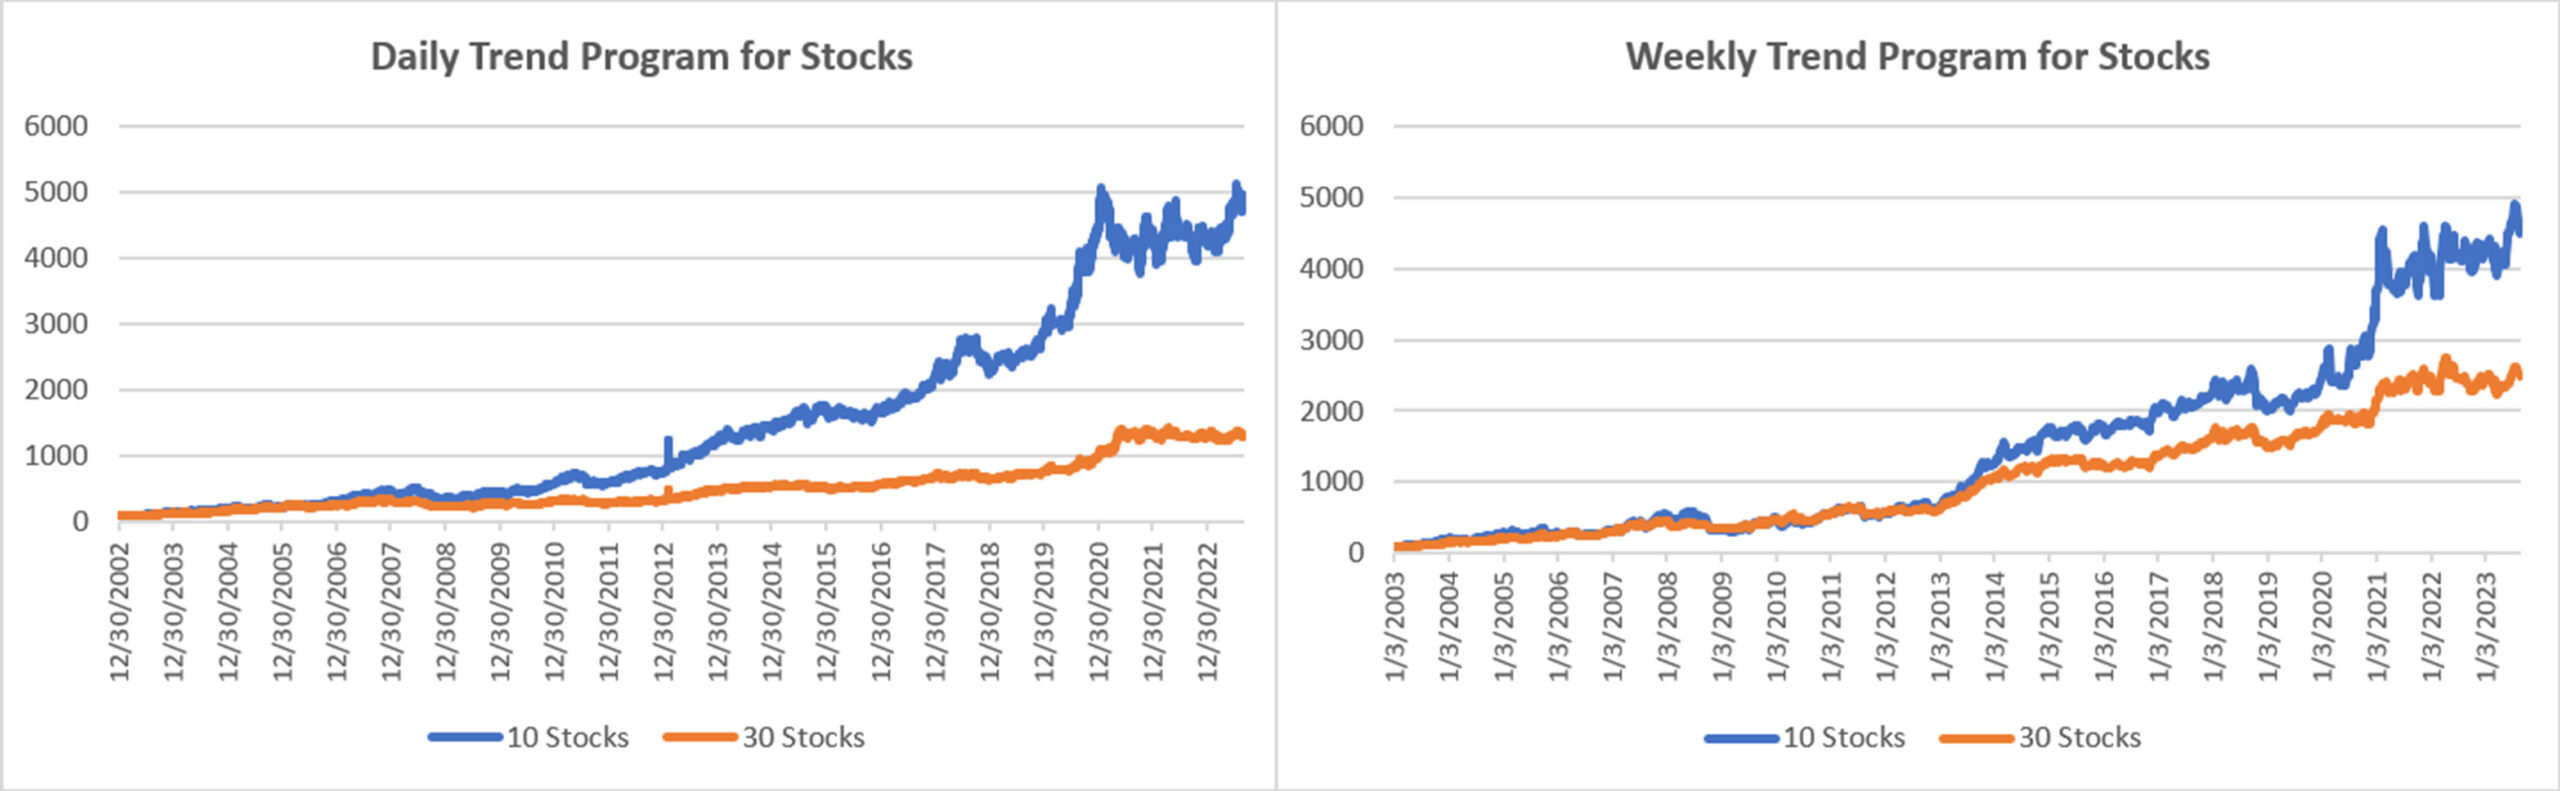
Groups DE1 and WE1: Daily and Weekly Trend Program for Stocks, including Income Focus, and DowHedge, and the new Sector Rotation
The Trend program seeks long-term directional changes in markets and the portfolios choose stocks that have realized profitable performance over many years combined with good short-term returns. It will hold fewer stocks when they do not meet our condition and exit the entire portfolio when there is extreme risk or a significant downturn.
Small losses in our benchmark 10-Stock Equity Trend program continues to track the S&P ETF closely, up substantially this year. The chart below looks promising, with new highs in July and just a modest backing-off in August. Investors continue to fight the Fed, pushing stocks higher in the face of possibly one more rate hike – but maybe not.
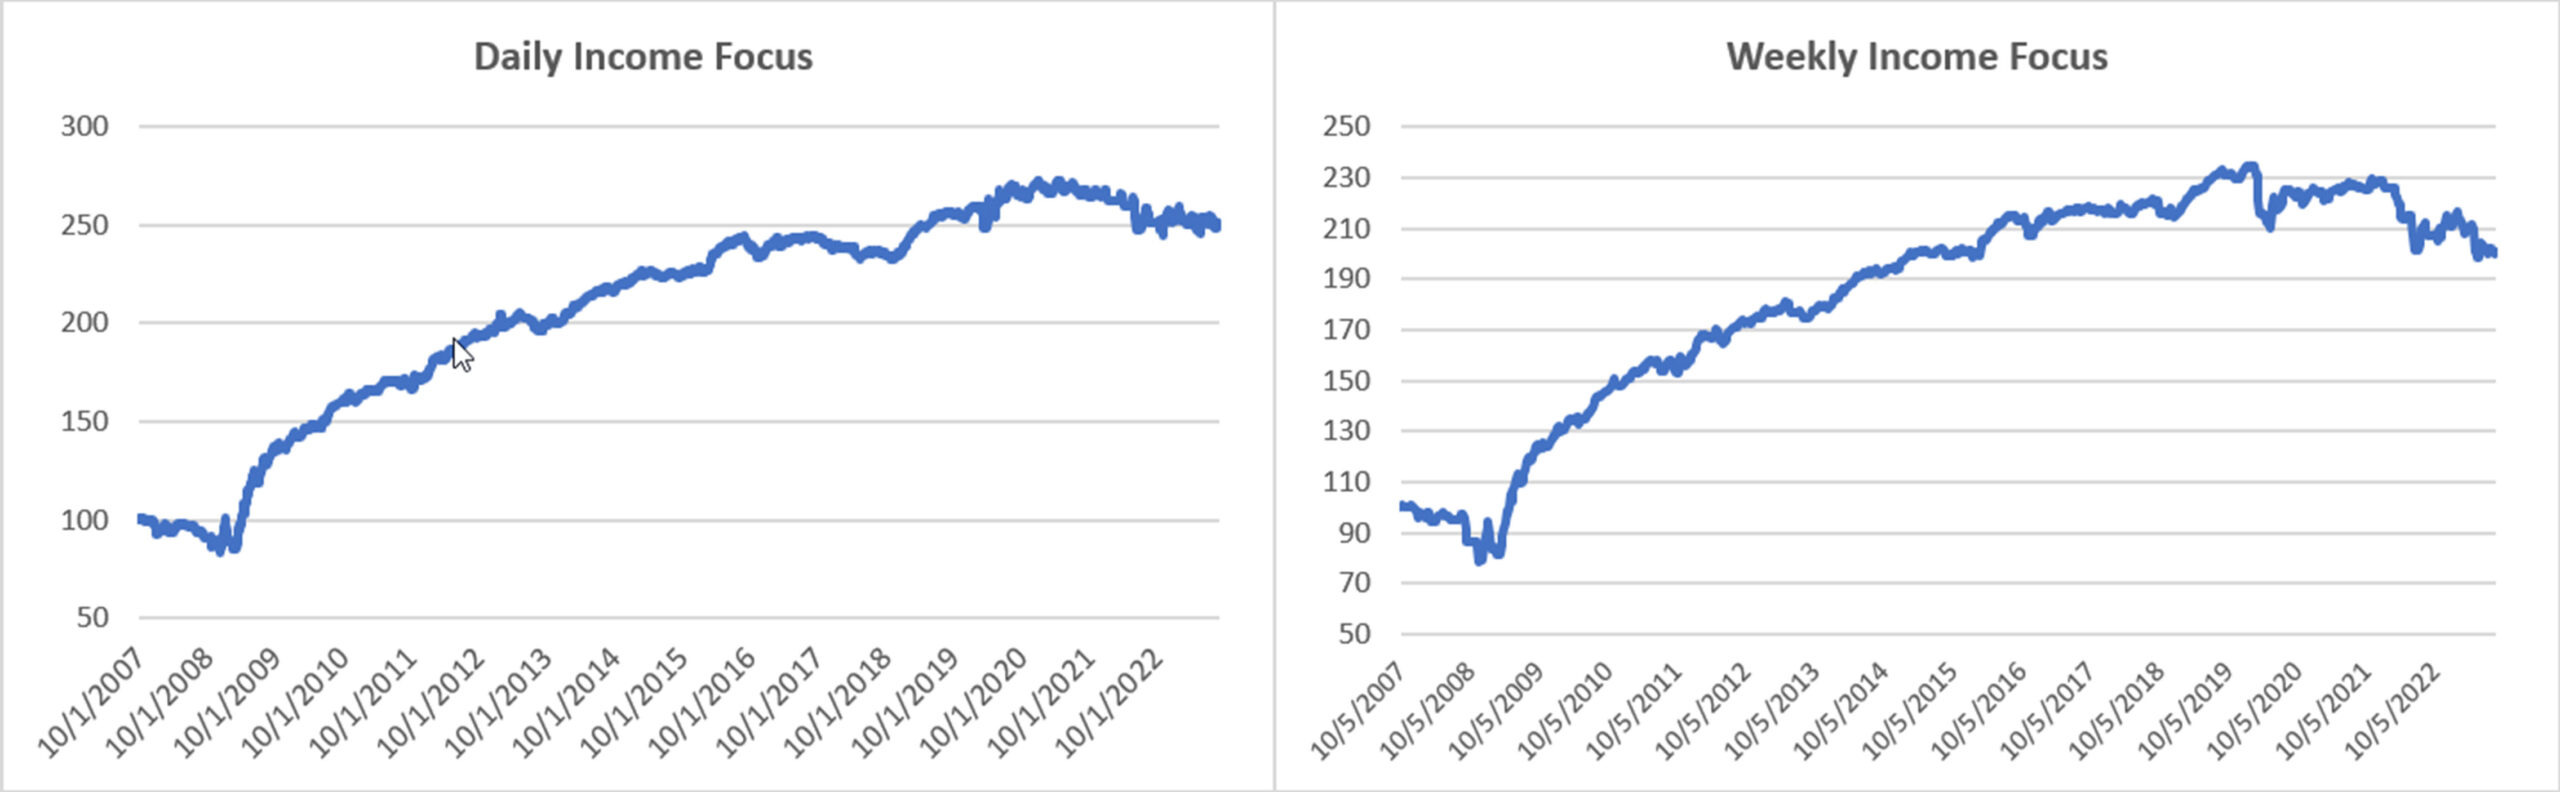
Income Focus and Sector Rotation
Note that the performance shown does not include dividends, which are an important part of the total returns. These results should be added to the dividend income to get the total return. Dividends increase the returns considerably and are the main objective for this strategy.
The chart below shows the difference between the price series for the Municipal Bond ETF with and without dividends for the period from January 1, 2023 through August 31, 2023, eight months. The returns including dividends have netted a gain of about 1% while without dividends there was a loss of nearly 1%. Then trading this program would have added up to 2% through August of this year based on how often the system was long the interest rate ETFs. Since 2007, the system would have been mostly long.

August posted small losses (without dividends) in both the daily and weekly Income Focus programs. The Daily version is essentially flat for the year while the Weekly program is off by almost 5%. In most years the two programs would be much the same because the interest rate ETFs that are traded have strong trends. However, this market is different, more volatile and erratic due to the uncertainty of Fed action. The Daily program has the advantage of responding faster.
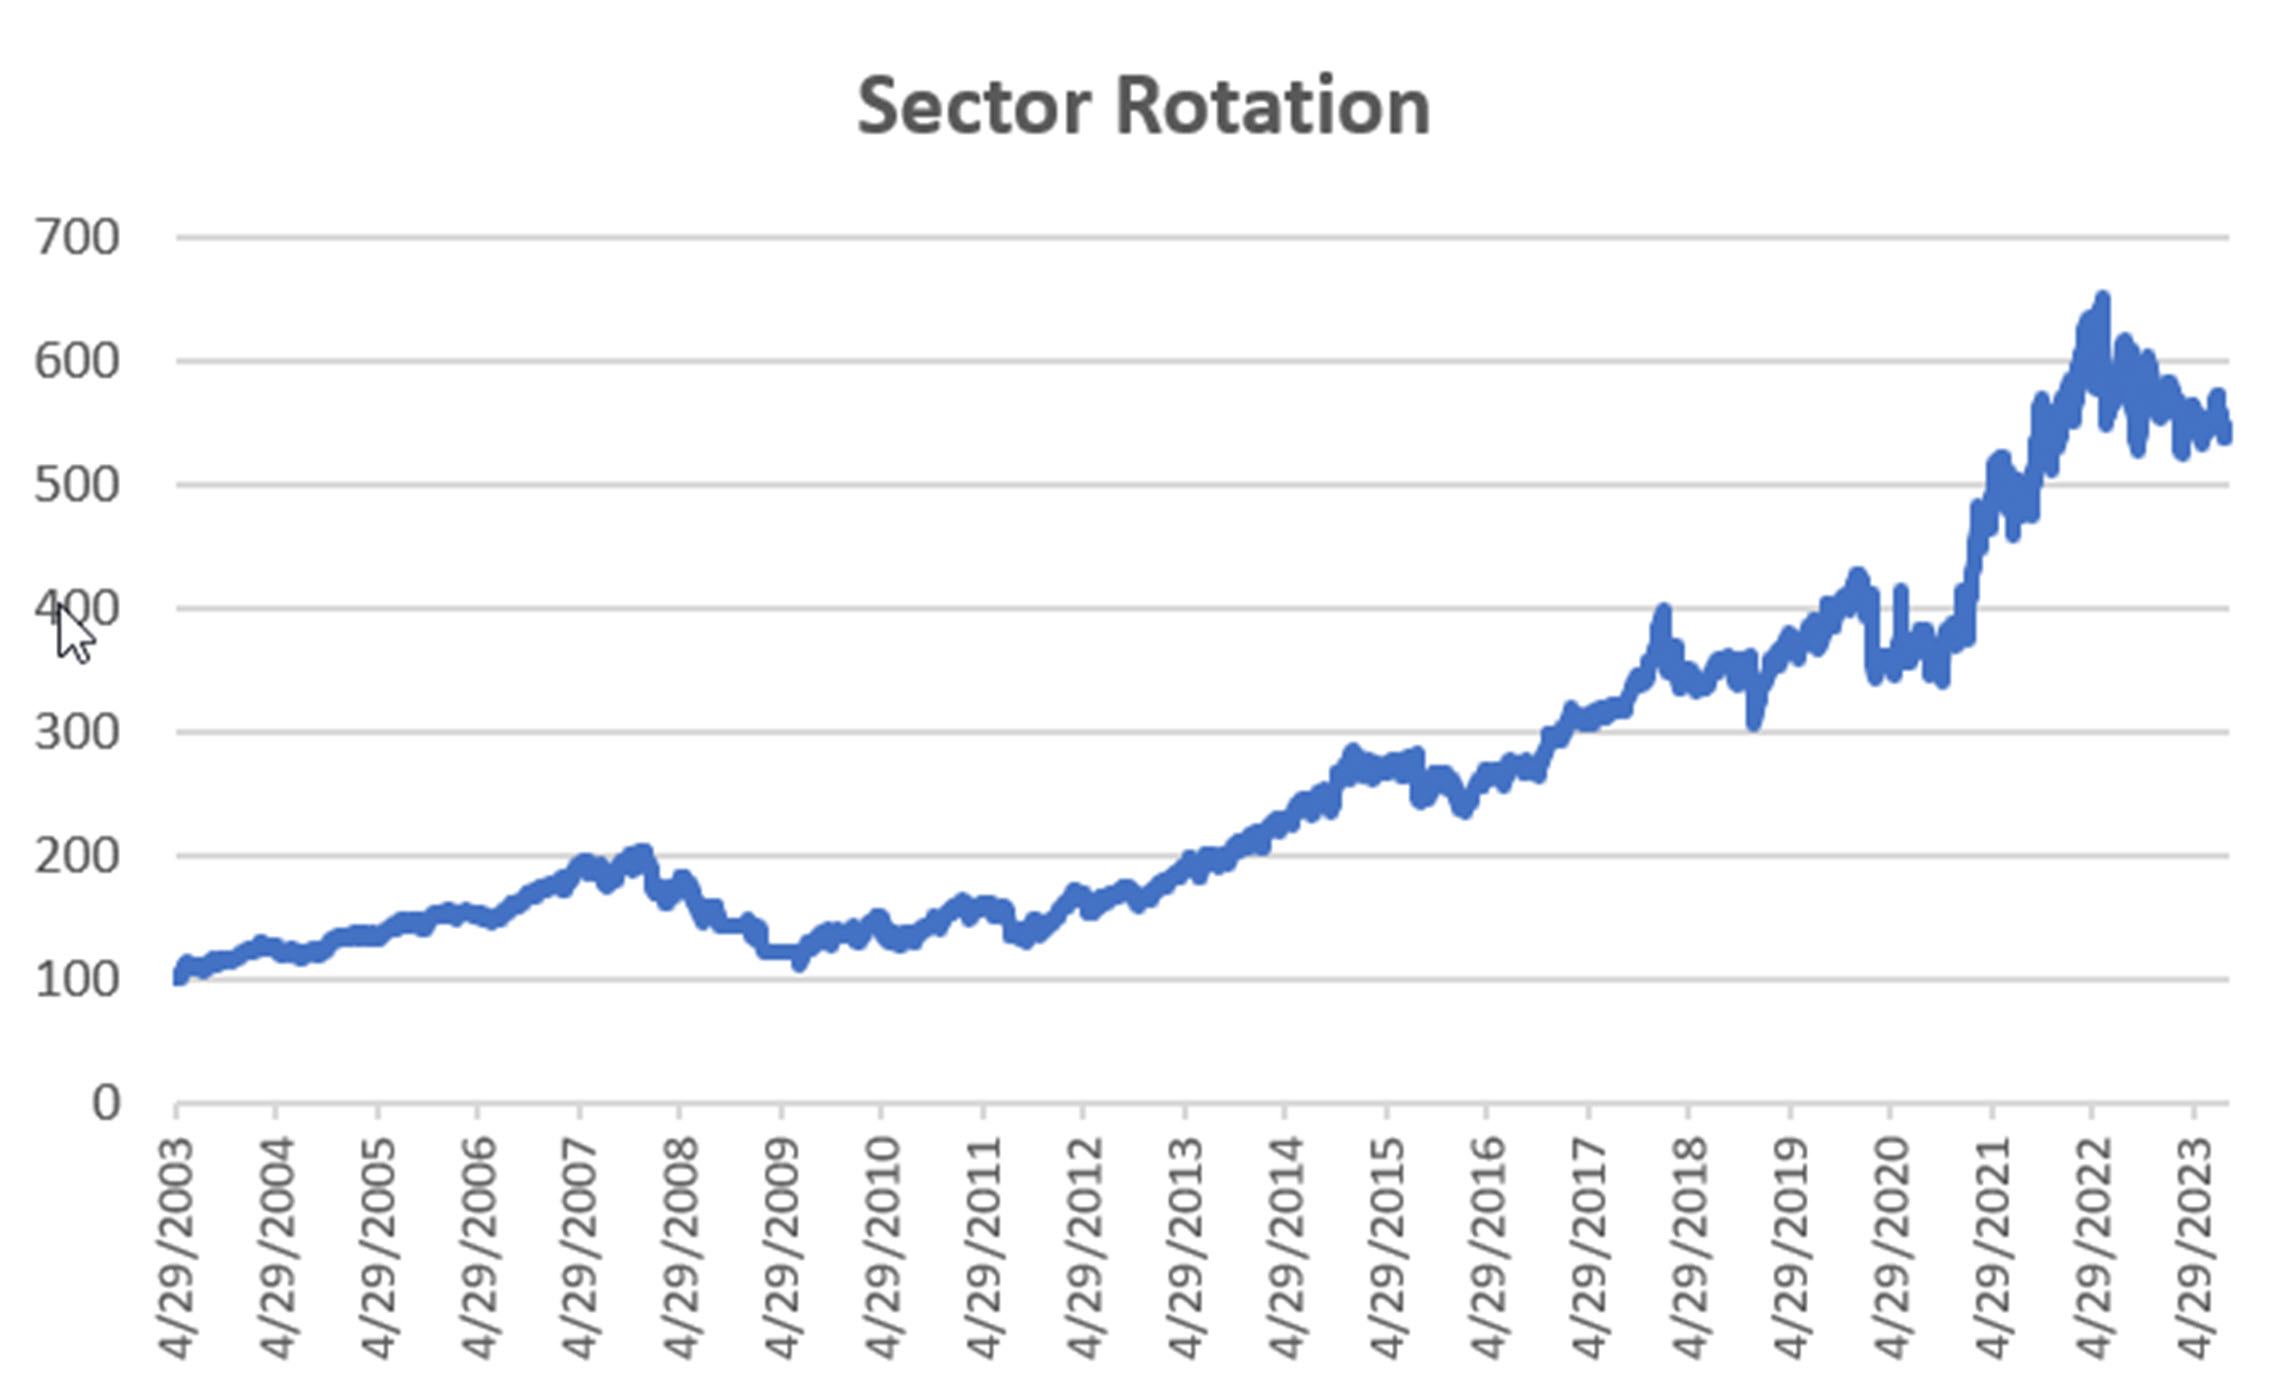
NEW Sector Rotation
A loss of nearly 4% takes away the gains for the year. The program has avoided technology and is now holding Materials, Energy, and Financials. While those are all promising, we are still waiting for the market to turn higher.
DowHedge Programs
A disappointing month for the DowHedge Program, but also disappointing for the Dow Index. The Daily program lost more than 5% and the Weekly more than 3%, but both held on to gains for the year —and the charts below could show new highs with little effort. As with the other programs, it all depends on the Fec.

Group DE2: Divergence Program for Stocks
The Divergence program looks for patterns where price and momentum diverge, then takes a position in anticipation of the pattern resolving itself in a predictable direction, often the way prices had moved before the period of uncertainty.
A common story this month, with both Daily and Weekly program posting losses but still showing gains for the year. Looking for a divergence pattern first requires a trend, which we haven’t seen for the past year.

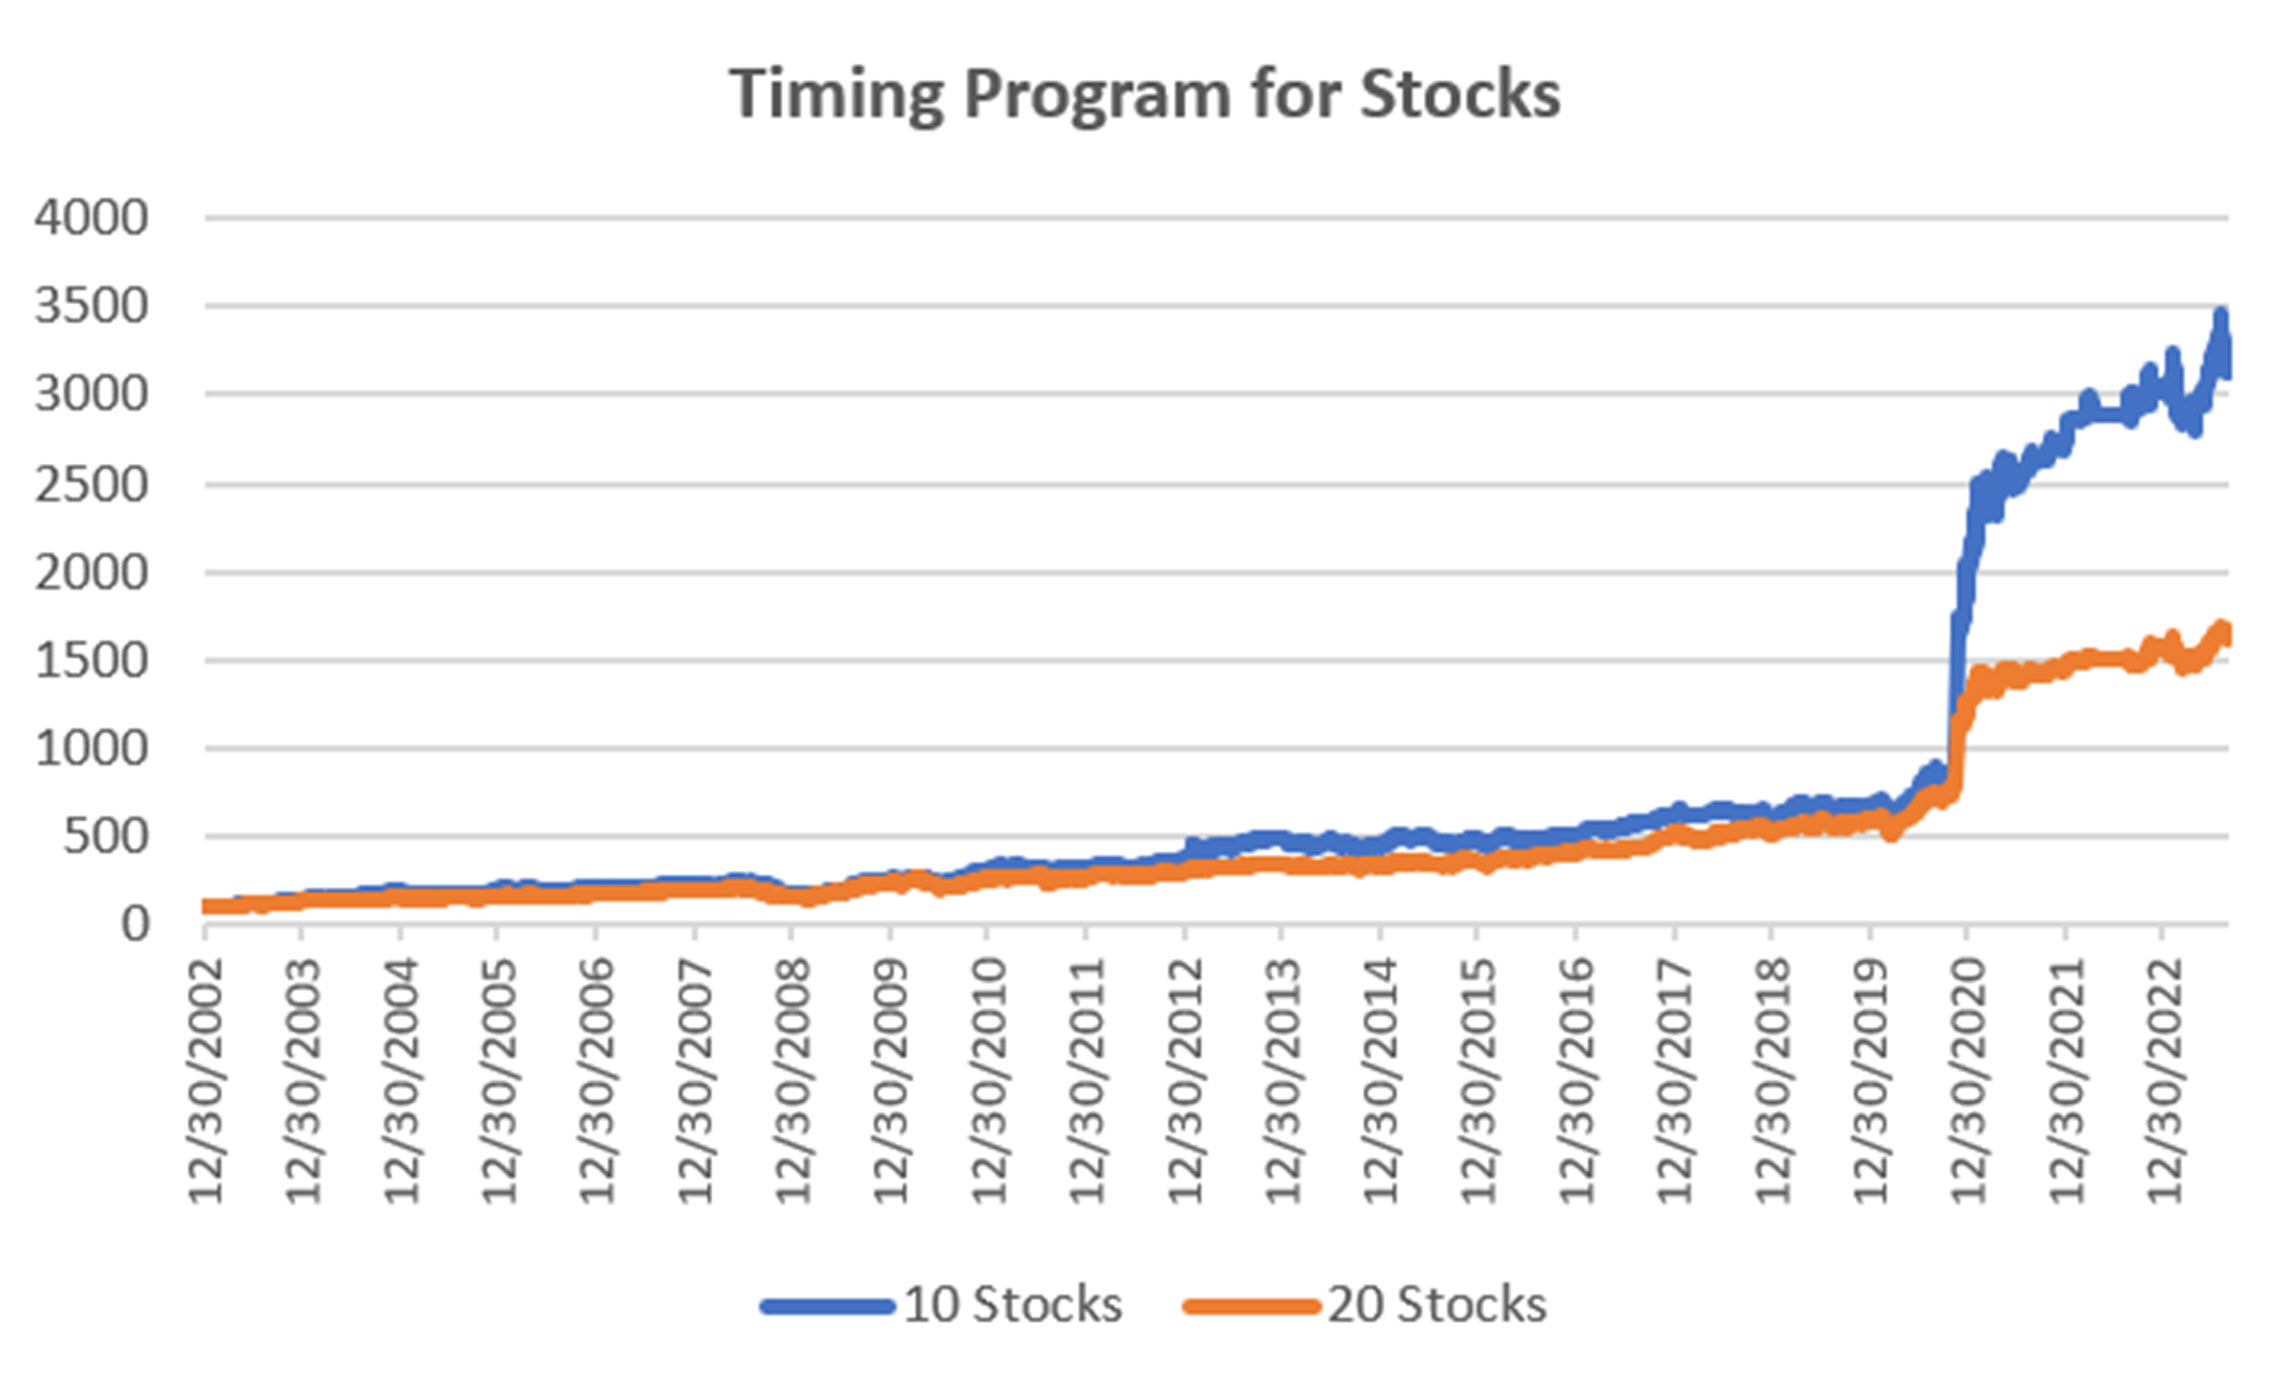
Group DE3: Timing Program for Stocks
The Timing program is a relative-value arbitrage, taking advantage of undervalued stocks relative to its index. It first finds the index that correlates best with a stock, then waits for an oversold indicator within an upwards trend. It exits when the stock price normalizes relative to the index, or the trend turns down. These portfolios are long-only because the upwards bias in stocks and that they are most often used in retirement accounts.
We need to go back through that past two months (actually all of 2023) to be sure we had recorded the daily returns correctly. When we switched to the new model, we kept recording the results of the old model. As it turns out, the new model has performed better, as we hoped.
The 10-Stock Timing Program took a nasty loss of 7% in August, mostly buying tech stocks on a pullback only to have them continue lower. It is still higher by almost 6% for the year. The 20-Stock program lost 2% and is ahead by 8%. It is difficult to avoid volatility, but the chart below still looks good.
Futures Programs
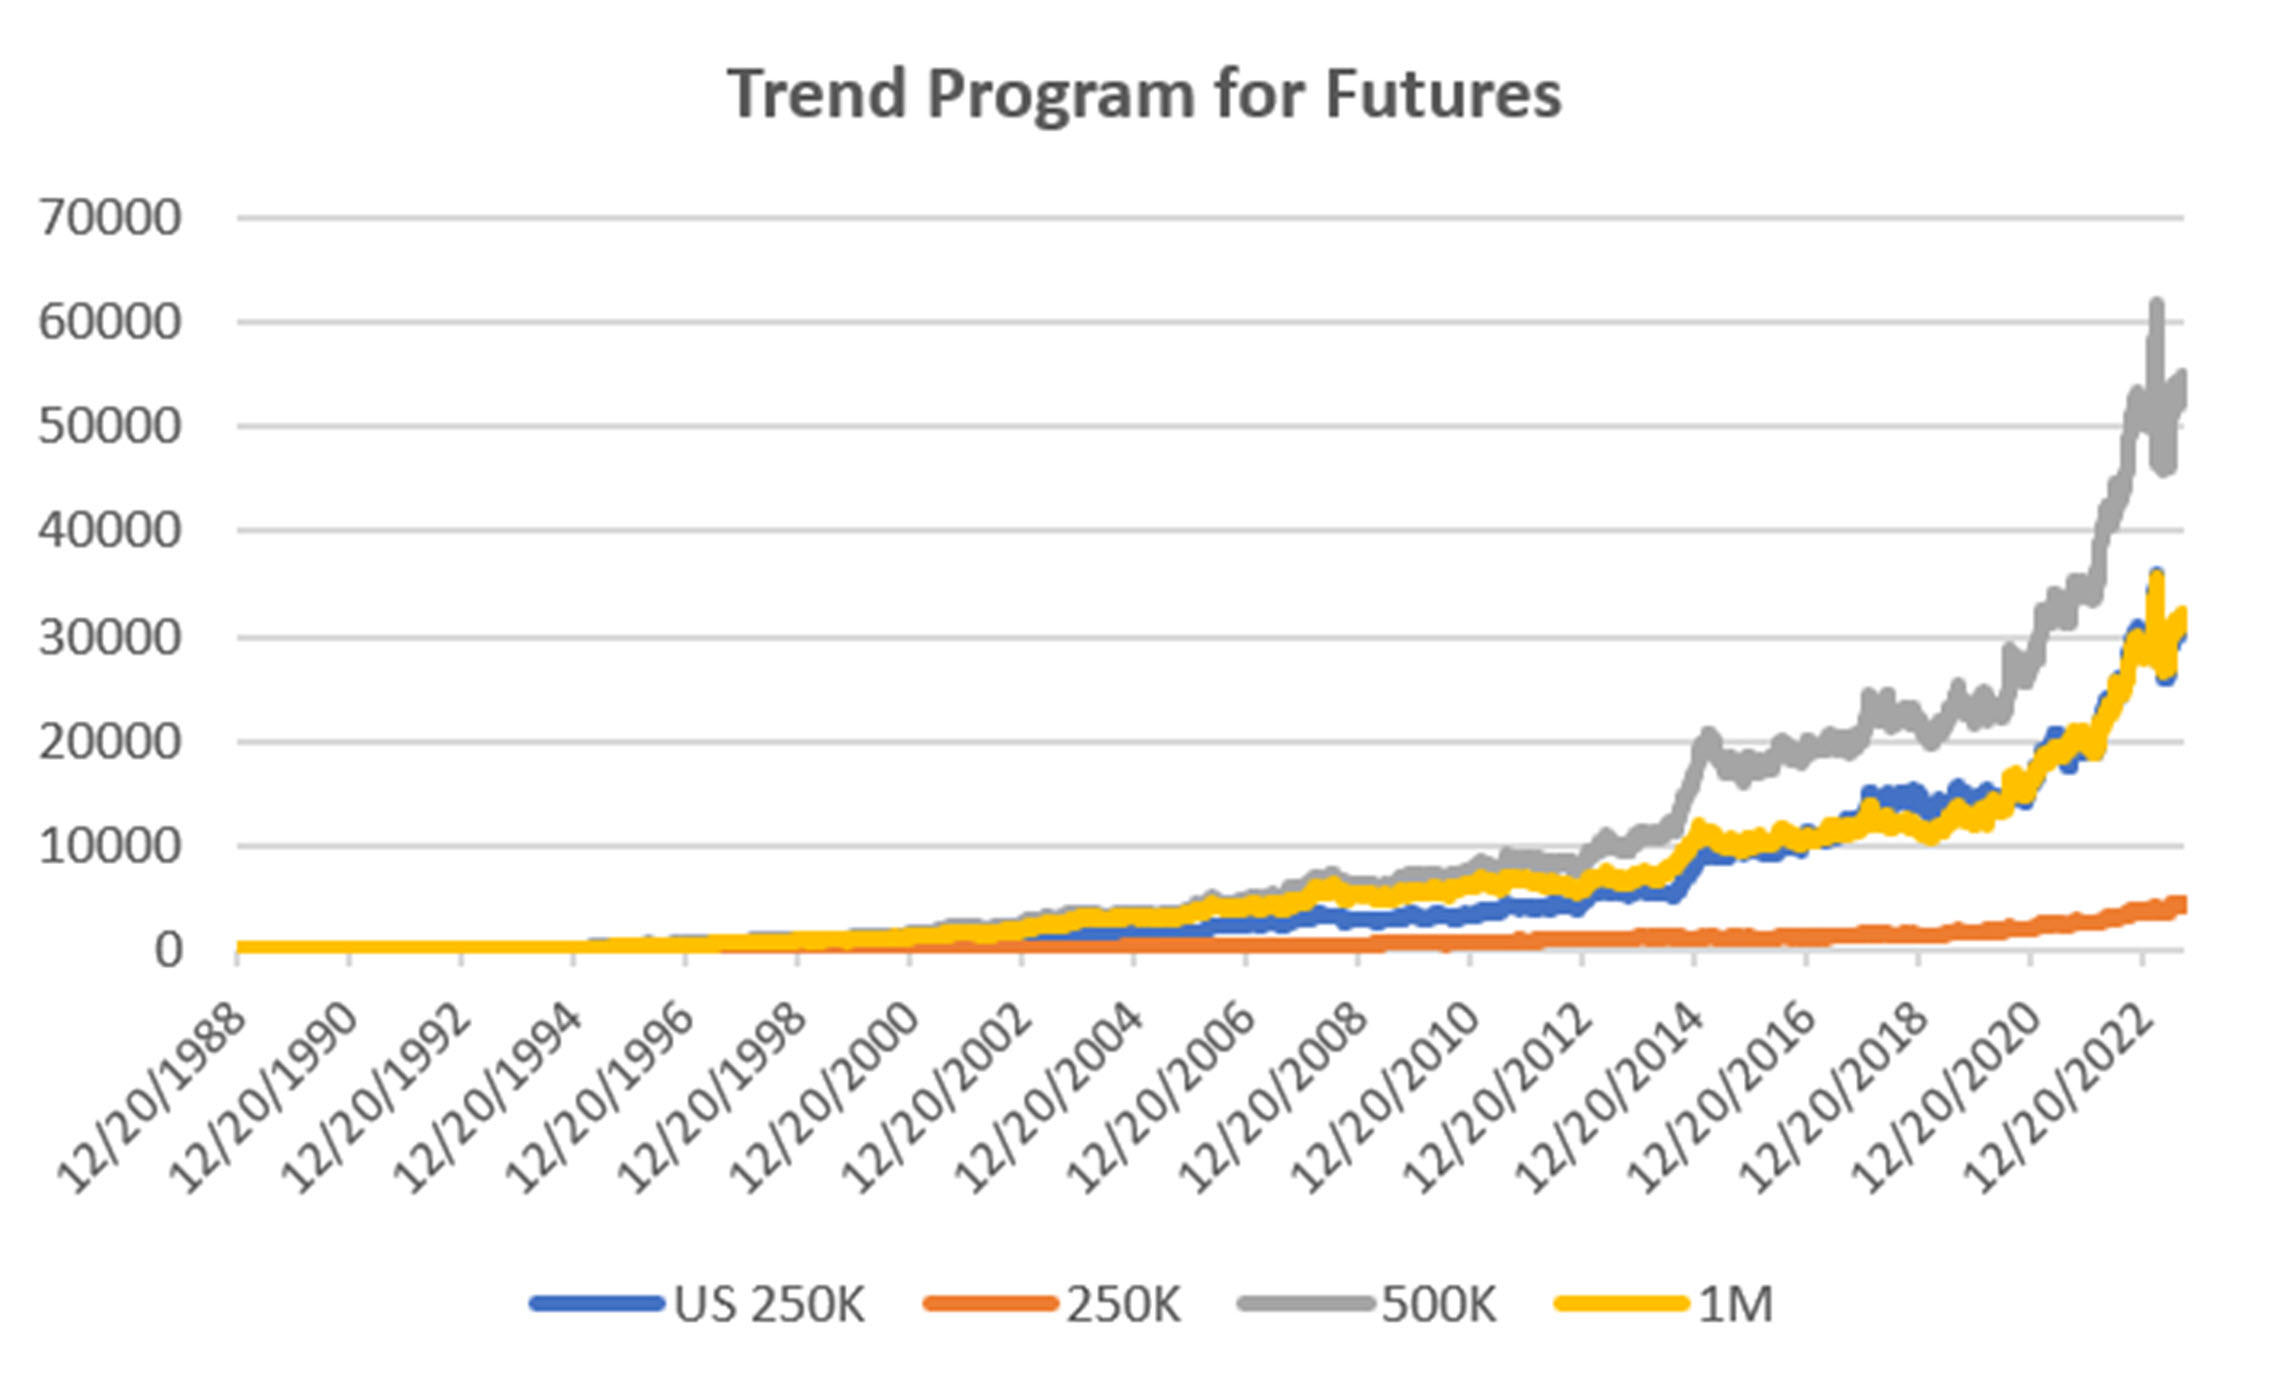
Groups DF1 and WF1: Daily and Weekly Trend Programs for Futures
Futures allow both high leverage and true diversification. The larger portfolios, such as $1million, are diversified into both commodities and world index and interest rate markets, in addition to foreign exchange. Its performance is not expected to track the U.S. stock market and is a hedge in every sense because it is uncorrelated. As the portfolio becomes more diversified its returns are more stable.
The leverage available in futures markets allows us to manage the risk in the portfolio, something not possible to the same degree with stocks. This portfolio targets 14% volatility. Investors interested in lower leverage can simply scale down all positions equally in proportion to their volatility preference. Note that these portfolios do not trade Asian futures, which we believe are more difficult for U.S. investors to execute. The “US 250K” portfolio trades only U.S. futures.
Fractional gains in all portfolios makes this program the bright spot for August. Performance was greatly dependent on the new 3-month Eurodollar contract, which seems to be declining in volatility towards the end of the month. It may be that we will see a long period of sideways interest rate movement if the Fed decides to hold rates “high for longer” even if it doesn’t raise rates. Many other markets reflect their dependence on interest rates.
Group DF2: Divergence Portfolio for Futures
A disappointing month for the Futures Divergence program, losing 5% to 6% and posted that same loss for the year. The only excuse is that this program needs a trend to then identify a pause in that trend. We have gotten neither of those.

Blogs and Recent Publications
Perry’s books are all available on Amazon or through our website, www.kaufmansignals.com.
July 2023
Two(!) new articles by Perry in the August issue of Technical Analysis of Stocks & Commodities. The first is a look at how ChatGPT might help traders. It even asks for a computer program to use trend following.
The second article is “Portfolio Risk Dilemma,” where Perry answers the question of whether to let a stock or futures profit run or rebalance, and whether you should do the same for a diversified portfolio.
June 2023
Another article in Technical Analysis, “Protecting Your Wealth While Making a Profit.” It shows that moving money into different world equity markets can take advantage of momentum in both price and exchange rates.
May 2023
A new post on Seeking Alpha, “Profiting From Green Energy – But Not EVs” on May 31. Shows which stocks are best for investing in energy given the moving targets.
April 2023
On April 18th, Perry gave a webinar to the Society of Technical Analysts (London) on how to develop and test a successful trading system. Check their website for more details, https://www.technicalanalysts.com..
The April issue of Technical Analysis of Stocks & Commodities published a new article by Perry, “Repatriation,” an interesting trading pattern used by FX traders but adapted for us “normal traders.”
March 2023
Perry was interviewed by Mark Ursell of Ursell of TradeInform on March 3. You can see it or listen to it on UTube https://www.youtube.com/watch?v=9gIlIIzngCk. Or, you can listen to it at
A new article by Perry, “Can Volume Predict Price?” in the March issue of Technical Analysis of Stocks & Commodities. You’ll need to read it to find out!
February 2023
The February 2023 issue of Technical Analysis of Stocks & Commodities published Perry’s article, “Do Small Price Changes Matter?” It tells you whether you should be ignoring those days when prices close up or down by a fraction.
Perry gave a webinar to Eduardo Lopez’ Robotrader students in Spain on Wednesday, February 8, noon (New York).
January 2023
Another year! Technical Analysis of Stocks & Commodities published “Matching the Markets to the Strategy” in the January issue. It is a look at why certain markets do best with specific strategies and why that can materially improve results.
Alejandro de Luis will publish Perry’s article “Living Off Profits,” translated into Spanish, in the January issue of his magazine, Hispatrading. It’s a good way to practice your Spanish!
Seeking Alpha posted Perry’s article, “How To Hedge Your Equity Portfolio,” showing a way to follow the Fed action.
October 2022
An interview with Perry was featured in the October anniversary issue of Technical Analysis of Stocks & Commodities. The interviewer is his wife, Barbara Diamond, giving a different perspective on his career.
September 2022
“The Real Risk of System Trading” can be found in the September issue of Technical Analysis of Stocks & Commodities. It summarizes the many way we can measure risk and suggests ways that will help you.
Older Items of Interest
Perry’s webinar on risk, given to the U.K. Society of Technical Analysts, can be seen using the following link: https://vimeo.com/708691362/04c8fb70ea
For older articles please scan the websites for Technical Analysis of Stocks & Commodities, Modern Trader, Seeking Alpha, ProActive Advisor Magazine, and Forbes. You will also find recorded presentations given by Mr. Kaufman at BetterSystemTrader.com, TalkingTrading.com, FXCM.com, systemtrade.pl, the website for Alex Gerchik, Michael Covel’s website, TrendFollowing.com, and Talking Trading.com.
In May 2021, Mr. Kaufman gave a 30-minute presentation, “Lagged Trends,” for The Money Show on Tuesday, May 11. You can see it using the following link: https://youtu.be/bh2fA8oBwBk
You will also find back copies of our “Close-Up” reports on our website, www.kaufmansignals.com. You can address any questions to perry@kaufmansignalsdaily.com.
© August 2023, Etna Publishing, LLC. All Rights Reserved.