

For updated performance of any program, go to the Performance Reports tab at the top of the screen.
DIVERGENCE is a well-known concept that recognizes when two related markets are moving away from each other. We often see this in the major index markets, the S&P and NASDAQ, or in related stocks such as the semiconductor manufacturers Micron, Intel, and NVDIA or even retailers such as Walmart and Target.
Our method is called technical divergence, and it occurs when the price moves higher, but a momentum indicator moves lower or when the opposite pattern happens. “Momentum falling” means that prices are moving higher at a slower rate, which most often predicts change. Chart 1 gives three examples of technical divergence (using our own formula), one occurs with prices rising and momentum falling (in the center), and two occurs with prices falling and momentum rising. This pattern is followed by prices moving in the direction of momentum. However, our strategy looks at this differently.
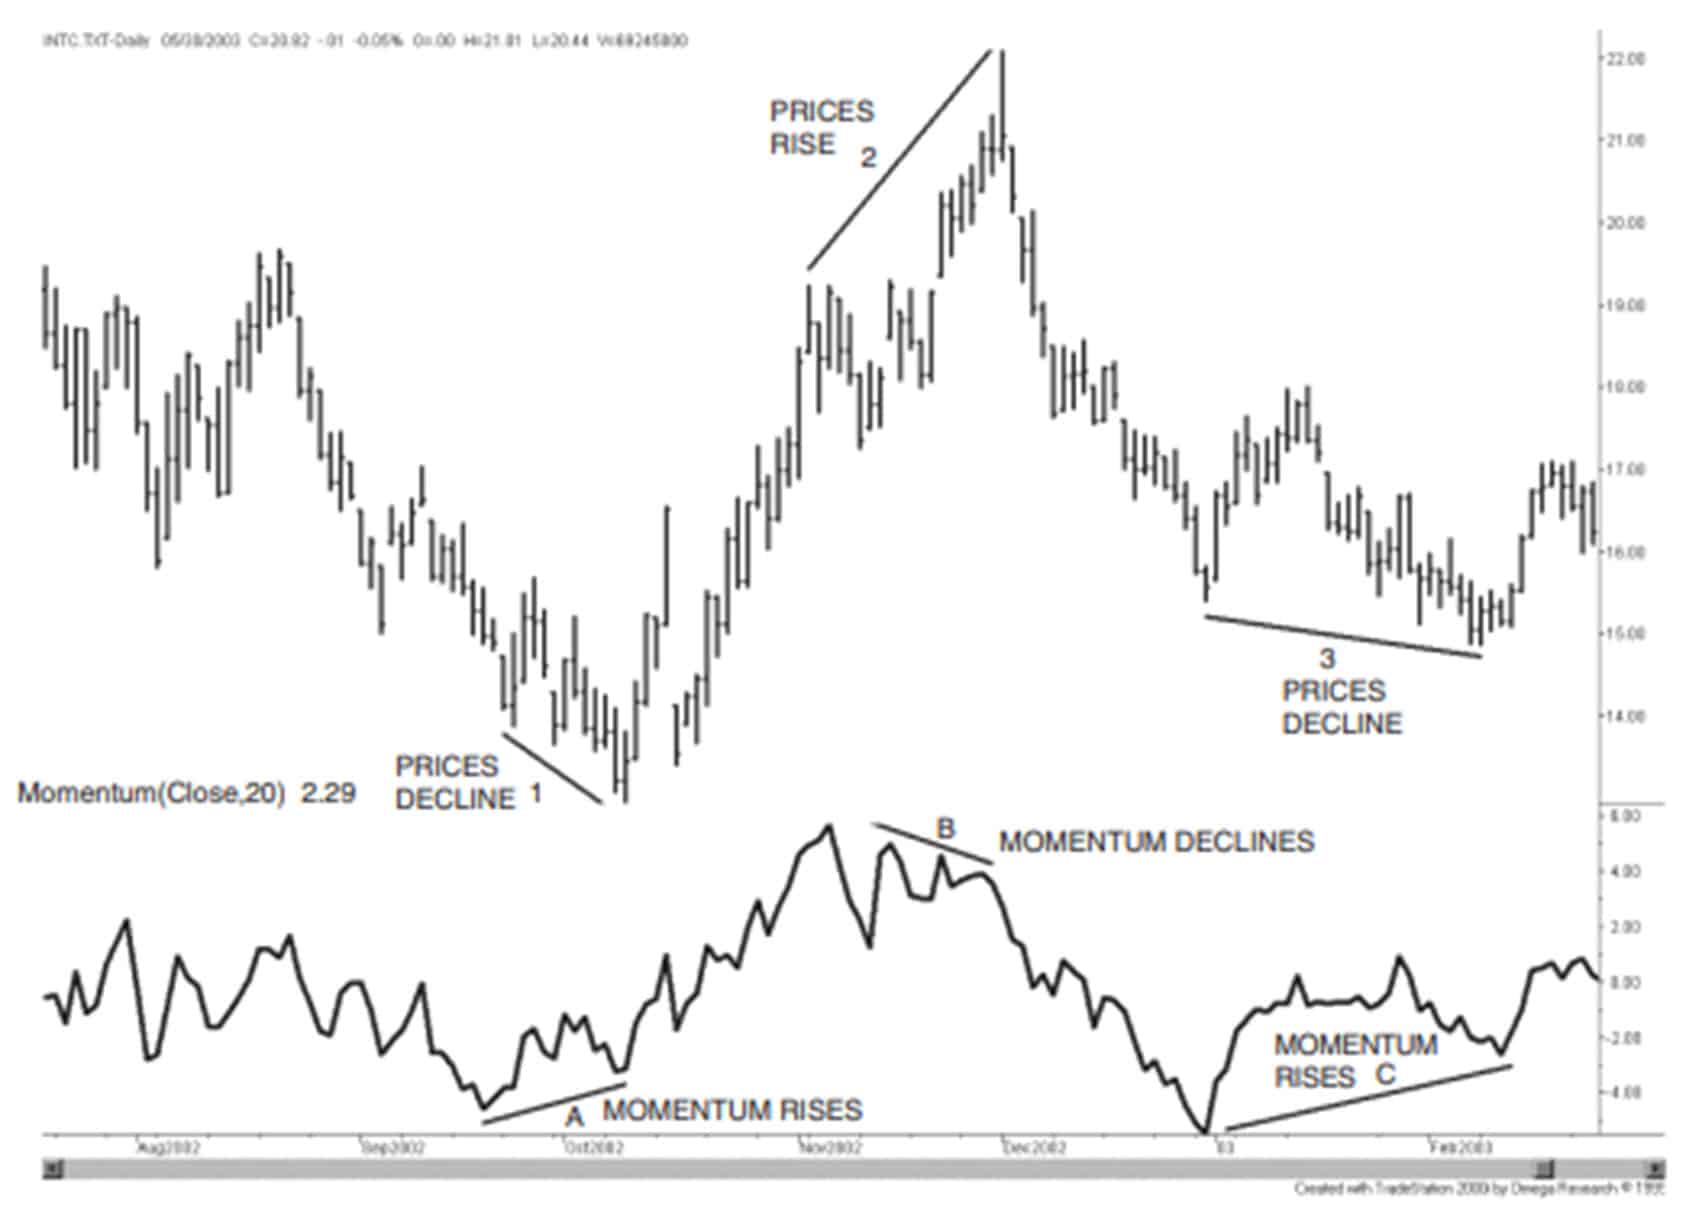
Chart 1. Divergence example, from Kaufman, Trading Systems and Methods, 6th Edition, p 378.
We can always find a few examples that support what we want to promote. But that is not the same as consistency. We see divergence as a pause in the trend, an opportunity to enter a trend position at a better price. Because the trend is so important, most divergence patterns are resolved by prices going back in the direction of the trend. It is similar to a wedge or triangle within a trend for chartists. They are expected to breakout in the continued direction of the trend. In the example above, we cannot see the major trend. We can be fooled by one example.
Performance Characteristics of Our Divergence Strategy
- This is a short-term strategy, holding a position for an average of 5 to 8 days.
- It has a low correlation to trend-following because it is taking positions either opposite to the direction of the trend, or at a time when prices are moving sideways.
- It has a high likelihood of success on individual trades.
- Profits per trade are smaller than trend-following because trades are held for less time.
- It works for stocks and futures using the same rules and parameter specifications.
Position Size and Compounding
All equity positions are sized by dividing the portfolio investment by the number of stocks, then dividing that allocation by the closing price on the day before the entry order.
For example, the 10-stock portfolio has a nominal investment of $100,000. Divided by 10, that gives each stock an allocation of $10,000. Divide that by the stock's closing price, and you have the position size.
This method tries to equalize the risk of each stock. It is not perfect, but it serves the purpose and is much easier than true risk parity. To remove the greatest imbalance and improve liquidity, we do not trade stocks priced under $10.
As your investment increases, each new trade will have a size based on 1/10 of your current equity. That will allow for compounding, which is necessary if you are going to get the same returns that we post in our performance report.
You can reduce the portfolio size by allocating $5,000 per stock or less, but commission costs will have a greater impact on your returns. Our performance reflects a charge of $8 per trade, but a lower fee will significantly improve the returns. We have found that it’s best to commit at least $7,500 to each stock.
Stock Performance
We offer two portfolios for the Equity Divergence program, ten stocks and 30 stocks. The table below shows that 2022 was not a good year for this strategy because there were only false trends to the upside, and we only take long positions. Most of the year saw stock prices decline. Still, SPY declined a similar amount, and QQQ declined over 32%. This program will offer diversification and good returns as seen in the longer-term chart below.
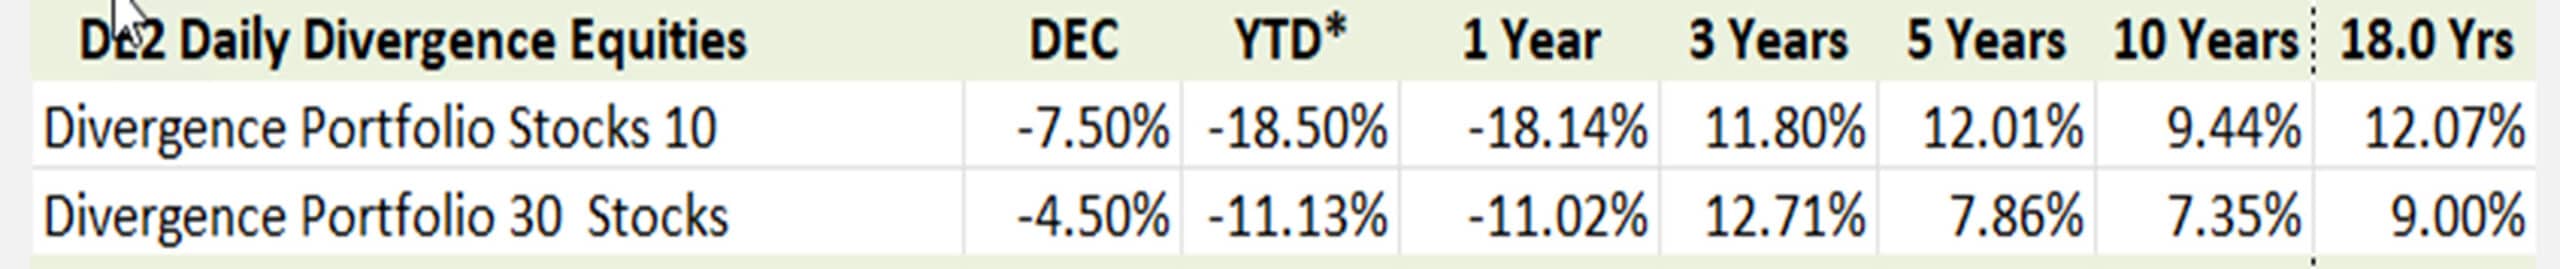
Equity Divergence performance ending December 2022.
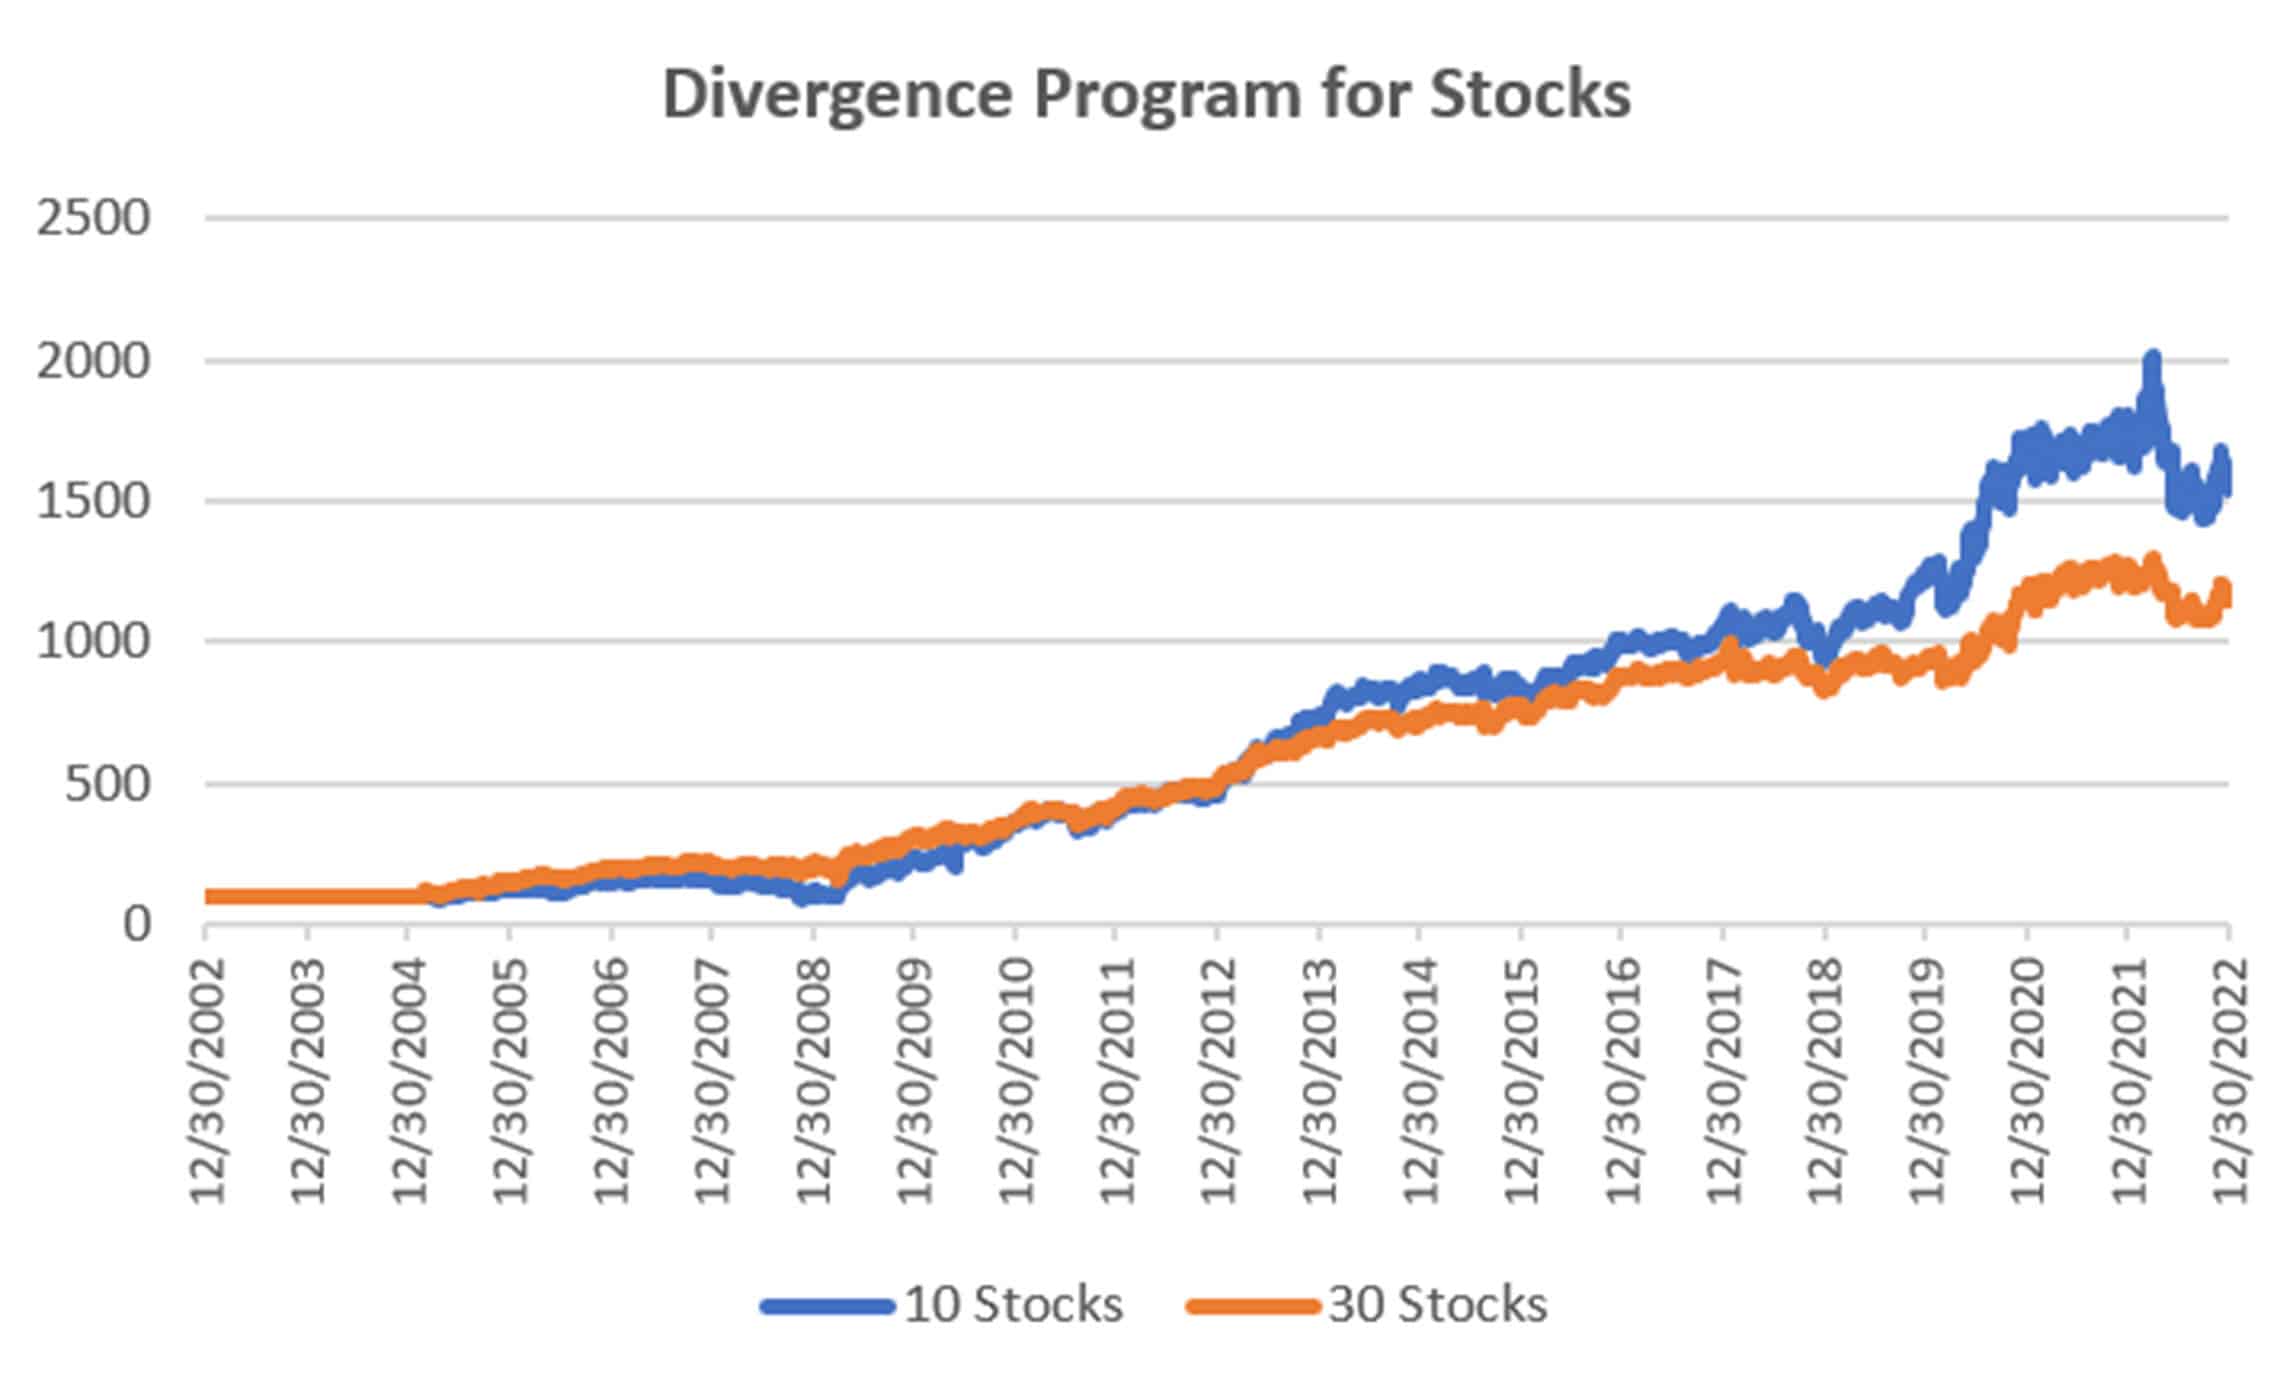
Chart 2. Equity Divergence program, NAVs from 2002.
Stock Selection
The Equity Divergence program uses the same stock selection process as our other portfolio. Each day, we rank how each stock has performed on our system over the past few months. The best 10 or 30 are then chosen for the portfolio.
It is not necessary for a trade to be completed for it to be removed from the portfolio. It just needs to fall out of the top 10 or 30 to be replaced by a stock performing better. That often avoids the “give-back” at the end of a trade.
Placing Orders
Each day an Order Sheet will tell you the positions to enter and exit on the following open. A sample appears below. On this day there were two stock exits and two entries. Because of the short-term nature of the signals, there are often trades each day. Our performance record (“Tracking”) captures the total return at the bottom of the Order sheet. We can then produce the performance chart shown above. If there are changes in markets or trading rules, it does not affect the tracking history.
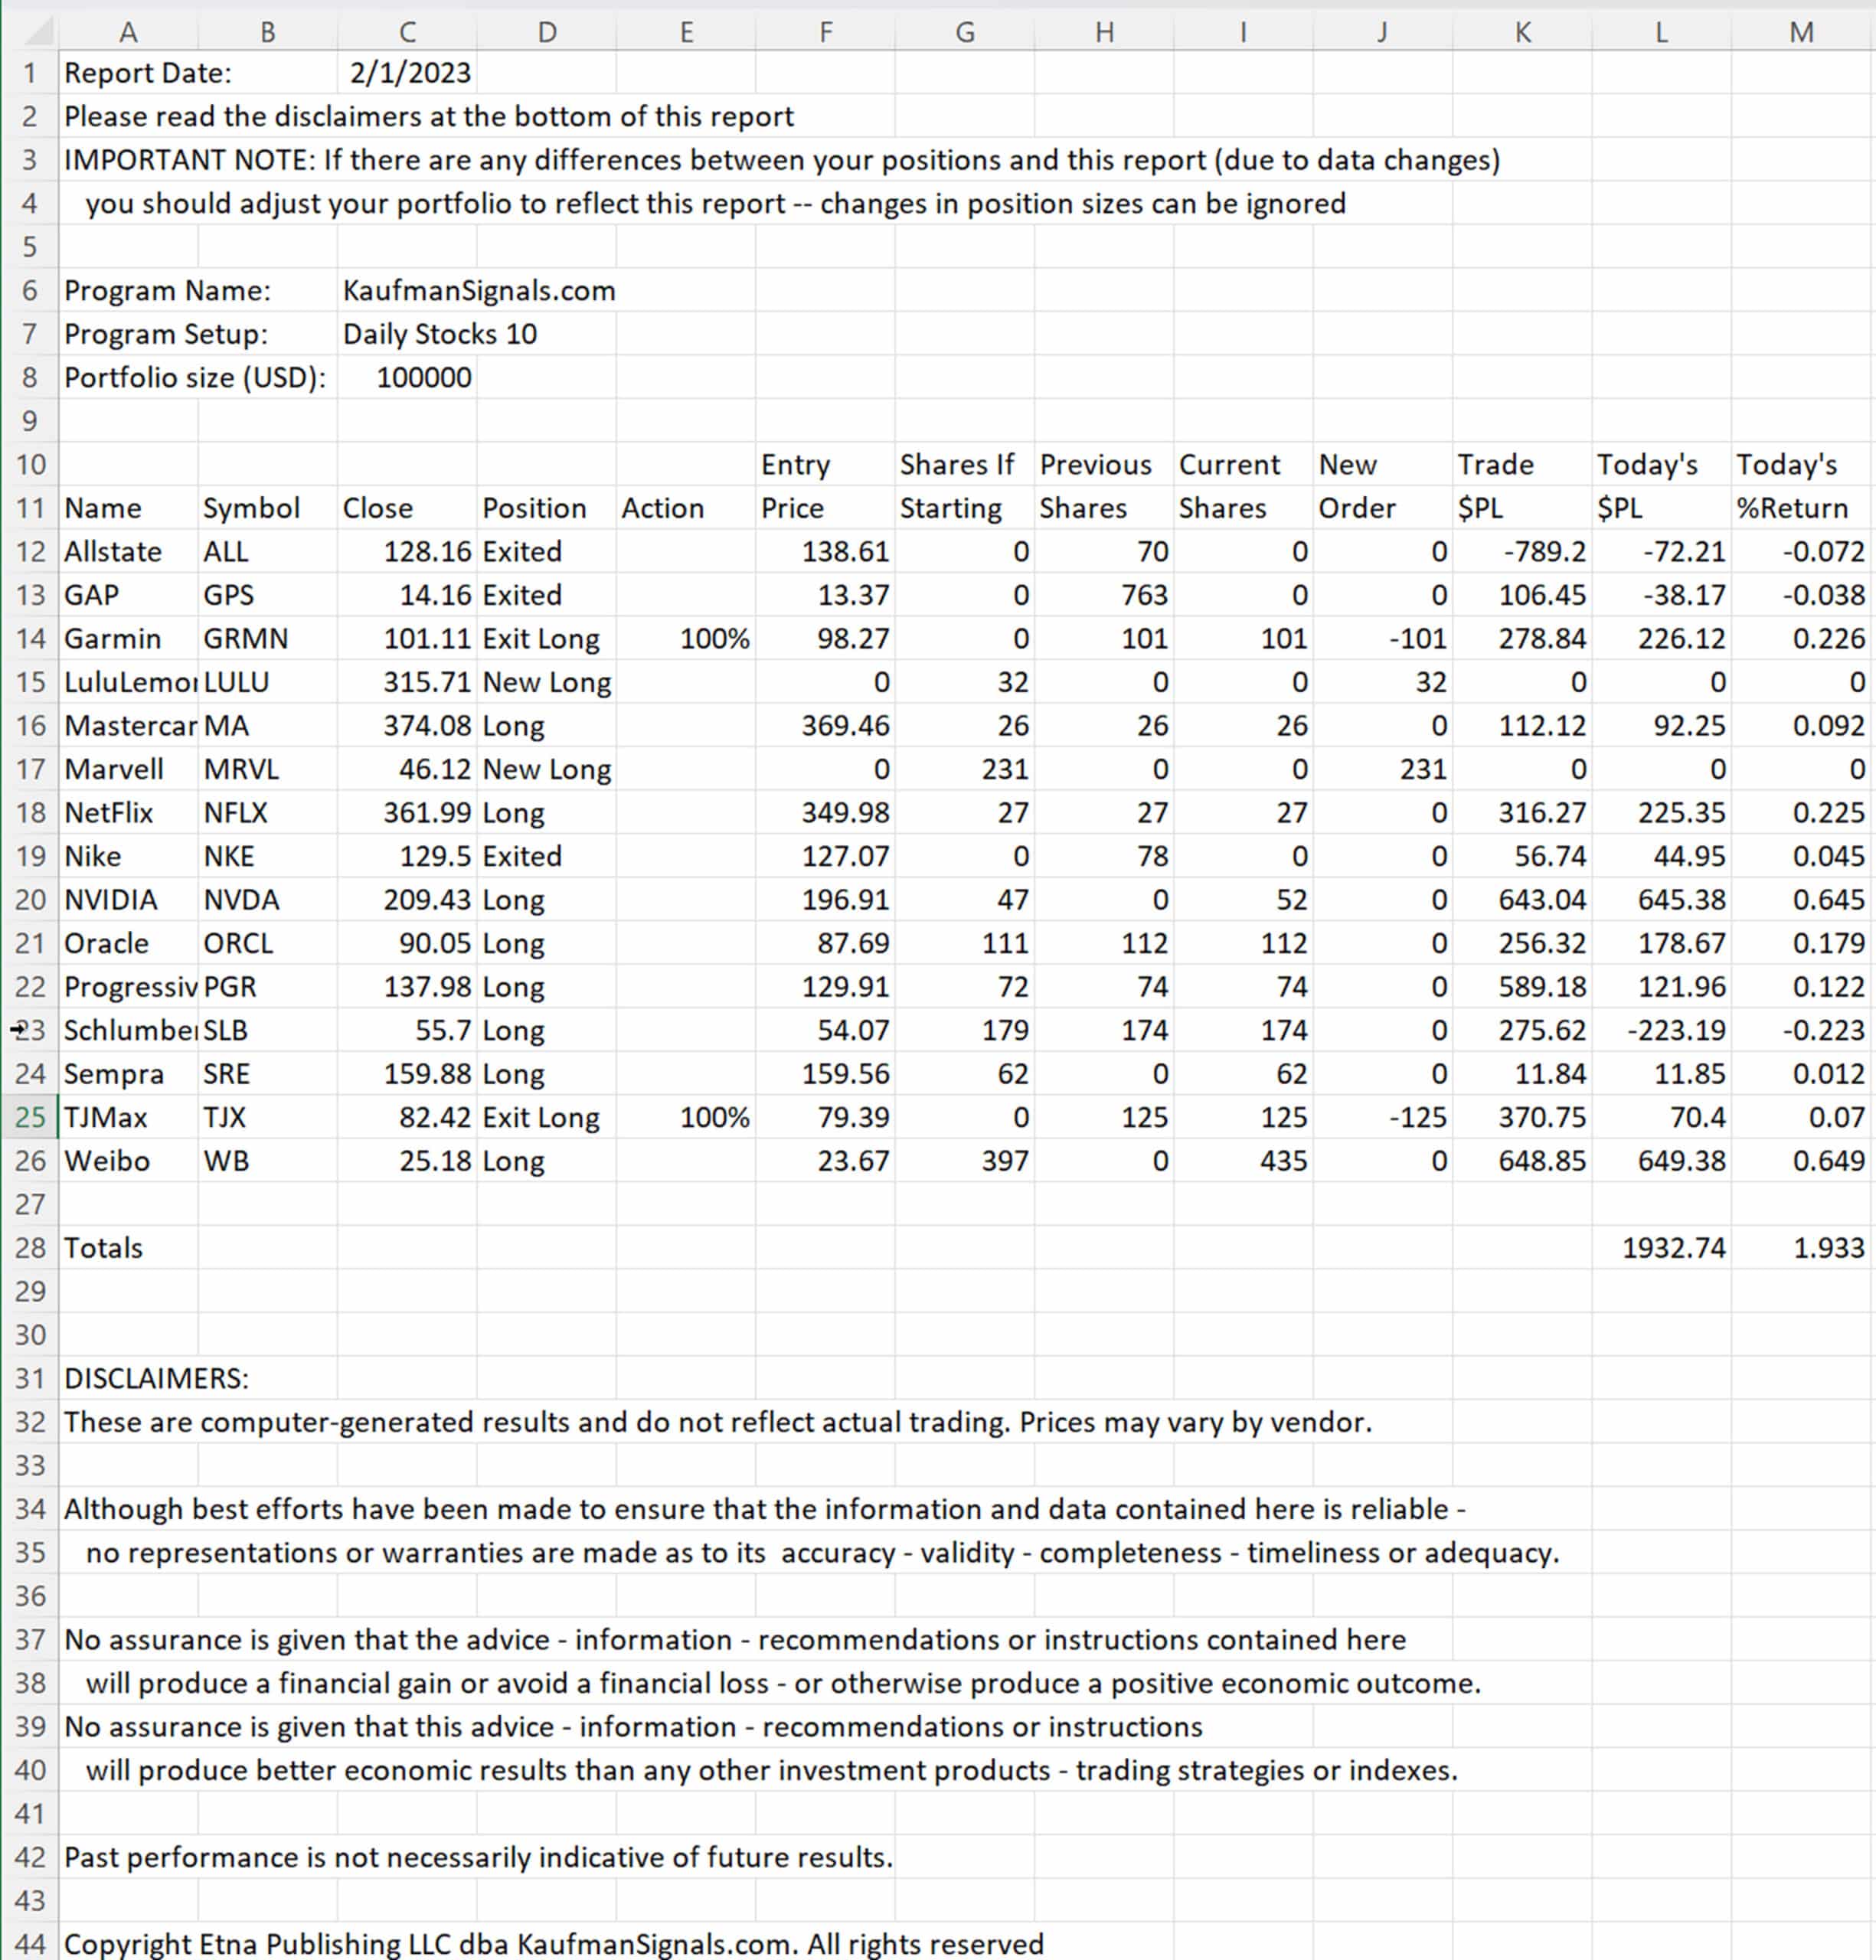
Chart 3. Equity Divergence sample Order sheet.
The All Orders Report
As with all of our portfolios, we produce an All Orders Report that shows the system status of all markets trading on that system. It shows all stocks in alphabetical order, along with their positions, as determined by the Divergence strategy. A sample is below:

Chart 4. Equity Divergence All Orders Report on Feb 8, 2023.
Futures Divergence
Futures Divergence uses the exact same logic as Equity Divergence. It looks for a rising price and a falling momentum. It differs in how it sizes positions, chooses diversification, and stabilizes performance volatility. It can do this because of the leverage available in futures, and the part of the investment held in reserve, about 40% to 50%.
Performance
The Futures Divergence program had a difficult year because no sustained trends existed. It could enter on a divergence pattern, but the market was inconsistent about resuming the trend. The table below and the following chart show the long-term returns.
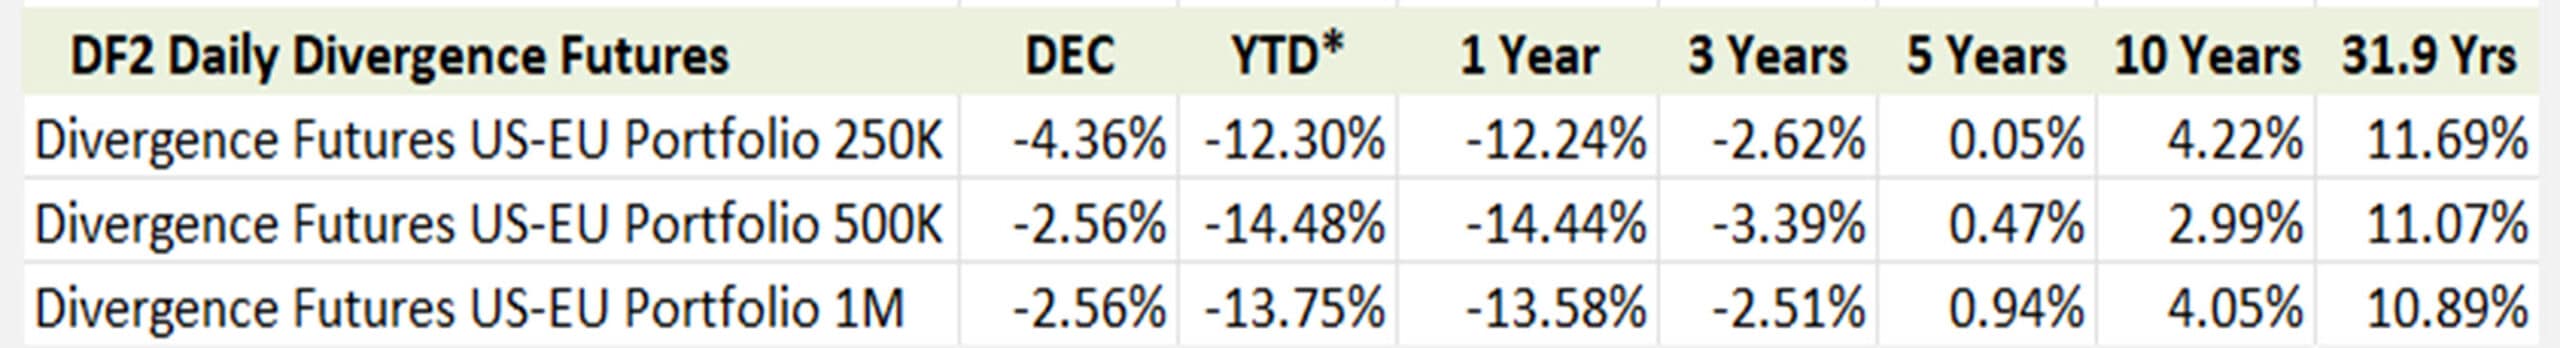
Futures Divergence performance table.
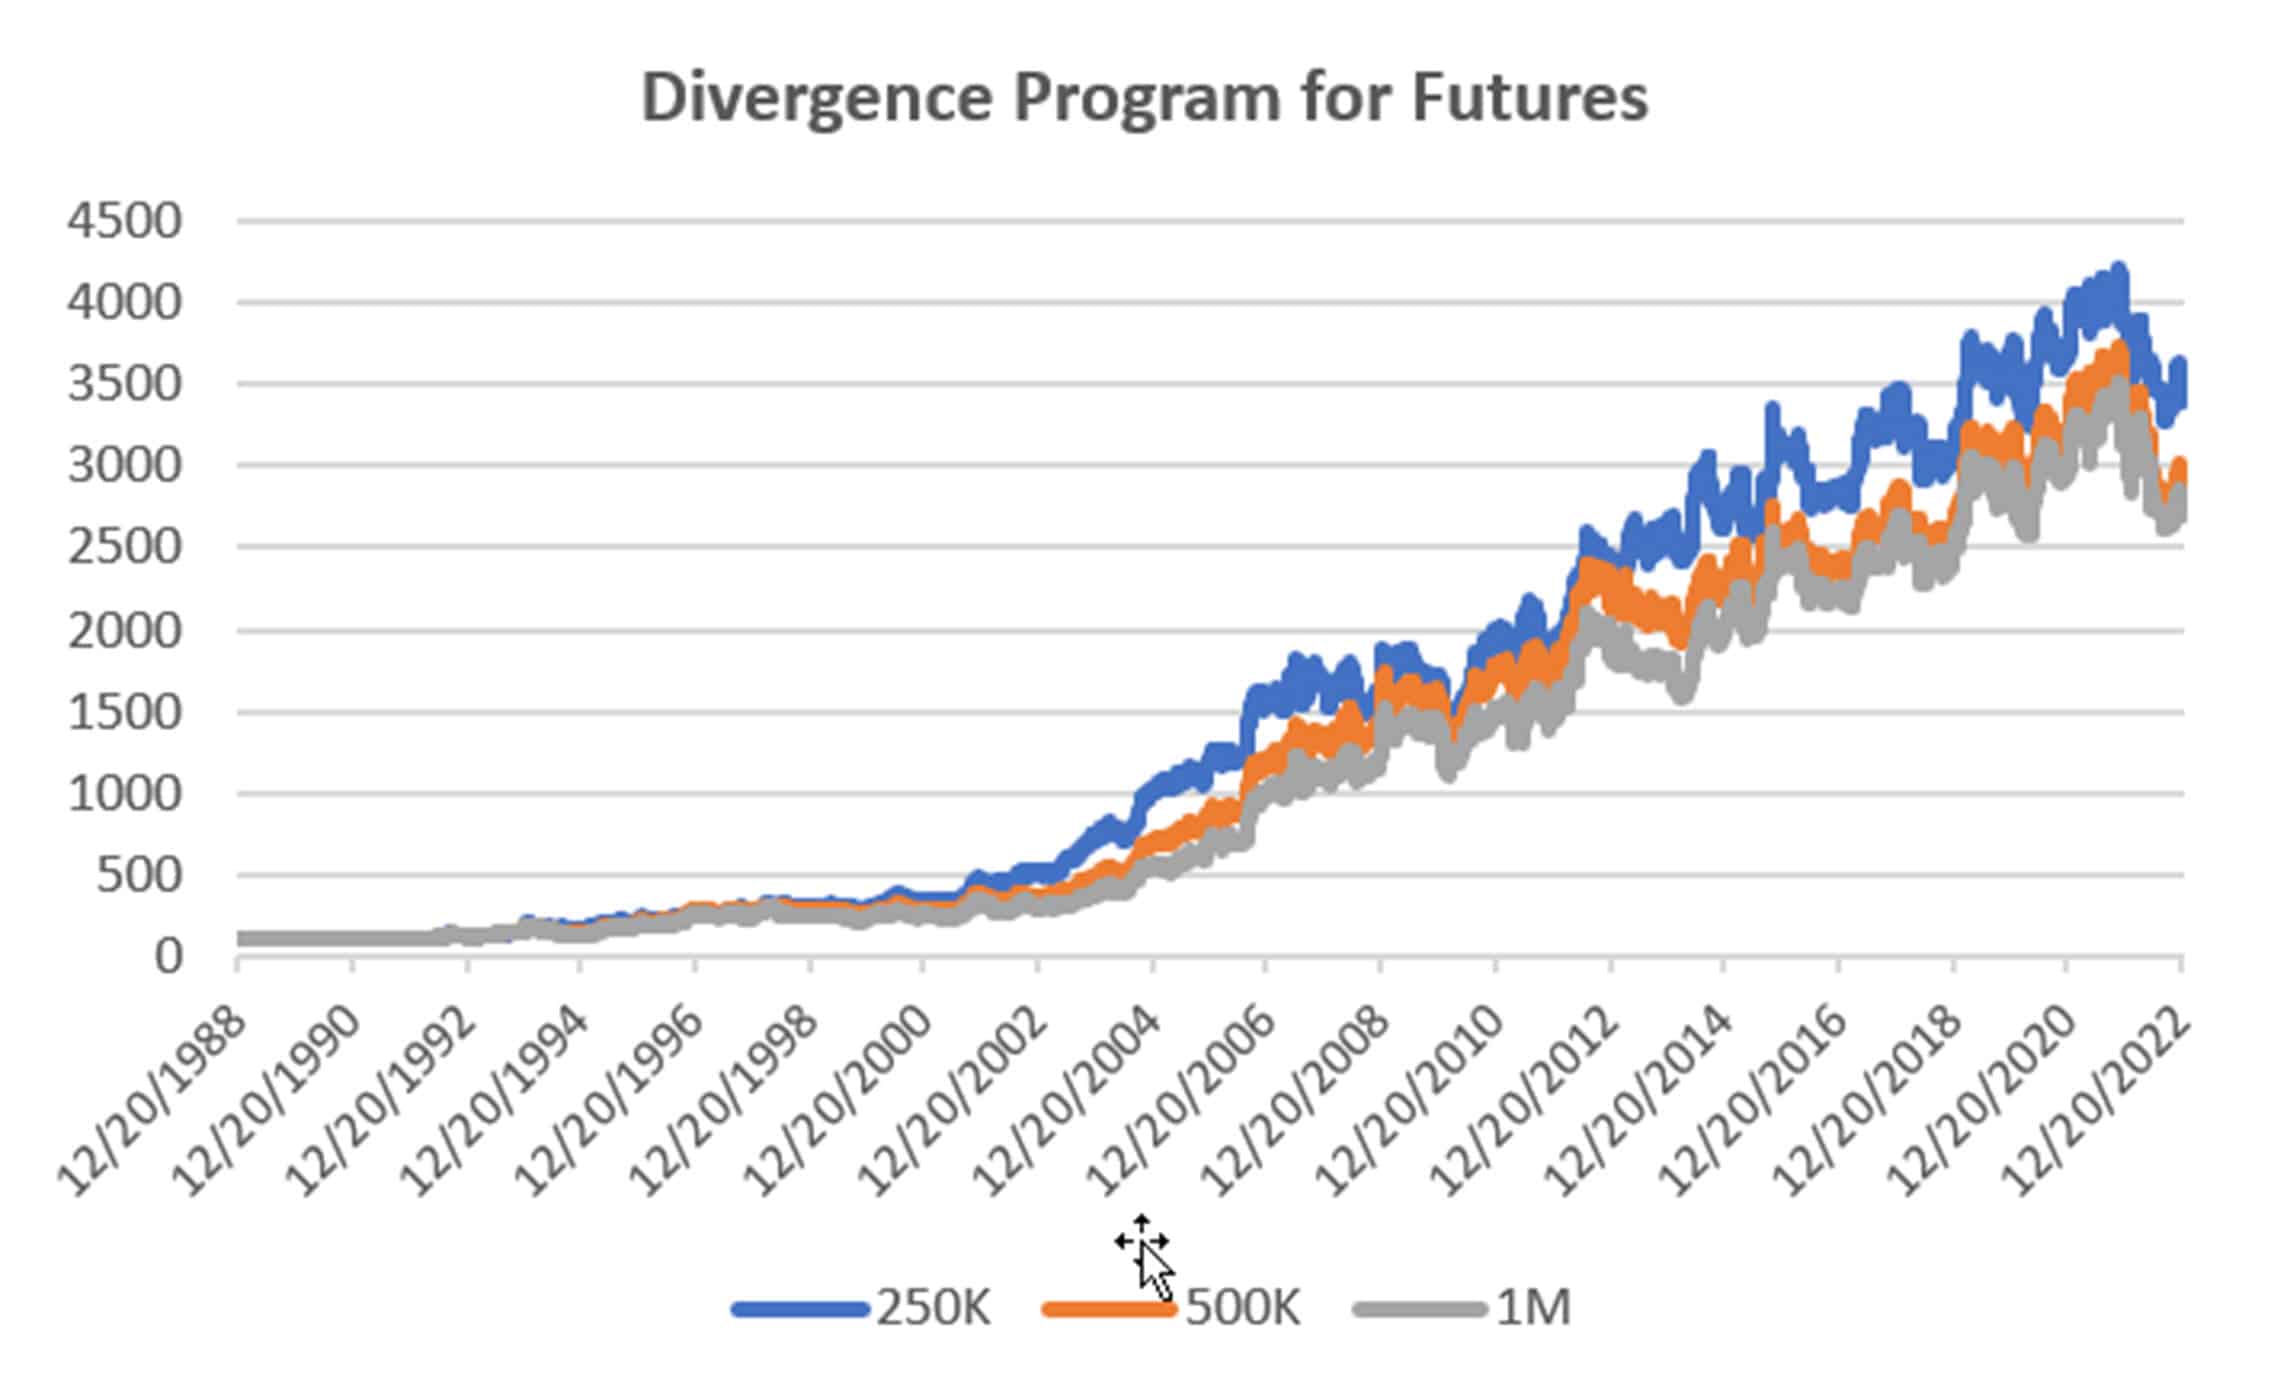
Chart 5. Futures Divergence long-term
Diversification
Futures have six distinct sectors: currencies, interest rates, equity index, metals, energy, and agriculture. We do not trade agricultural products because of their liquidity compared to the other sectors. It is difficult to equalize the risk across sectors.
Unlike equities, which can be highly correlated, the six futures sectors provide very good diversification. Our program attempts to find markets from three different sectors. If that is not possible, the program deleverages the risk. Fewer markets are likely to produce more risk.
Position Sizing and Daily Orders
Futures positions are sized using volatility parity. Starting with a nominal market allocation, say $25,000, we divide that allocation by the average true range (ATR) of prices times the futures market conversion factor (the value of a one-point move). The markets in each sector are then normalized to our target volatility of 14% by scaling up or down their position size. Once all sectors have equal risk, they can be allocated to the portfolio. With all the sectors at the same risk level, we can now adjust the entire portfolio to our target volatility. This is also done by scaling the position size up or down.
Equal risk at all levels is important because it maximizes diversification; at the same time, it controls risk (when it is too high) and improves returns (when it is too low).
In the Order sheet below, the Action column indicates that we need to reduce our exposure to gold and Brent in order to maintain our volatility target.

Chart 6. Futures Divergence sample Order sheet.
Notice that the last column has a suggested execution time. We cannot trade futures on the next open because most markets open 30 minutes after they close. We do not get our data downloaded until three hours later.
Then all our accounting for futures is done based on entries and exits executed on the following close. Our experience is that entering and exiting on the open is better, but those prices are no longer an option. The time at the right indicates what we believe is when volume picks up at the beginning of the trading day. You may want to look at the volume of the markets you trade and place your orders when those markets become liquid. However, if you are trying to match the returns of our program, then enter on the close.
The All Orders Report
As with all of our programs, a report shows the trading signals in every market. For futures, the markets are arranged by sector and grouped in what we hope is a logical order.
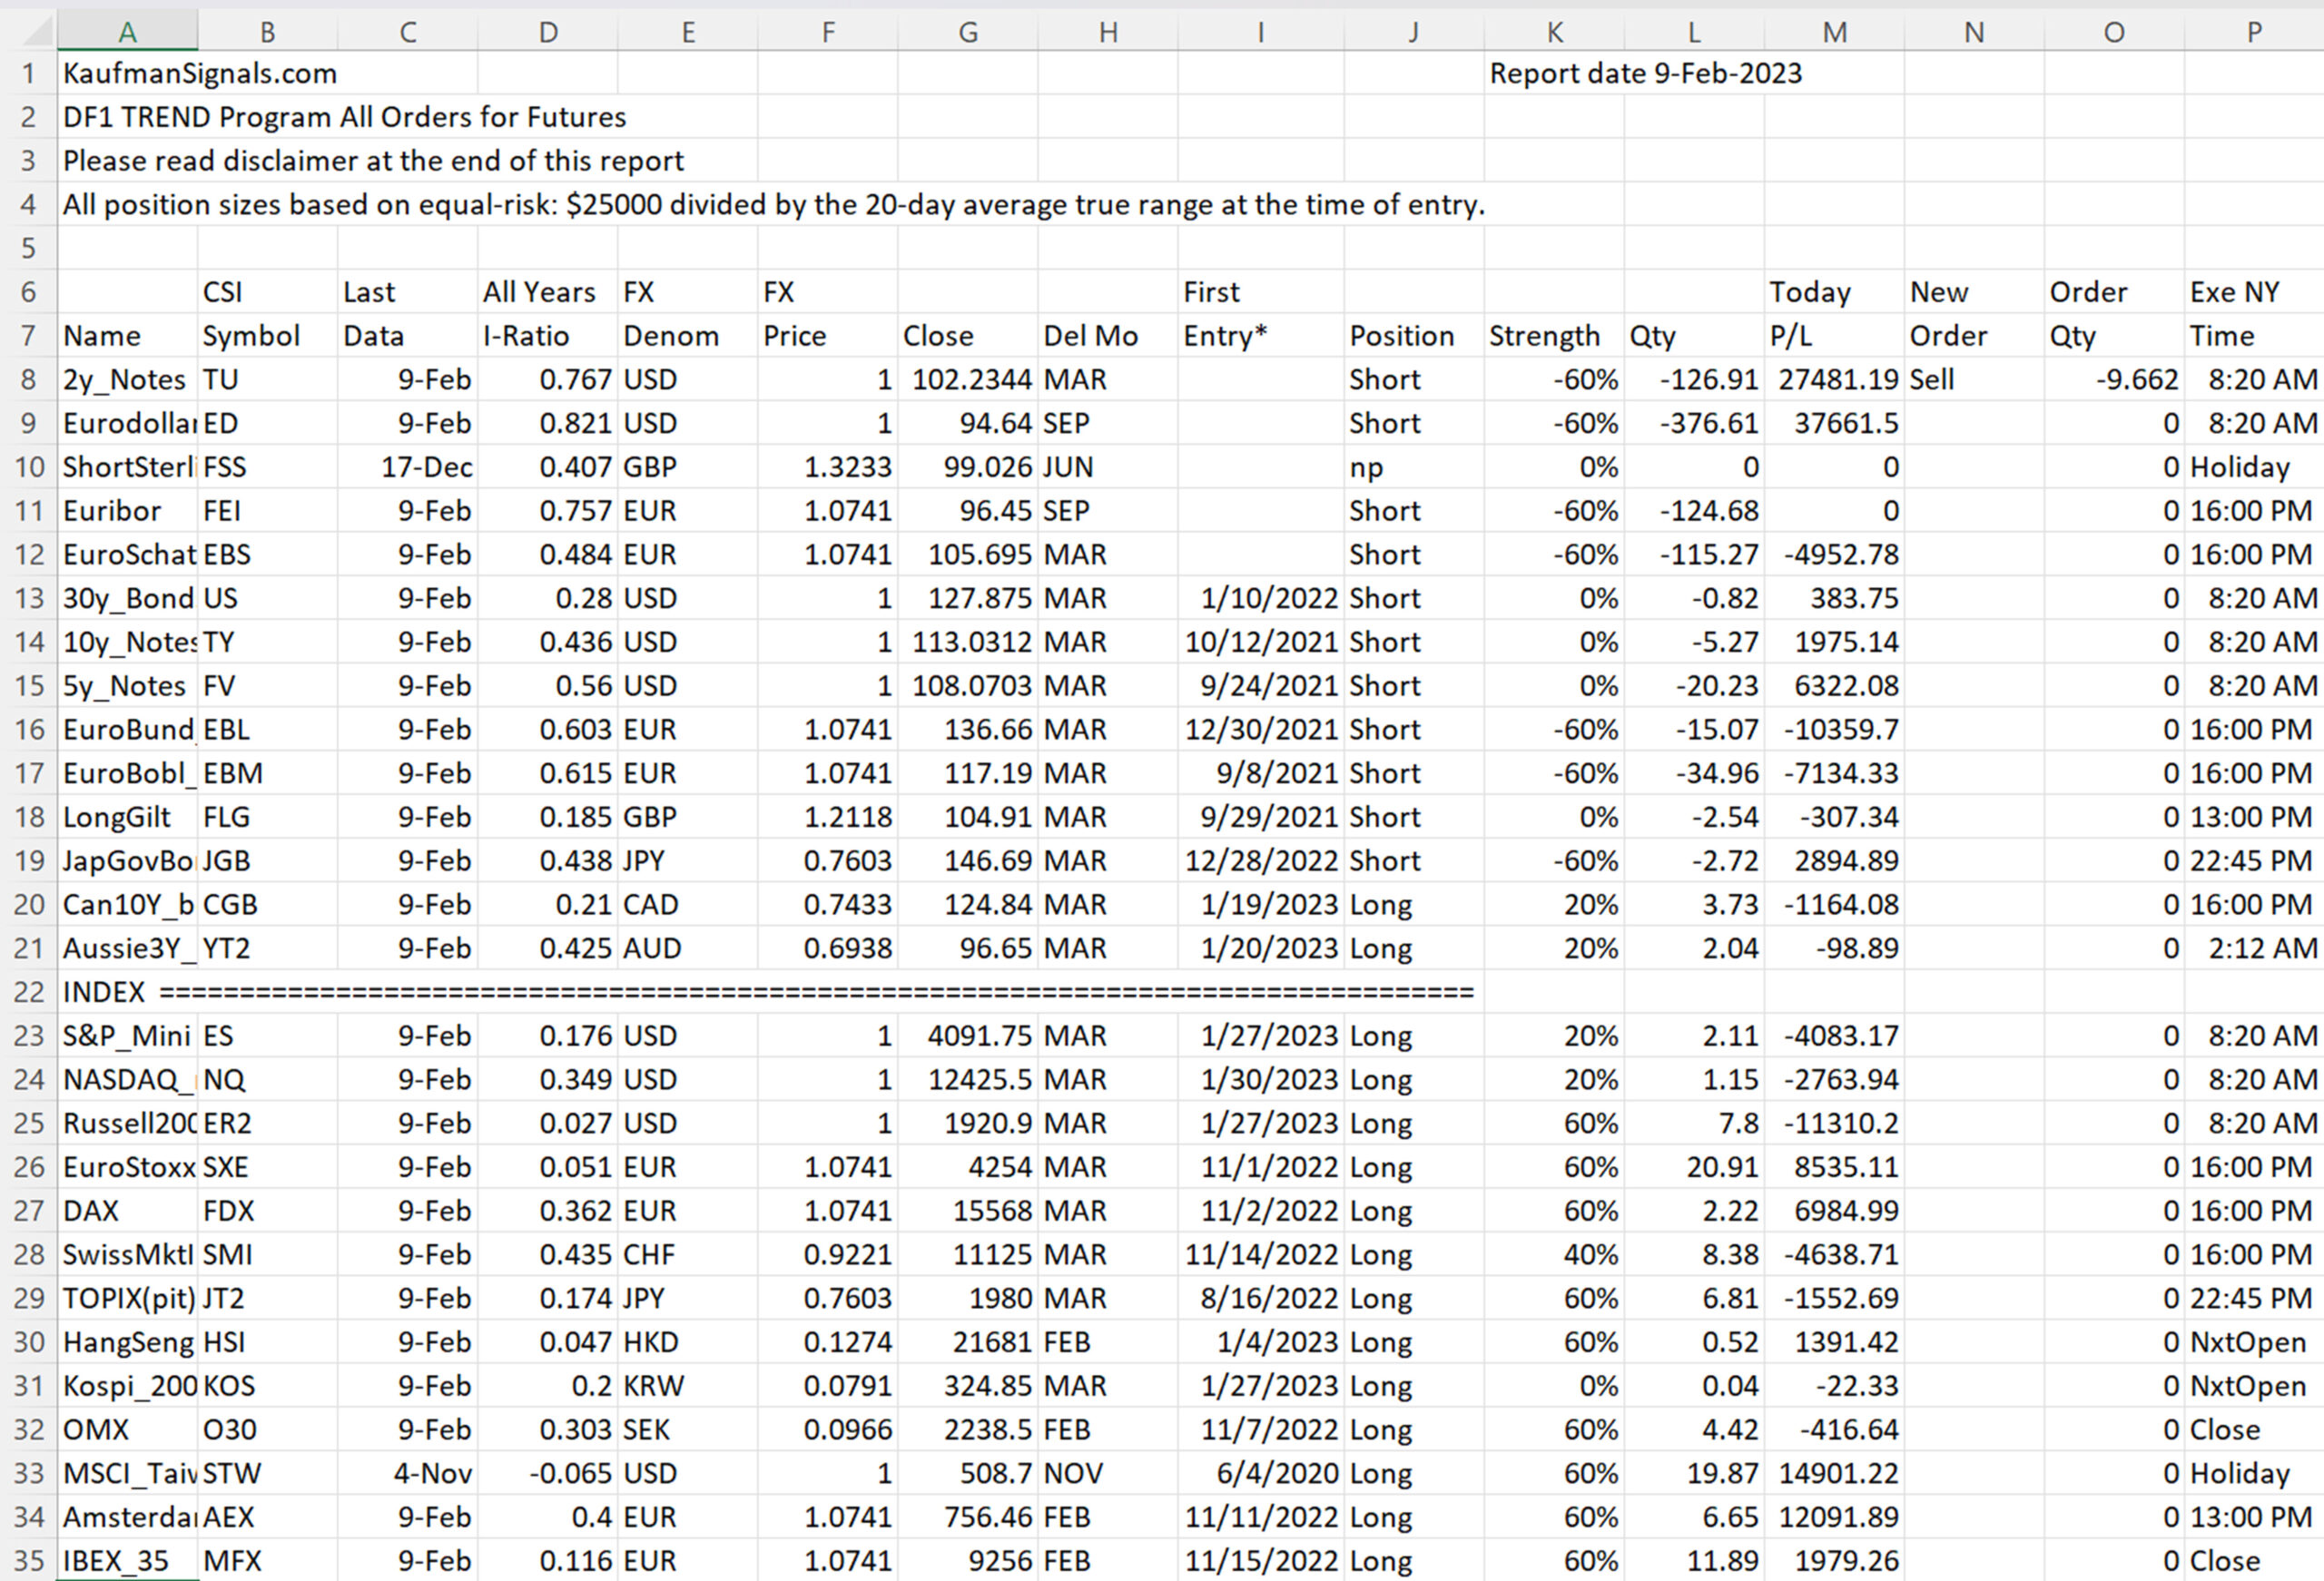
Chart 7. Sample of the All Orders report for Futures Divergence.