

Timing is a strategy our own version of buying pullbacks in an upwards trending market. It uses a breakout to decide direction rather than a moving average, plus a confirmation of the trend. Most important, it uses a momentum super-smoother to decide when the stock is oversold and available for a position. It is combined with our portfolio selection process that ranks performance and selects the best stocks.
Unique Features of the Timing Program
- This program determines the trend using a breakout rather than a moving average because it is more reliable and offers more latitude in combination with momentum. Often a moving average will correlate positively with a momentum indicator, causing opportunities to be missed. We also believe that a new high or new low represents a “regime change” that makes trading signals more reliable.
- The momentum indicator uses John Ehlers’ Roofing Filter, a clever way of smoothing the values without adding any noticeable lag. This makes our signals more reliable and more timely.
- If prices make a new short-term low we exit the trade.
- We rank the performance of the hundreds of stocks in our candidate list using this strategy, then choose the best ones that have a position, or a pending position. A trade can exit when momentum goes to neutral or if another stock is performing better. We believe in “persistence,” that is, a stock that is performing well with this system is most likely to continue performing well.
Dynamic Portfolios
From a selection of about 400 stocks (this will vary) we dynamically select 10 or more stocks based on performance, volatility, and volume. When a stock is selected, the position size is based on an investment of $10,000 divided by the current price. While this isn't a perfect method, it goes a long way towards equalizing the risk of each trade. We use $10,000 to make it convenient to scale up or down to your own investment size. Read the section below on position sizing to be sure you are getting the best return possible
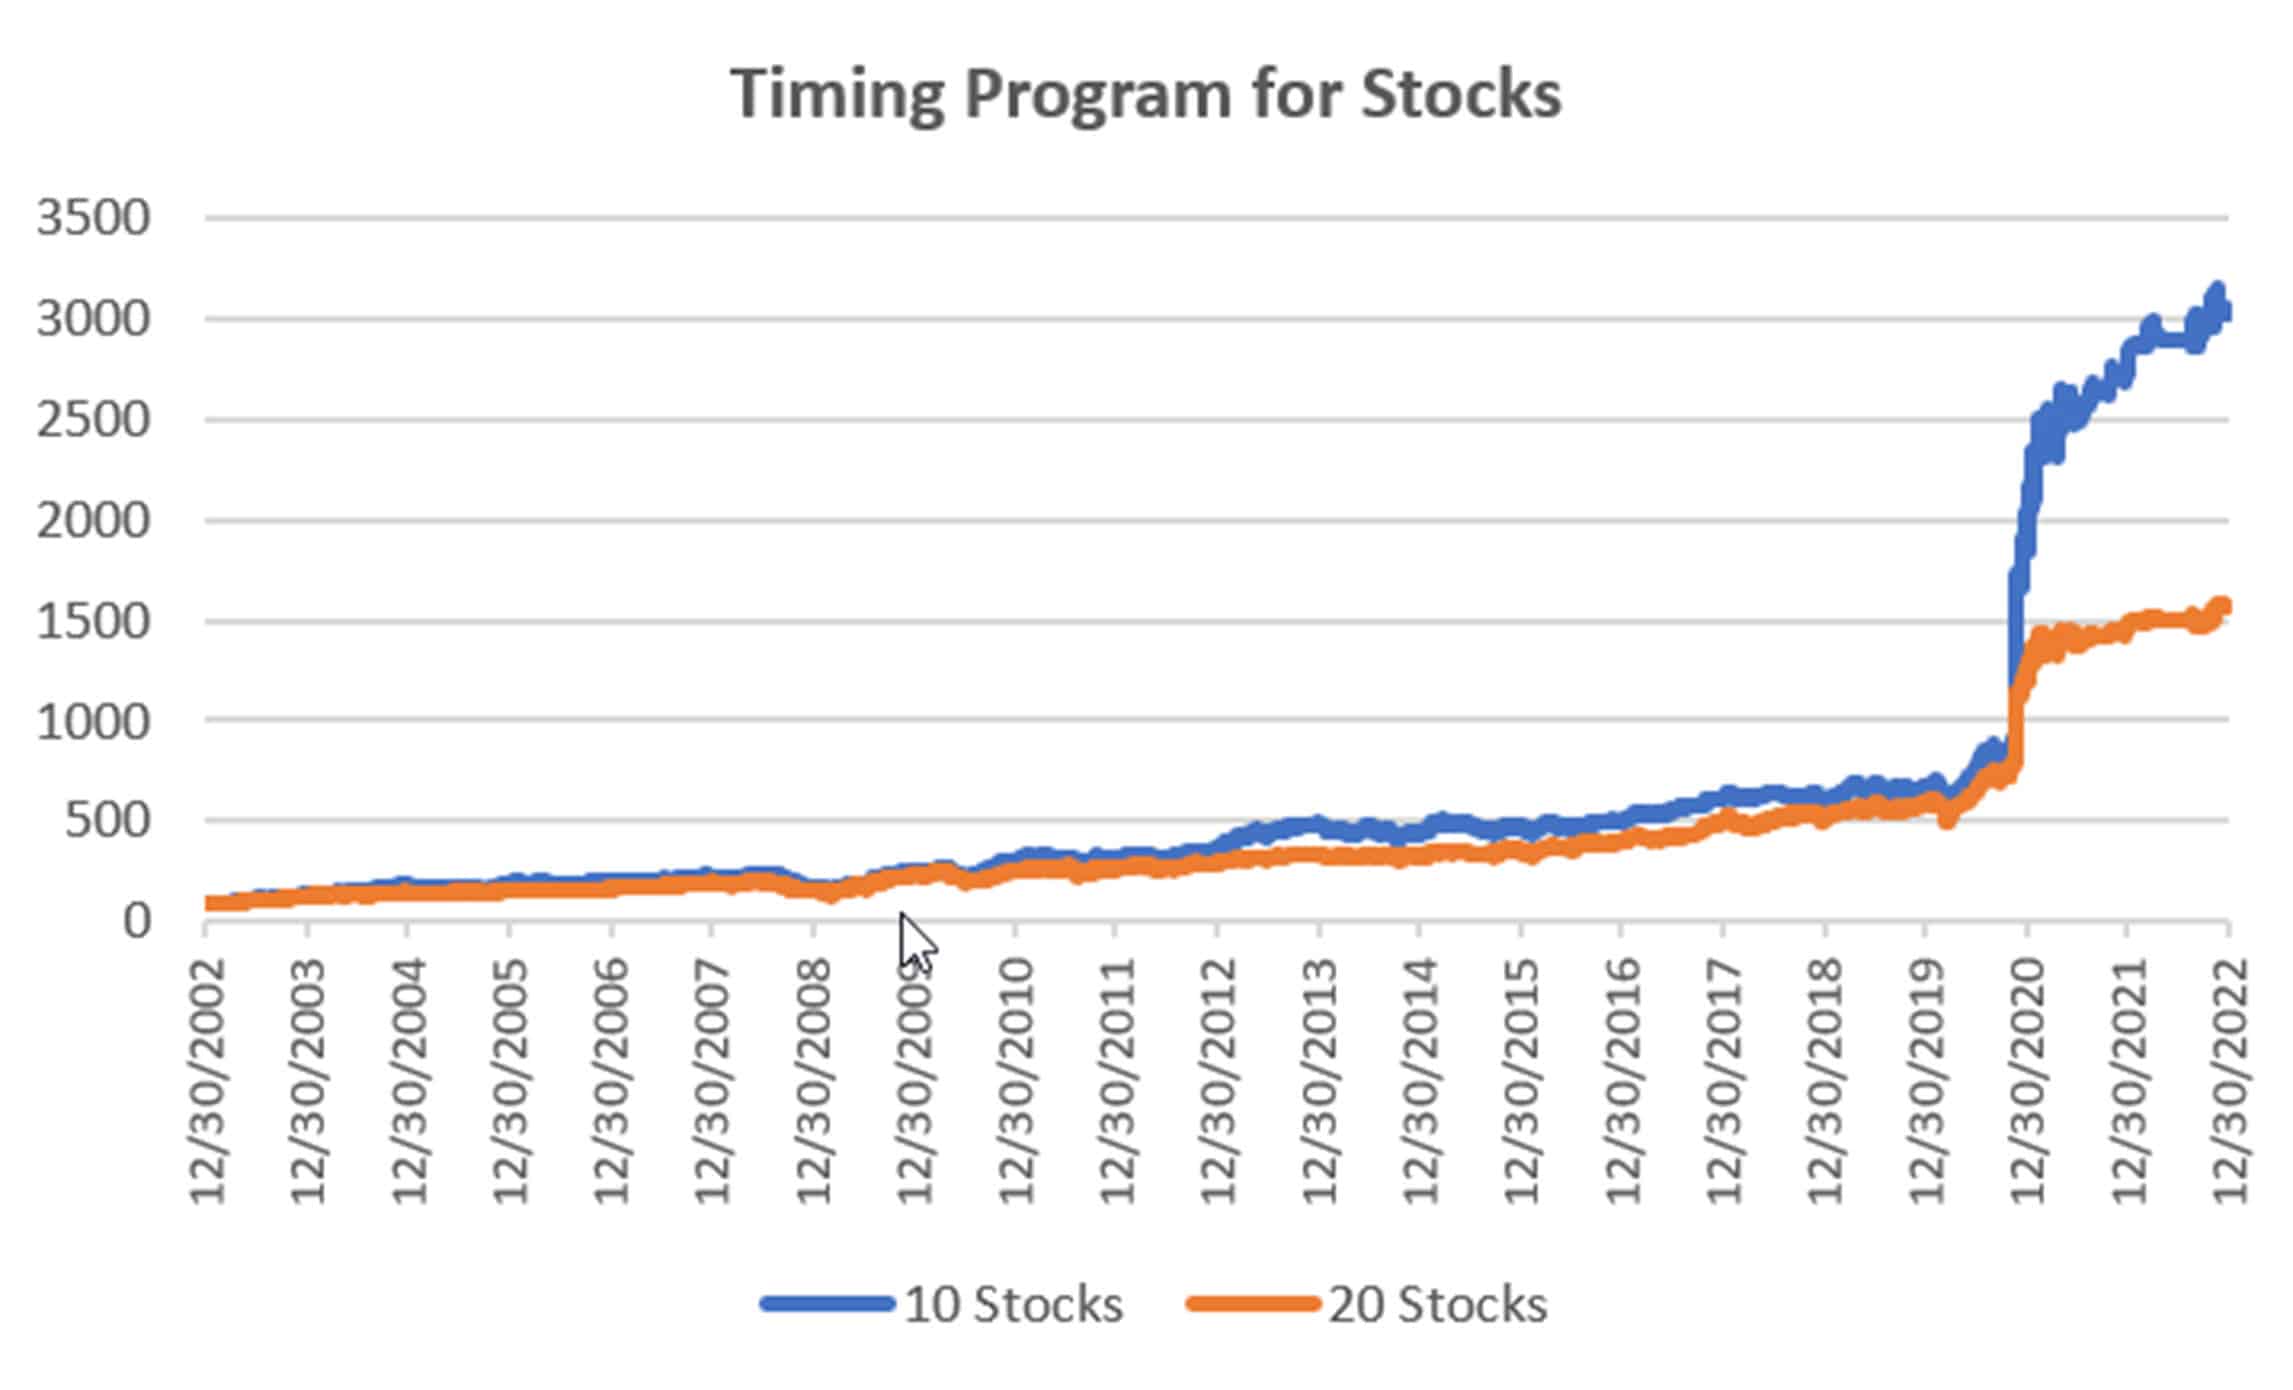
These portfolios have historically outperformed the market in terms of risk and return, avoiding the major drawdowns in 2002, 2008, and 2022. The table and chart below are from our monthly Performance review as of December 2022.
You can find it updated each month by clicking on the Performance tab. We have been publishing the Daily Signals since 2010. Prior to that, the performance is hypothetical and reflects system testing.

Selection Criteria
Stock selection is based on four criteria,
- The stock must have a trading signal.
- It must have a minimum volatility.
- It must be in an uptrend
- It must be oversold relative to the super-smoothed momentum indicator.
- It must have a history of being profitable.
By eliminating stocks with low volatility and, therefore, low returns, we greatly increase our expectation of higher returns. Because these trades typically last for only 5 to 8 days and must satisfy strict entry criteria, there may not always be enough trades to fill the portfolio. On average, a portfolio will be filled to about 65% of its capacity. Then an account size of $50,000 will, on average, hold positions worth $32,500. The returns shown in the table above are based on this lower exposure, therefore, lower risk.
For a current view of portfolio returns, go to the Performance tab.
Position Size and Compounding
All positions are sized by dividing the nominal portfolio investment by the number of stocks, then dividing that allocation by the closing price on the day before the entry order.
For example, the 10-stock portfolio has a nominal investment of $100,000. Divided by 10, that gives each stock an allocation of $10,000. Divide that by the closing price of the stock, and you have the position size.
This method tries to equalize the risk of each stock. It is not perfect, but it serves the purpose and is much easier than true risk parity.
As your investment increases, each new trade will have a size based on 1/10 of your current equity. That will allow for compounding, which is necessary if you are going to get the same returns that we post in our performance report.
You can reduce the portfolio size by allocating $5,000 per stock or less, but then commission costs will have a greater impact on your returns. Our performance reflects a charge of $8 per trade, but a lower fee will significantly improve the returns. We have found that it’s best to commit at least $7,500 to each stock.
Placing Orders
Signals for all portfolios are provided daily, based on the previous close. Orders are expected to be executed on the following open, and we strongly recommend using limit orders if possible. The opening range for any stock can be quite wide. Without using limit orders you will often get a disappointing price. You will also note that opening prices for most data providers may be different. Some use the average of the first minute of trading, and others use the first trade. Our performance record will vary from yours on specific trades, either better or worse, but should even out over time.
Sample Order Sheet
A sample of the Daily Order sheet is below. It is typical of what you would get every day, although the returns are not normally this good. In this case, the system exited Peleton (PTON) after a very good earnings report because the technical objective was reached.

The All Orders Report
Each day the Timing system produces an All Orders report. It lists all the stocks we follow and the current status of the Timing signals. A small sample is shown below. It shows the trend direction if long and the momentum if below our buy threshold. It also has the “1yRatio” which is the annualized return divided by the annualized standard deviation (the risk). A value over 1.0 is extremely good. Any positive value shows profits.
However, we choose the stocks for the portfolio based on our own ranking method, so you may not be able to verify our choices from this table. You could choose other stocks to trade after you have monitored this table for a sufficient amount of time.

For the current portfolio and performance, see the Performance tab on the home page.
*NOTE: Neither actual nor simulated performance may be indicative of future results.
Become a Paid Subscriber and receive trading signals from KaufmanSignals.com each evening for the next day.