
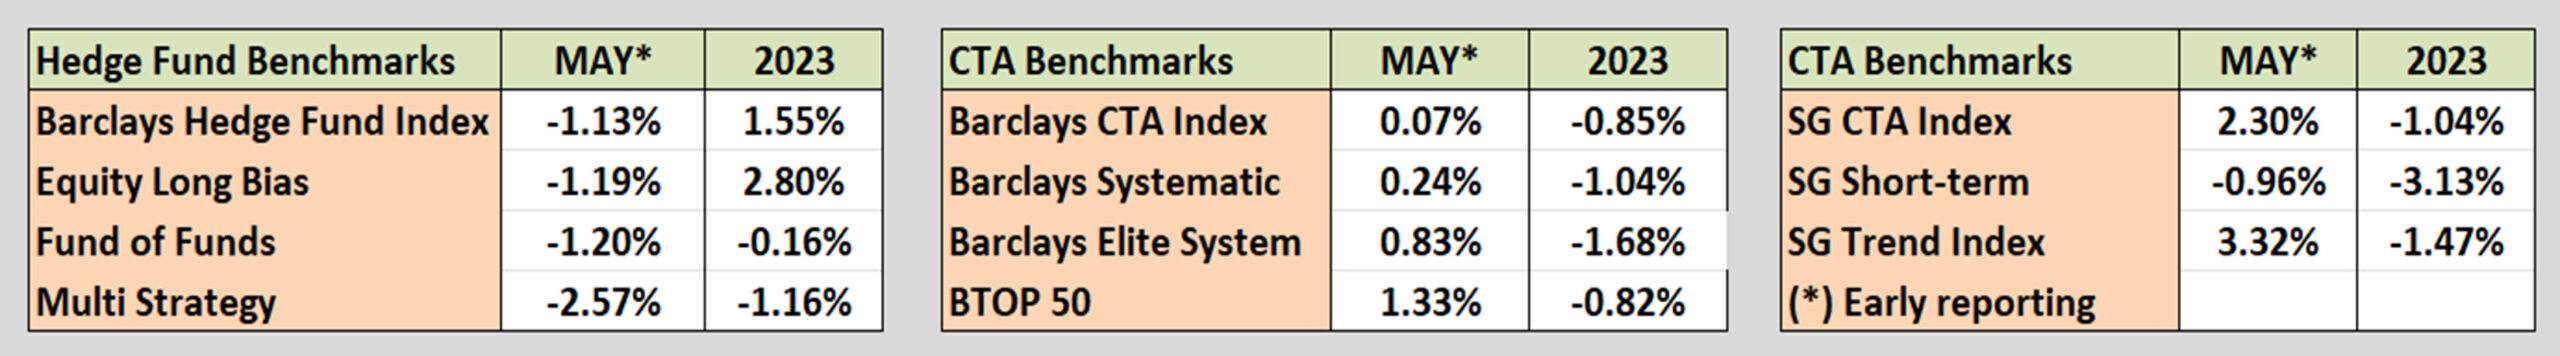
Industry Benchmark Performance
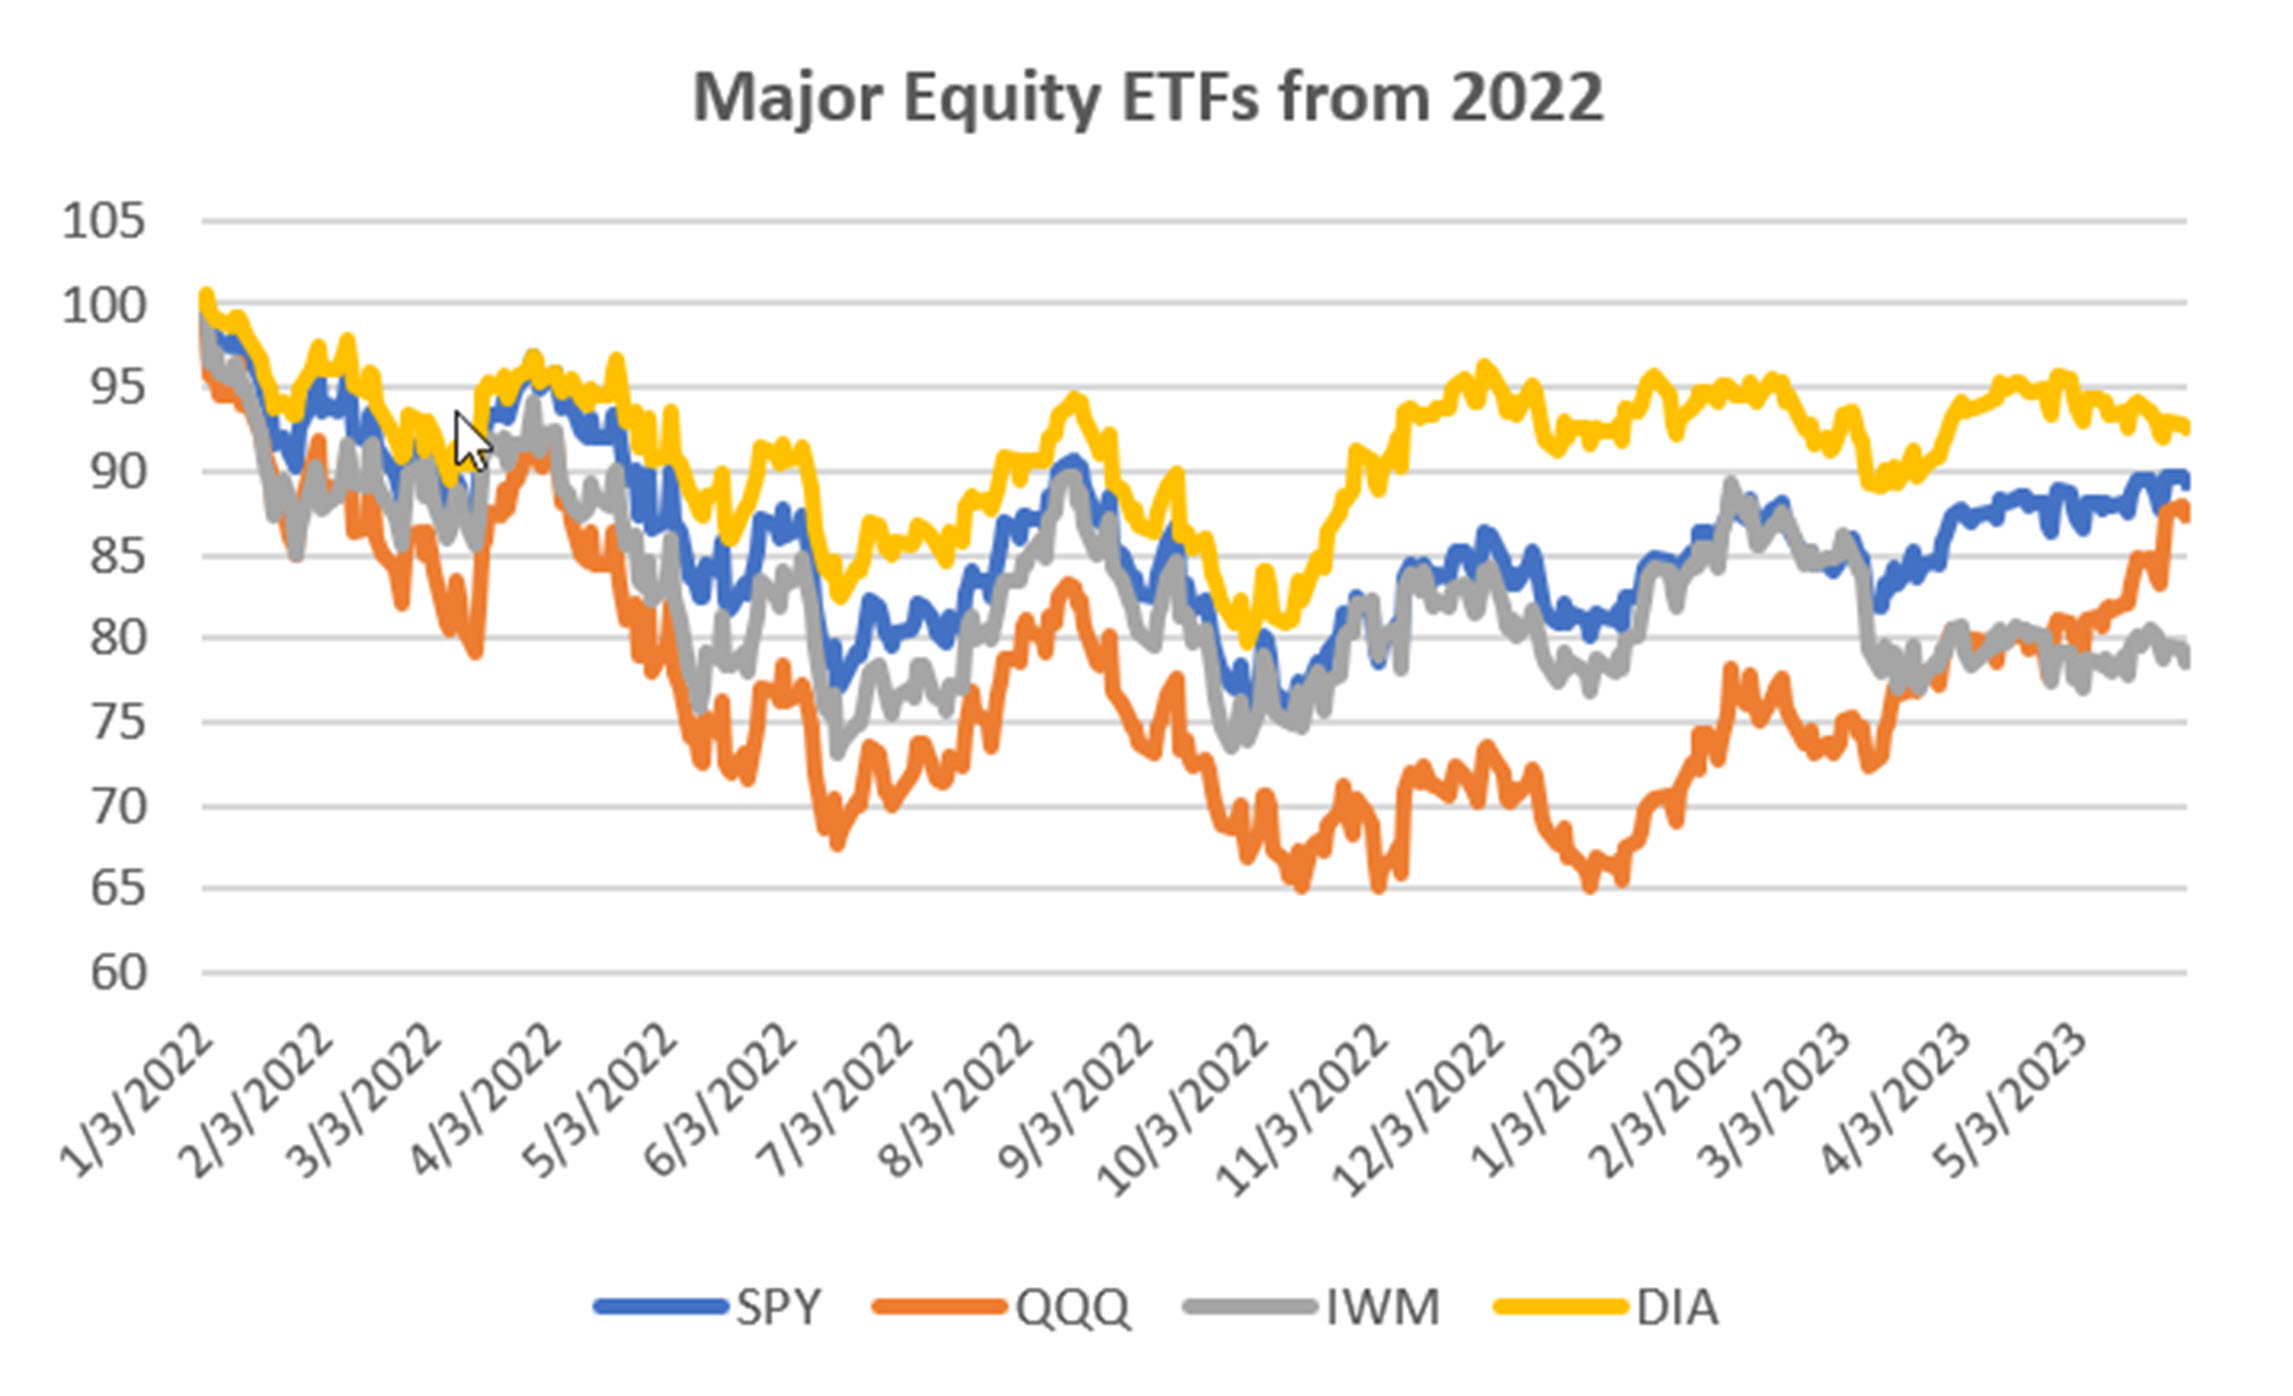
May equity funds posted small losses even in the face of a resolution to end the debt crisis. But then the market has been driven by a few large cap stocks let by Nvidia. Futures were flat, leaving those funds slightly lower for the year. It is likely that we won’t see a new low in equity index markets, and there may be signs of a trend starting. It remains a stock pickers market, and AI is now the pick.
Kaufman’sMost Popular Books (available on Amazon)
Trading Systems and Methods, 6th Edition. The complete guide to trading systems, with more than 250 programs and spreadsheets. The most important book for a system developer.
Kaufman Constructs Trading Systems. A step-by-step manual on how to develop, test, and trade an algorithmic system.
Learn To Trade. Written for both serious beginners and practiced traders, this book includes chart formations, trends, indicators, trading rules, risk, and portfolio management. You can find it in color on Amazon.
You can also find these books on our website, www.kaufmansignals.com.
Blogs and Recent Publications
Find Mr. Kaufman’s other recent publications and seminars at the end of this report. We post new interviews, seminars, and reference new articles by Mr. Kaufman each month.
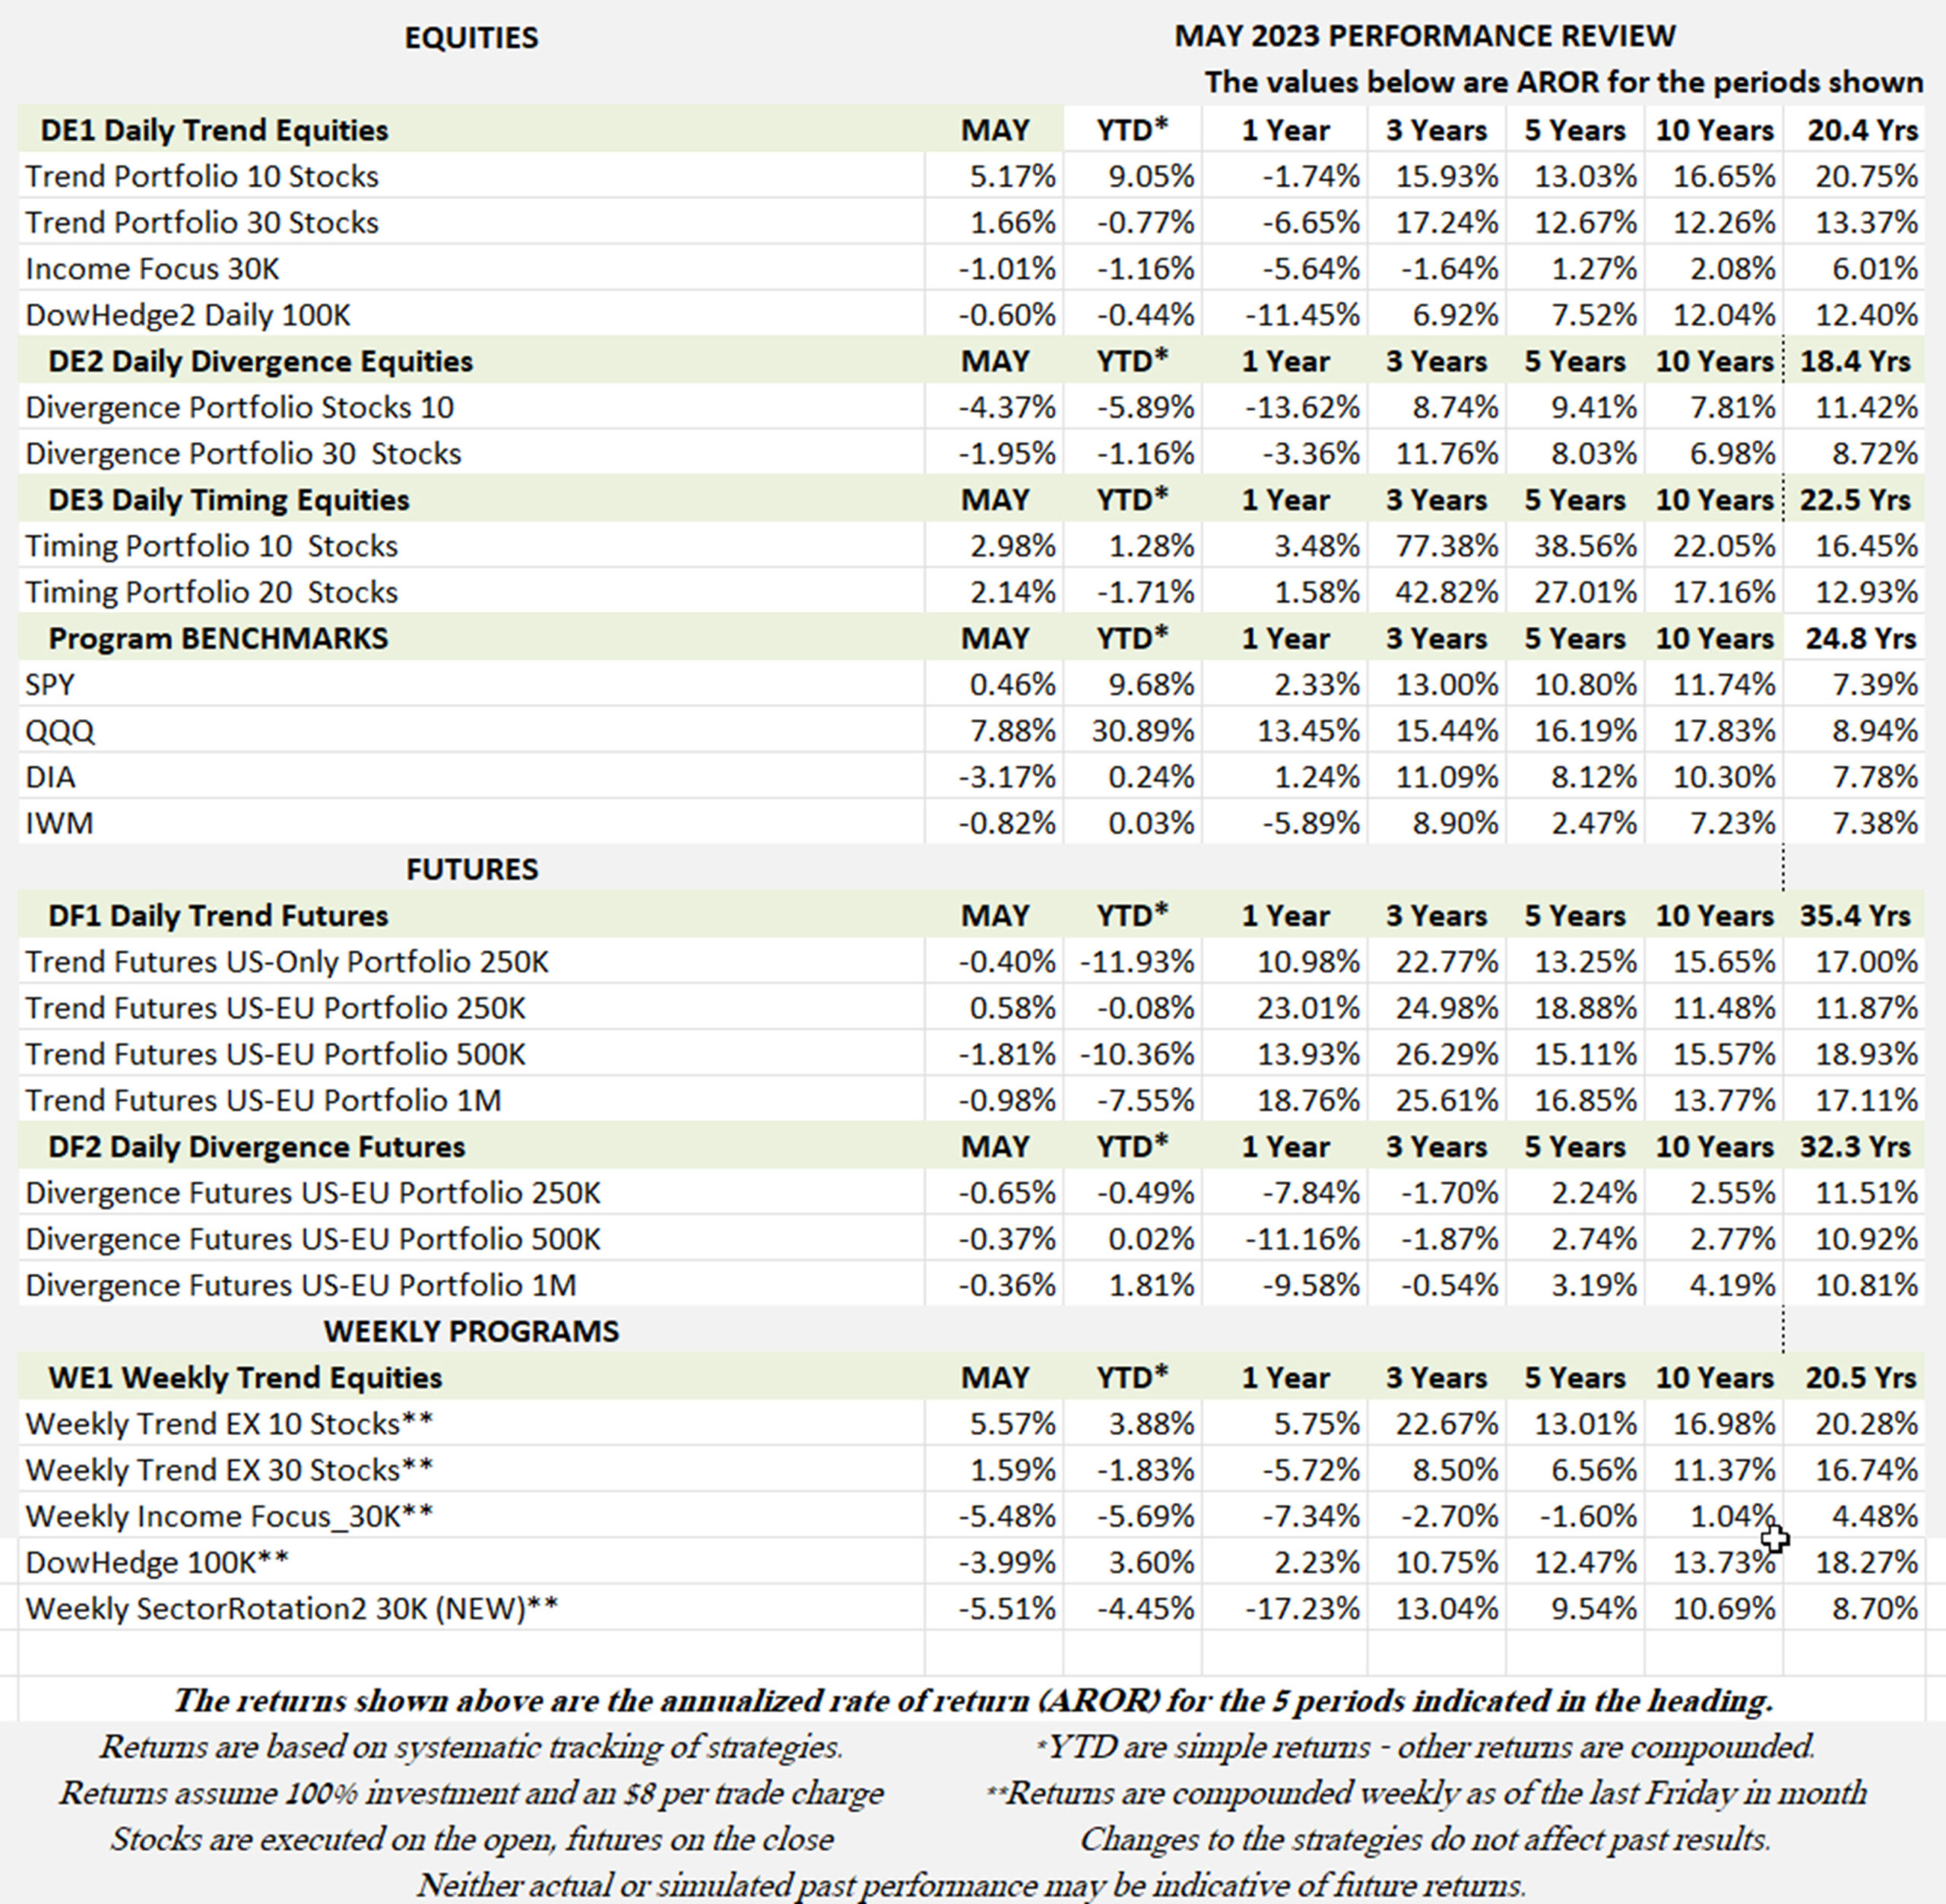
May Performance in Brief
First it was about the debt crisis, now about AI. Once Nvdia posted surprising gains, all the analysts are saying that AI will drive the market for the foreseeable future. That may be optimistic. Our Trend portfolios did benefit from the 30% jump in NVDA and we hold other semiconductor stocks, giving us a nice return in May and putting our portfolios back to par with the S&P. up a healthy 9% for the year.
Our other portfolios are mixed or down slightly, but futures are holding after some erratic days. We expect that a trend in equities will cause many of the sectors to follow, allowing the futures program to recover.
May shows the DOW (DIA) declining and NASDAQ (QQQ) rising sharply. It is a market being driven by tech stocks, in this case semiconductors – those companies that could not deliver during the pandemic and now have an oversupply – or do they? The old chips are out and the new AI chips are in. It is remarkable how the focus of investors can change quickly. Meanwhile, no one seems interested in the small caps.
CLOSE-UP: The Case for Defense Stocks
The war in Ukraine, tension between the U.S. and China over Taiwan, North Korea launching a military satellite, Iran nearing nuclear weaponry, Africa in unrest – and that’s just this week. Meanwhile, congress would like to increase defense spending and continue to support Ukraine. We would think this argues for a bull market in defense stocks.
Chart 1 shows the three most liquid Aerospace and Defense ETFs, XAR, ITA and PPA. They track similarly, are slightly ahead of SPY from 2010 but are more volatile. We should expect more volatility because their component stocks are highly correlated and in total they represent the ups and downs of a single industry.
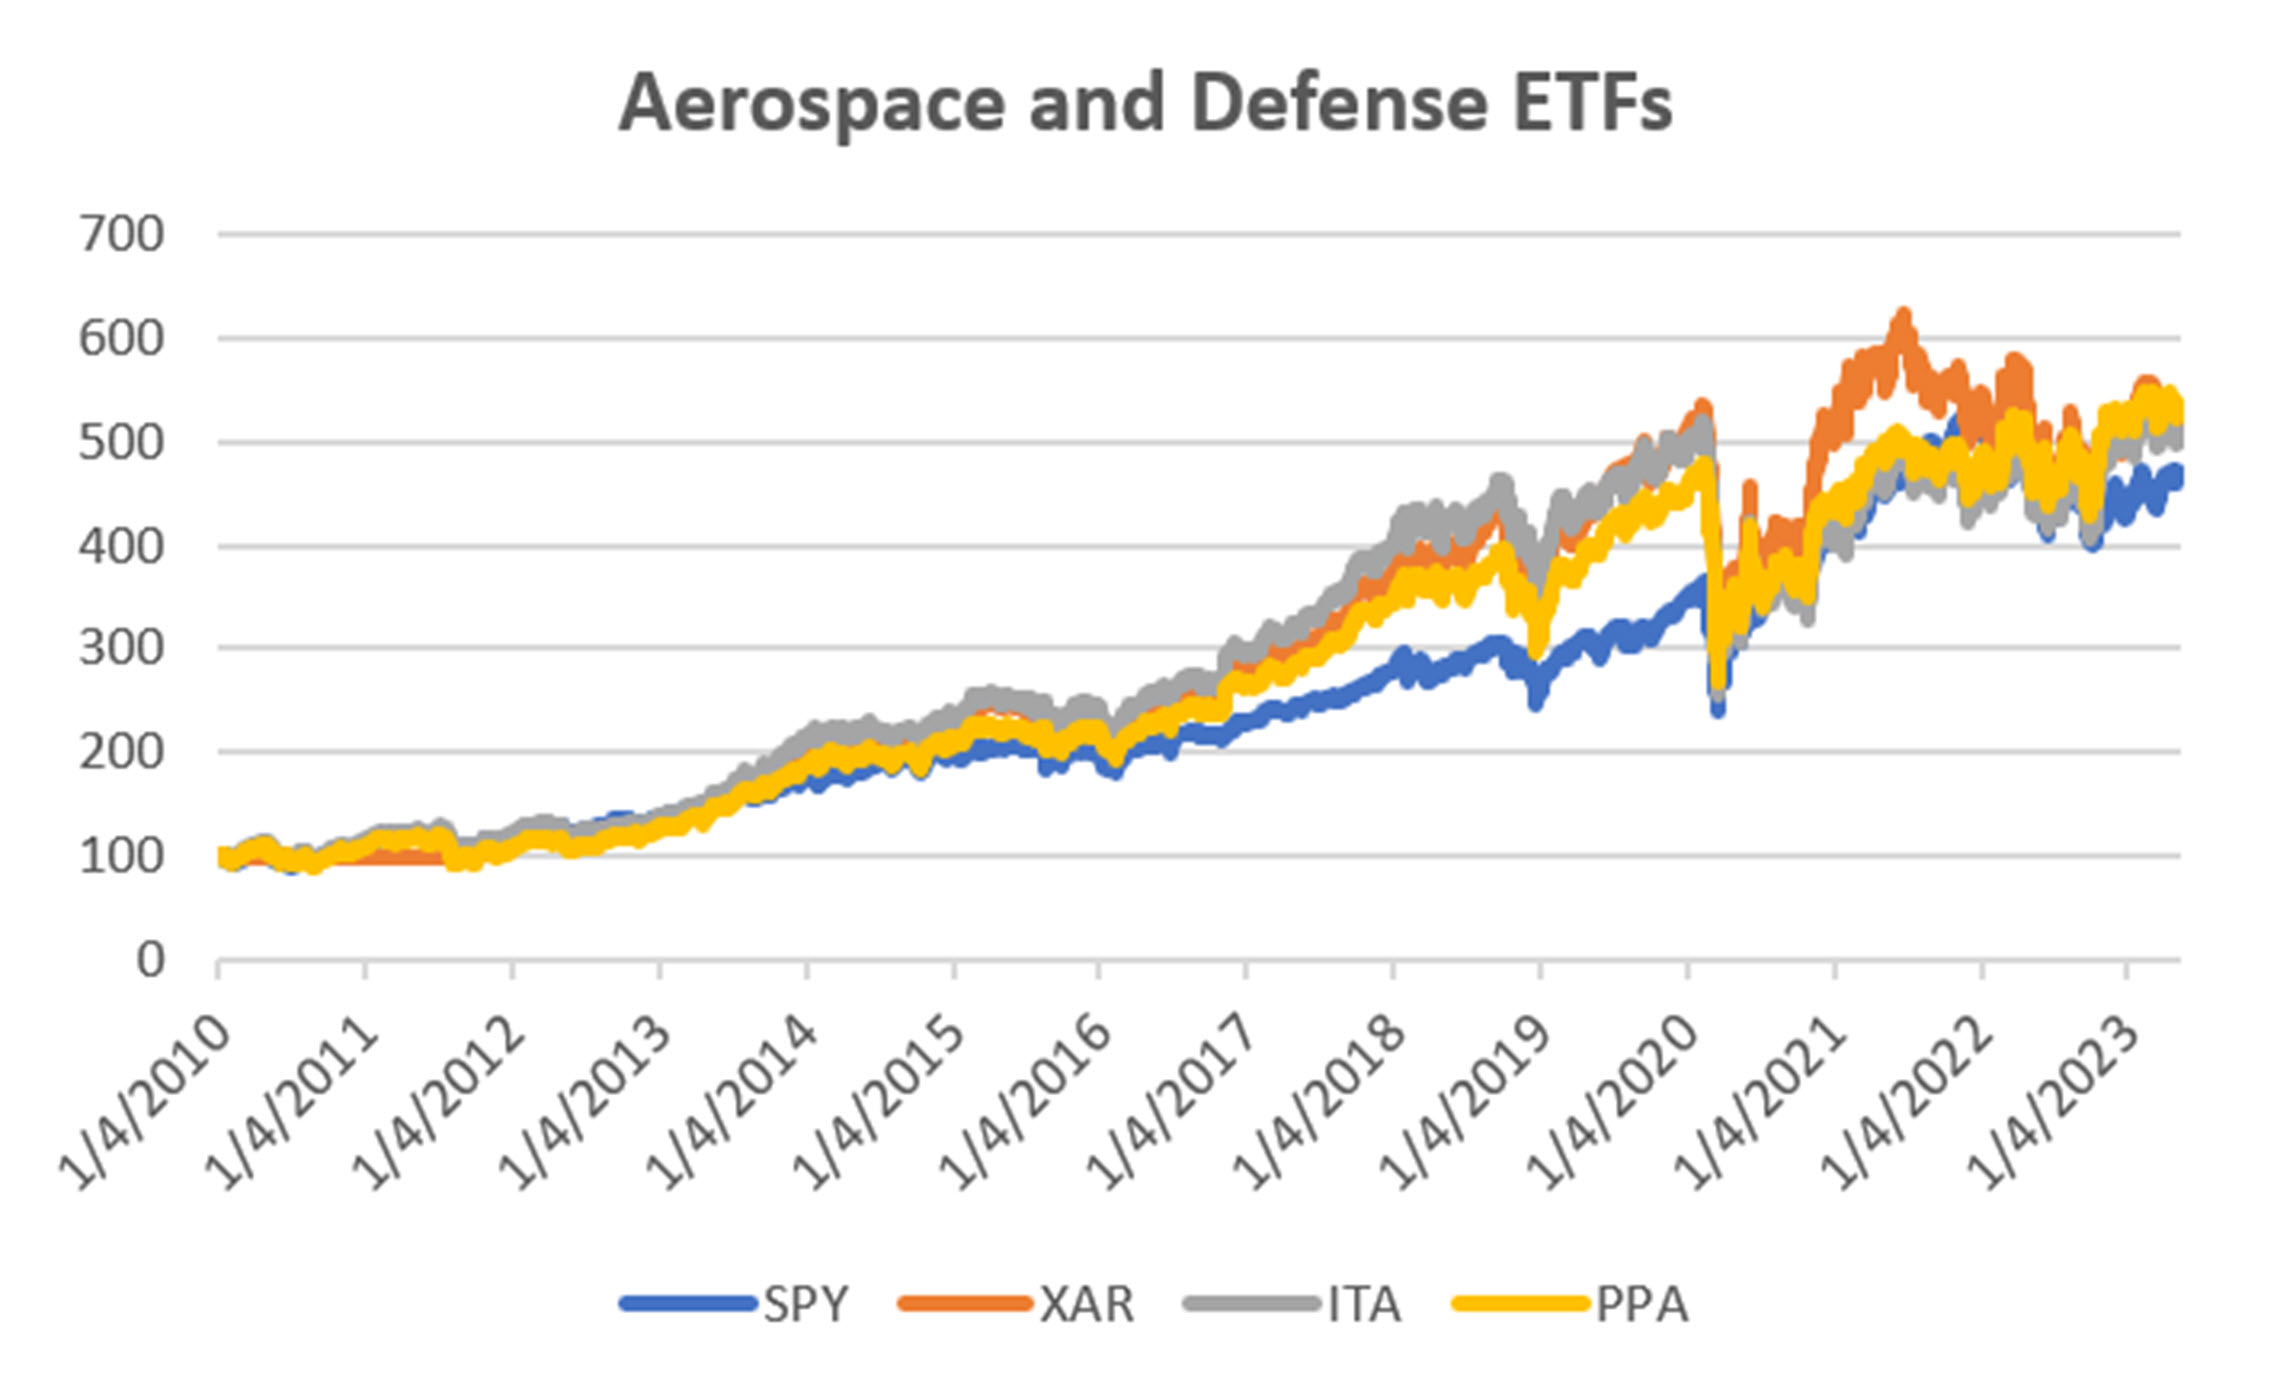
Chart 1. Aerospace and Defense ETFs.
It has always been my position that ETFs contain too many stocks, a large number of the doing nothing and not giving you a clear picture of the industry.
If have selected the stocks that I consider more relevant, General Dynamics (GD), Howmet Aerospace (HWM), Lockheed-Martin (LMT), Northrop-Grumman (NOC), Raytheon (RTX), and TransDigm (TDG). Chart 2 shows the individual performance of those stocks.
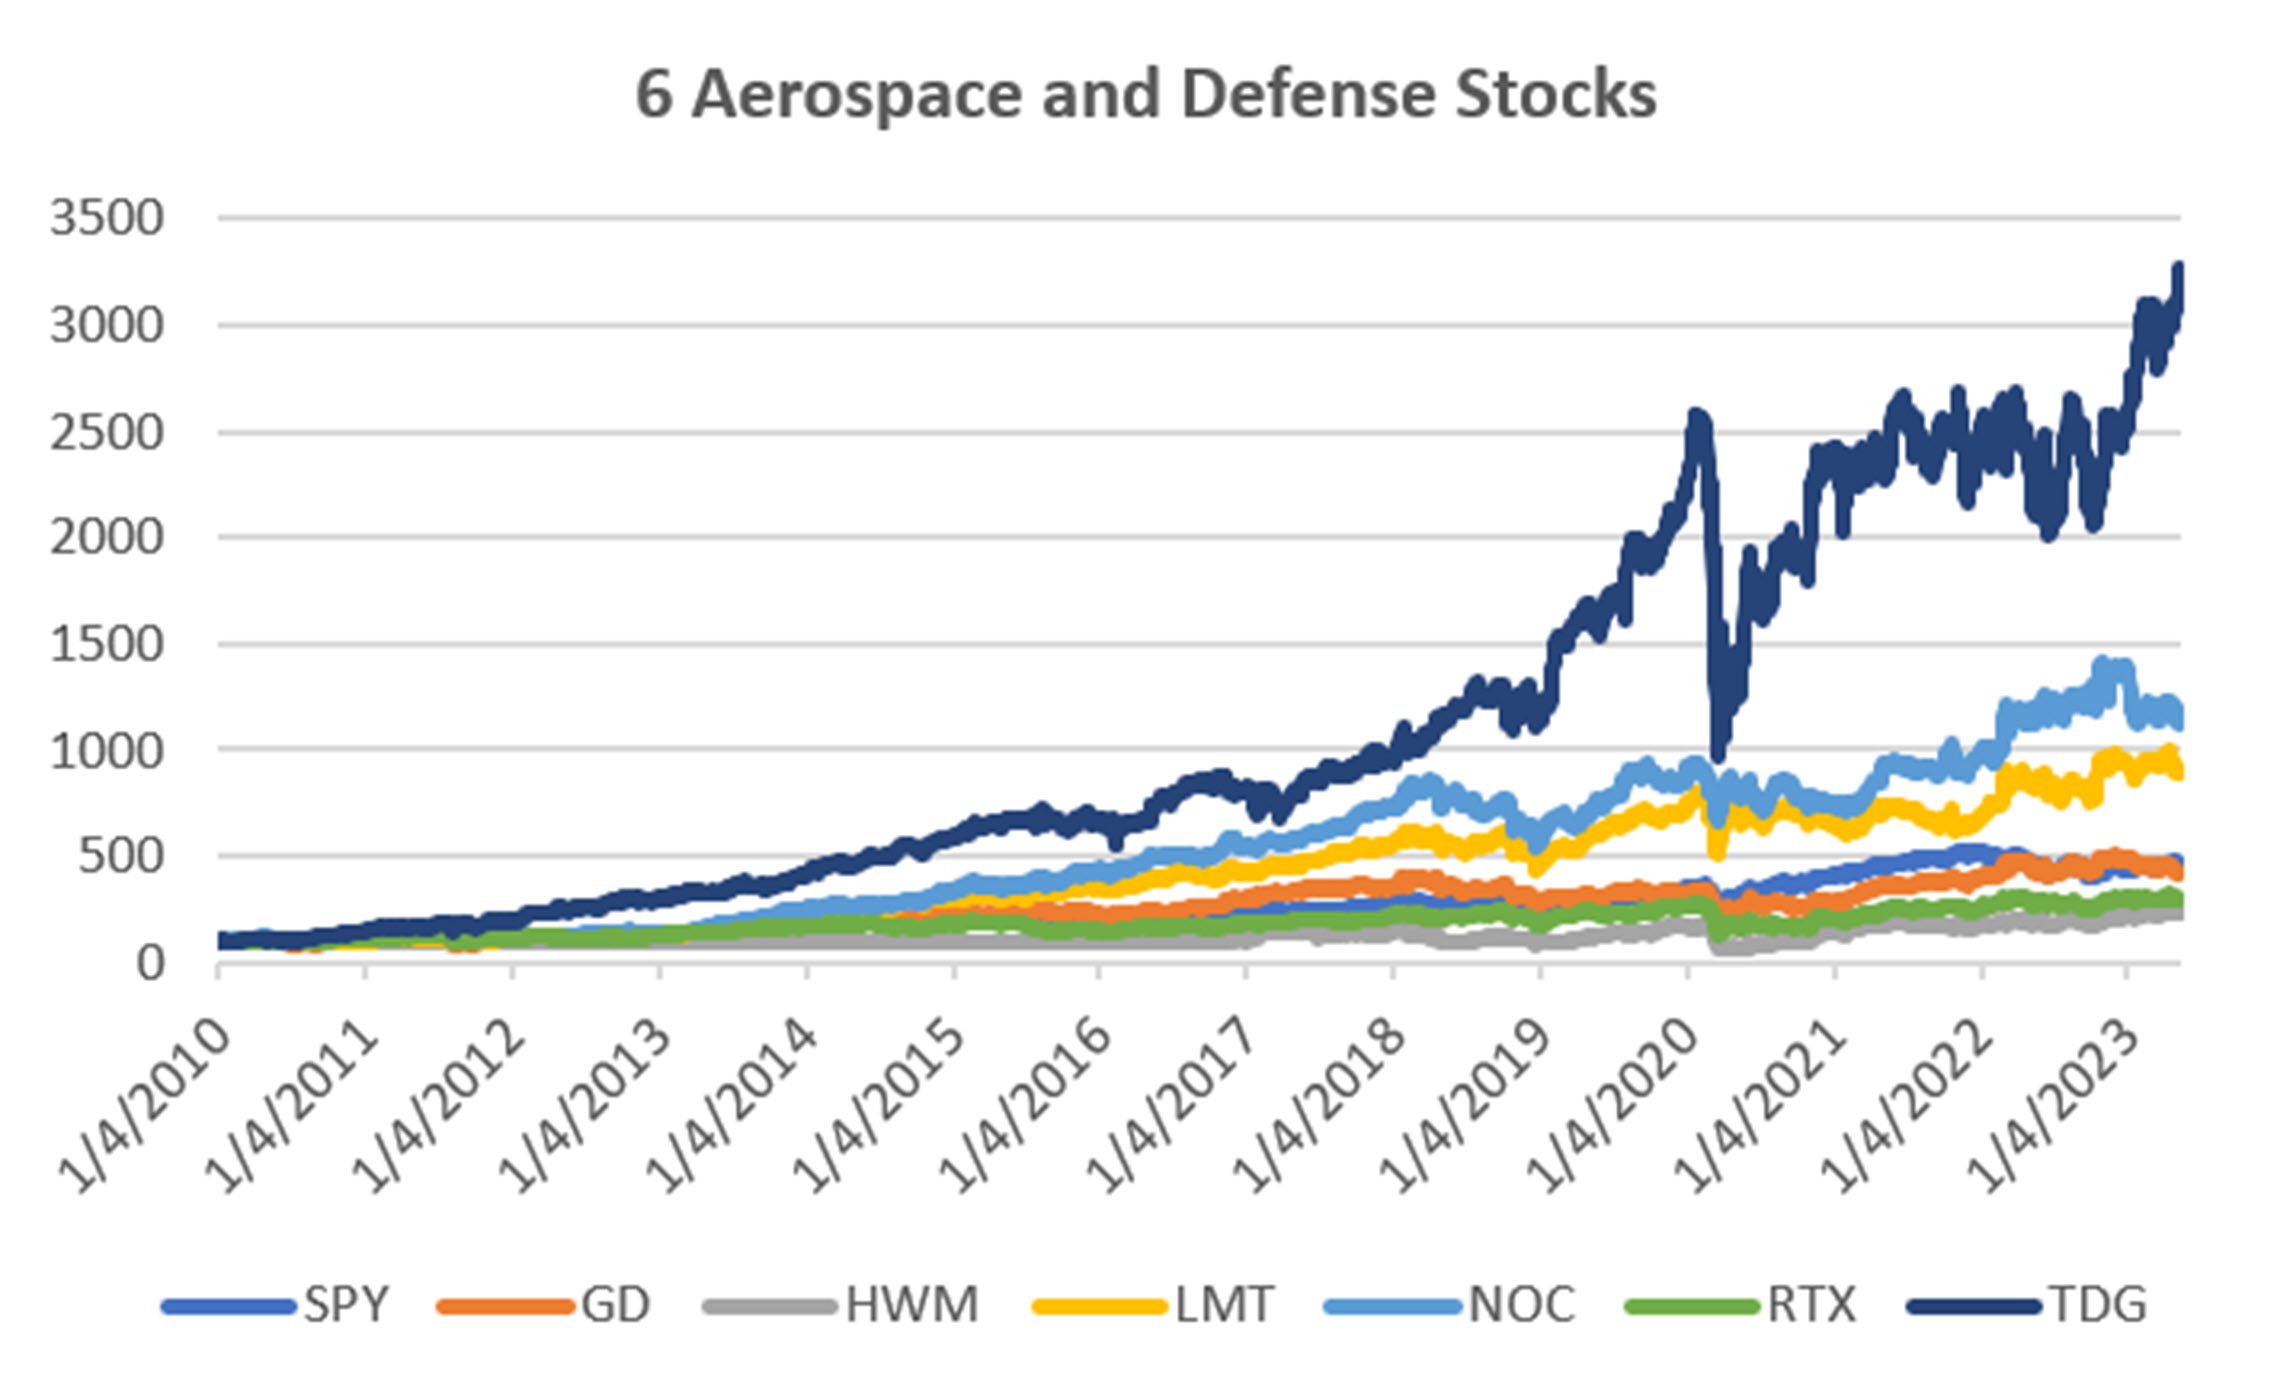
Chart 2. Six selected aerospace and defense stocks.
While TDG clearly outperforms, both NOC and LMT have better returns than SPY, and GD is about the same. Raytheon lags a bit.
If we now take those six stocks and equally weight them in a single mini-portfolio, we maximize the diversification and reduce the risk. Chart 3 shows the result. They far outperform the S&P. However, most of that is driven by TDG.
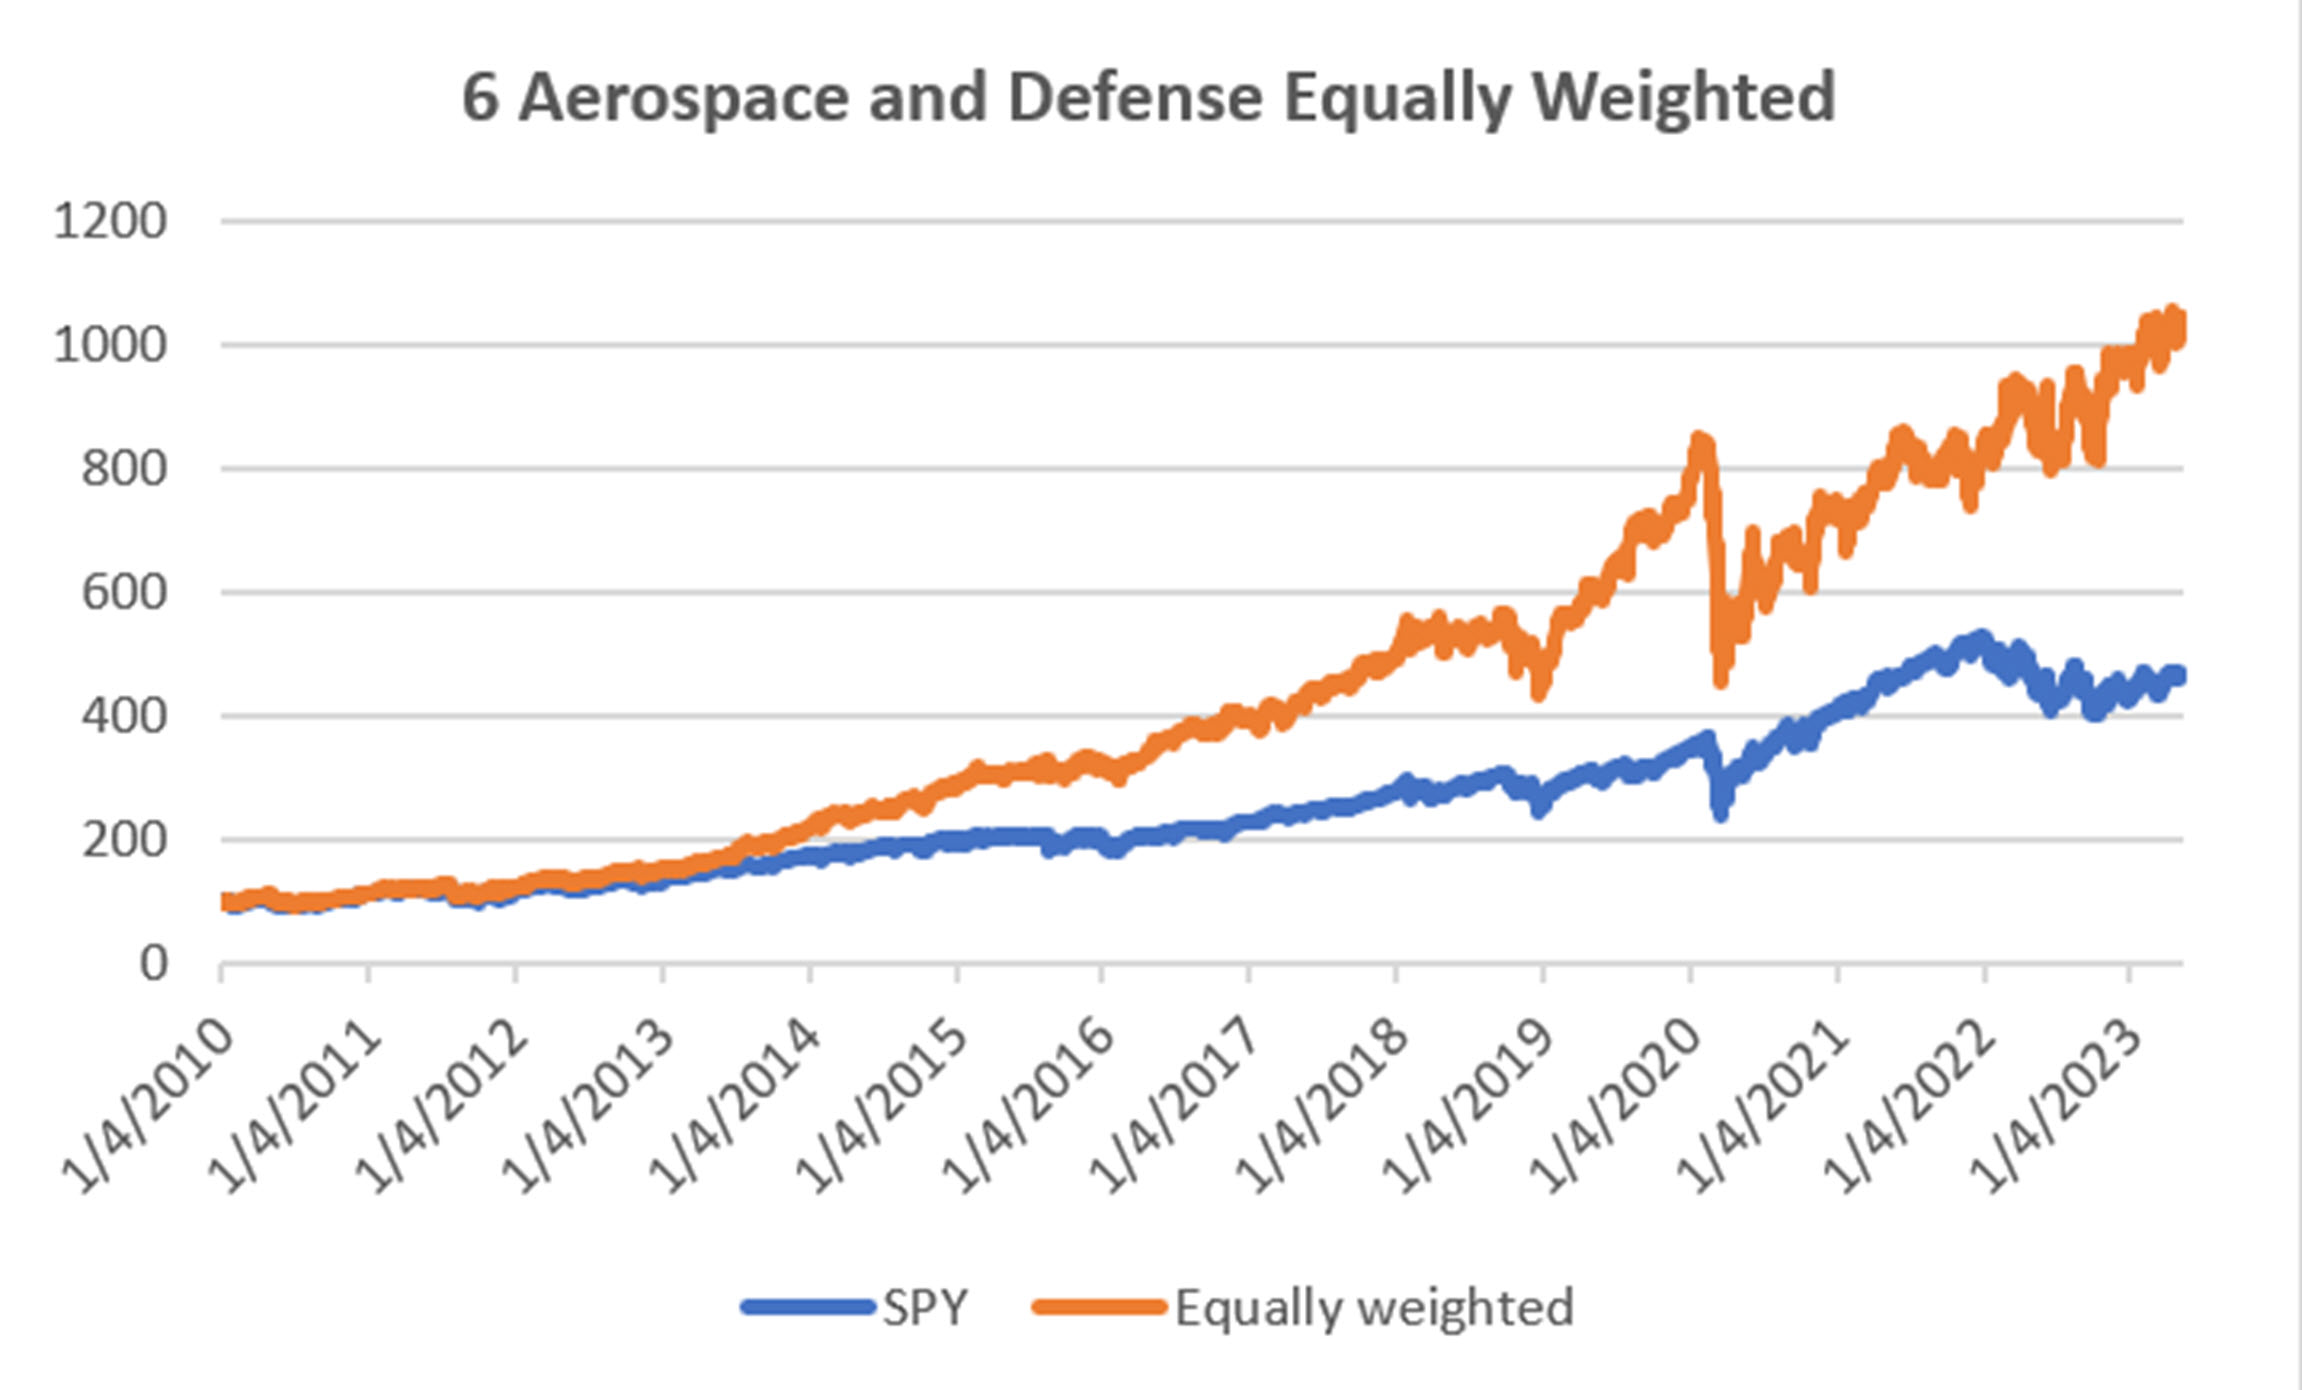
Chart 3. Six A&D stocks equally weighted compared to SPY.
Although TDG is a valid part of this group, Chart 4 shows the results of equally weighting the five other stocks without TDG.
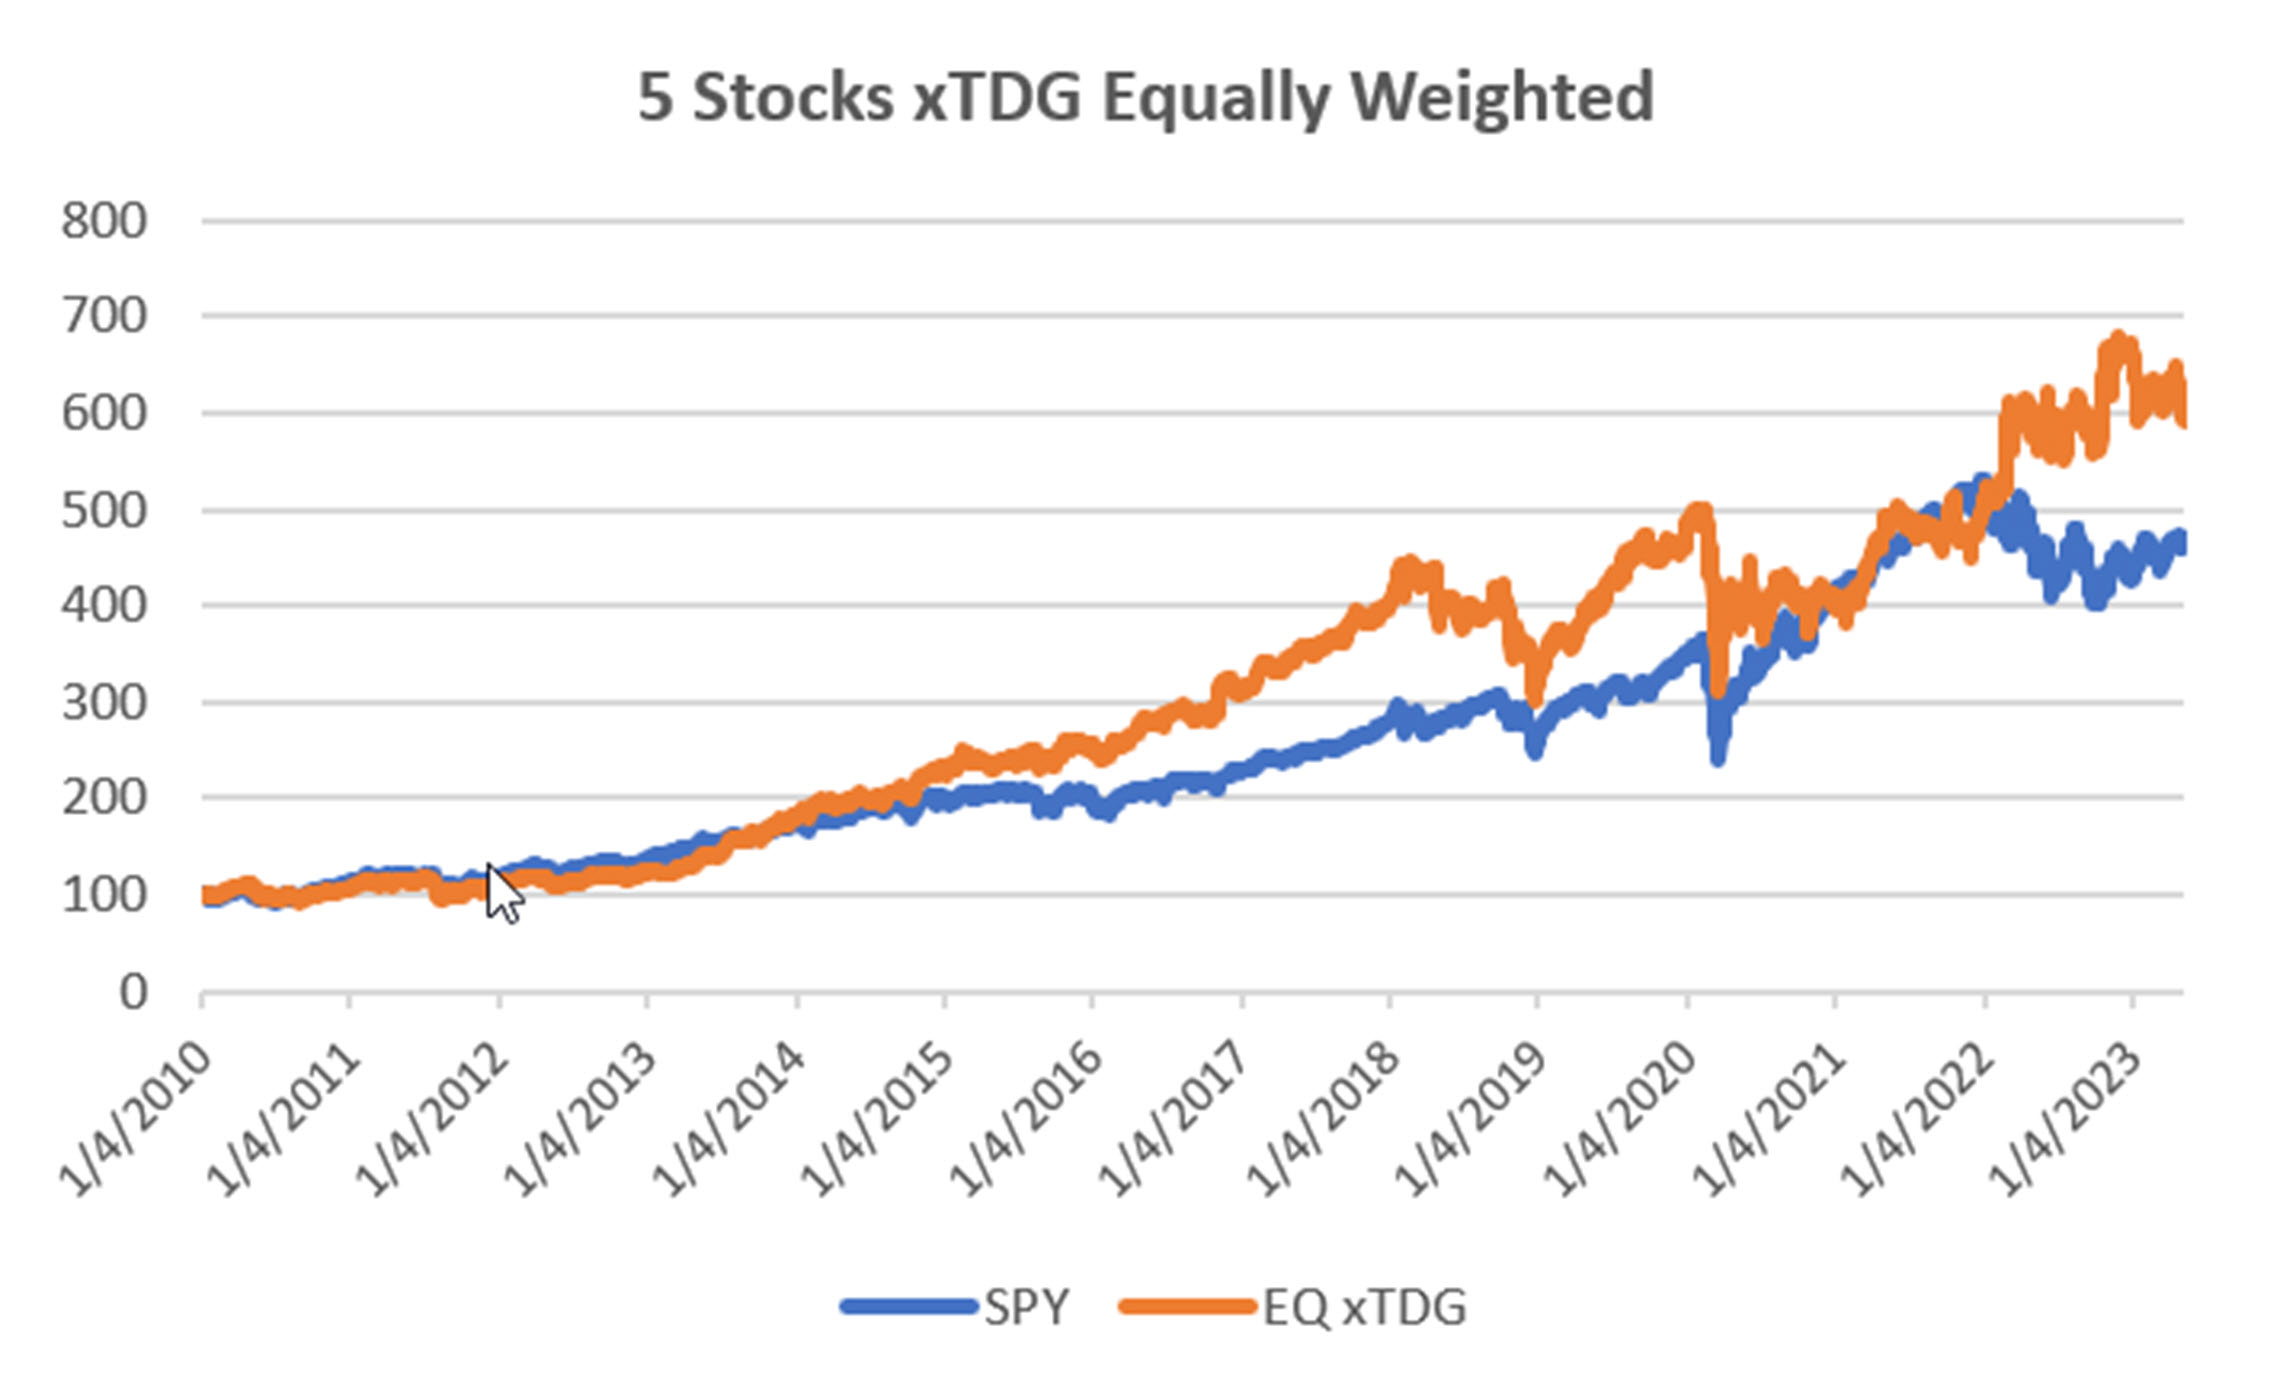
Chart 4. Five A&D stocks equally weighted.
The result is clearly not as good, but still outperforms SPY. Recently, as the full market declined, these defense stocks have moved higher. However, if we take away the best performing stock in our portfolio because it might not happen next time, we would be doing ourselves a disservice. Some stocks outperform others. Next time it could be NOC or LMT.
Safety When You Need It
Chart 4 shows that during the past year, A&D stocks would have provided a good return, offsetting the overall index. If we look back at the attack on September 11, 2001 we can see a more extreme example. All stocks sold off sharply except defense stocks. Commodities dropped but bonds rallied. Investors were selling stocks and buying into the safety of bonds.
Chart 5 shows the returns of SPY, LMT, and NOC during September of 2001. SPY dropped 15% while LMT gained 13% and NOC gained 22%. That’s a net difference of 28% and 37%. Of course, you would not be holding 50% of each, but even 5% or 10% would have offset a lot of losses.
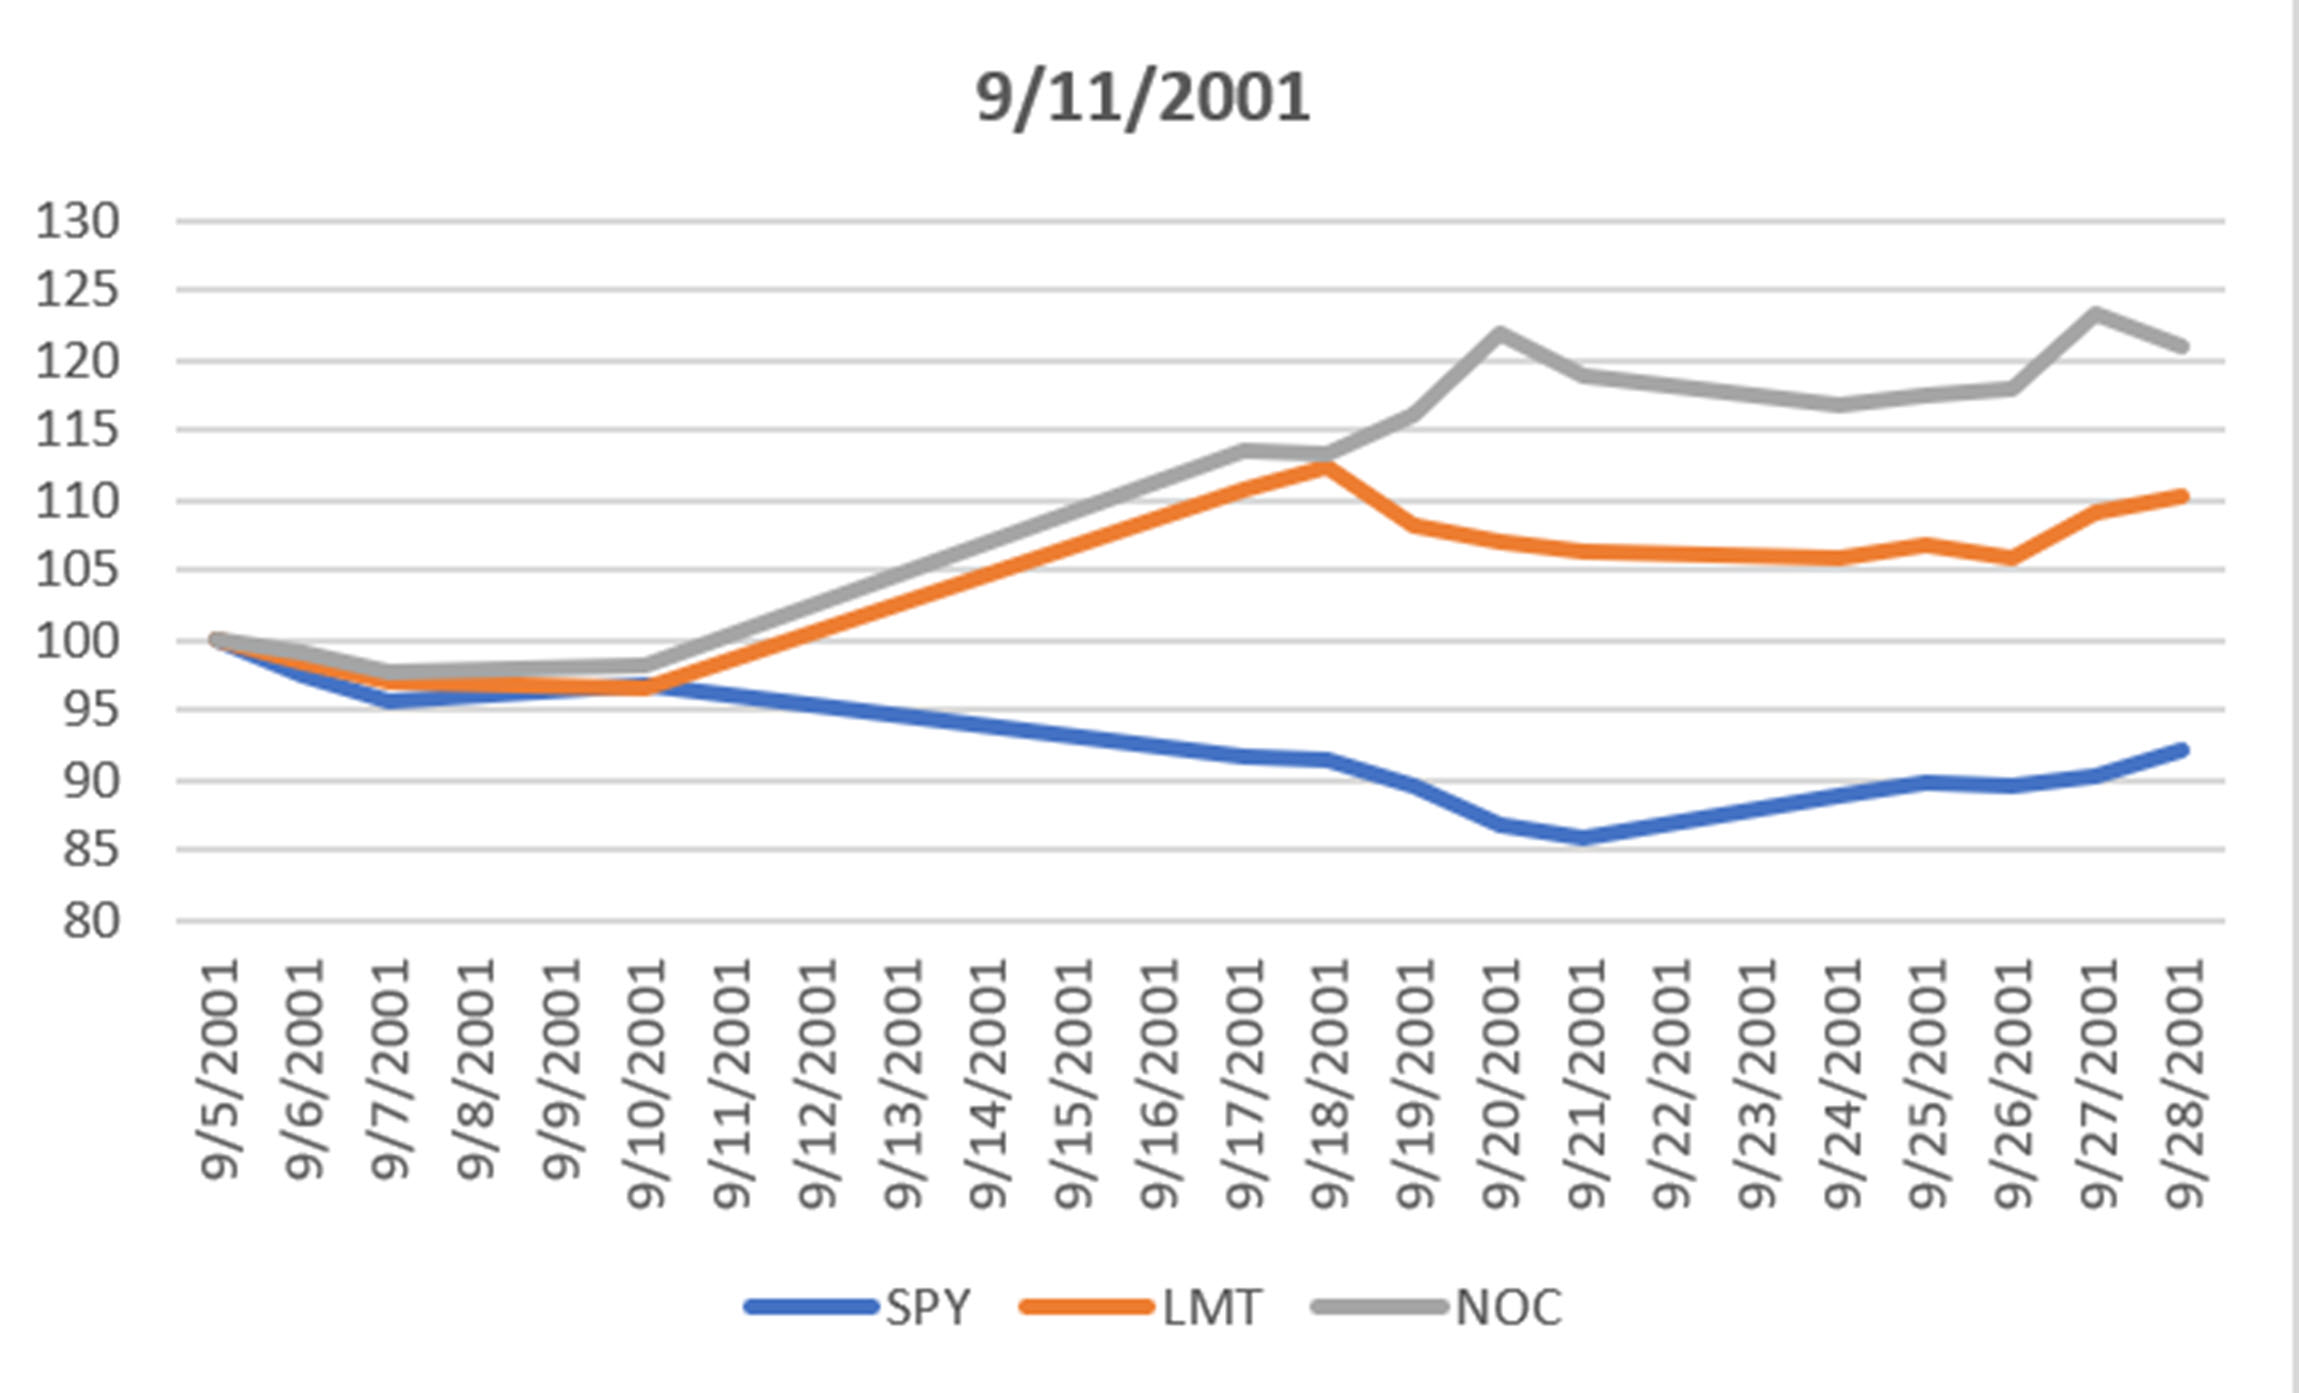
Chart 5. LMT and NOC compared to SPY in September 2001.
The Case for Defense Stocks
Until the world becomes friendlier, defense stocks are a good addition to any portfolio. In the current geopolitical environment, they seem even more important. I look forward to when they are not.
A Standing Note on Short Sales
Note that the “All Signals” reports show short sales in stocks and ETFs, even though short positions are not executed in the equity portfolios. Our work over the years shows that downturns in the stock market are most often short-lived and it is difficult to capture with a longer-term trend. The upwards bias also works against shorter-term systems unless using futures, which allows leverage. Our decision has been to take only long positions in equities and control the risk by exiting many of the portfolios when there is extreme volatility and/or an indication of a severe downturn.
PORTFOLIO METHODOLOGY IN BRIEF
Both equity and futures programs use the same basic portfolio technology. They all exploit the persistence of performance, that is, they seek those markets with good long-term and short-term returns on the specific system, rank them, then choose the best, subject to liquidity, an existing current signal, with limitations on how many can be chosen from each sector. If there are not enough stocks or futures markets that satisfy all the conditions, then the portfolio holds fewer assets. In general, these portfolios are high beta, showing higher returns and higher risk, but have had a history of consistently outperforming the broad market index in all traditional measures.
PERFORMANCE BY GROUP
NOTE that the charts show below represent performance “tracking,” that is, the oldest results since are simulated but the returns from 2013 are the systematic daily performance added day by day. Any changes to the strategies do not affect the past performance, unless noted. The system assumes 100% investment and stocks are executed on the open, futures on the close of the trading day following the signals. From time to time we make logic changes to the strategies and show how the new model performs.
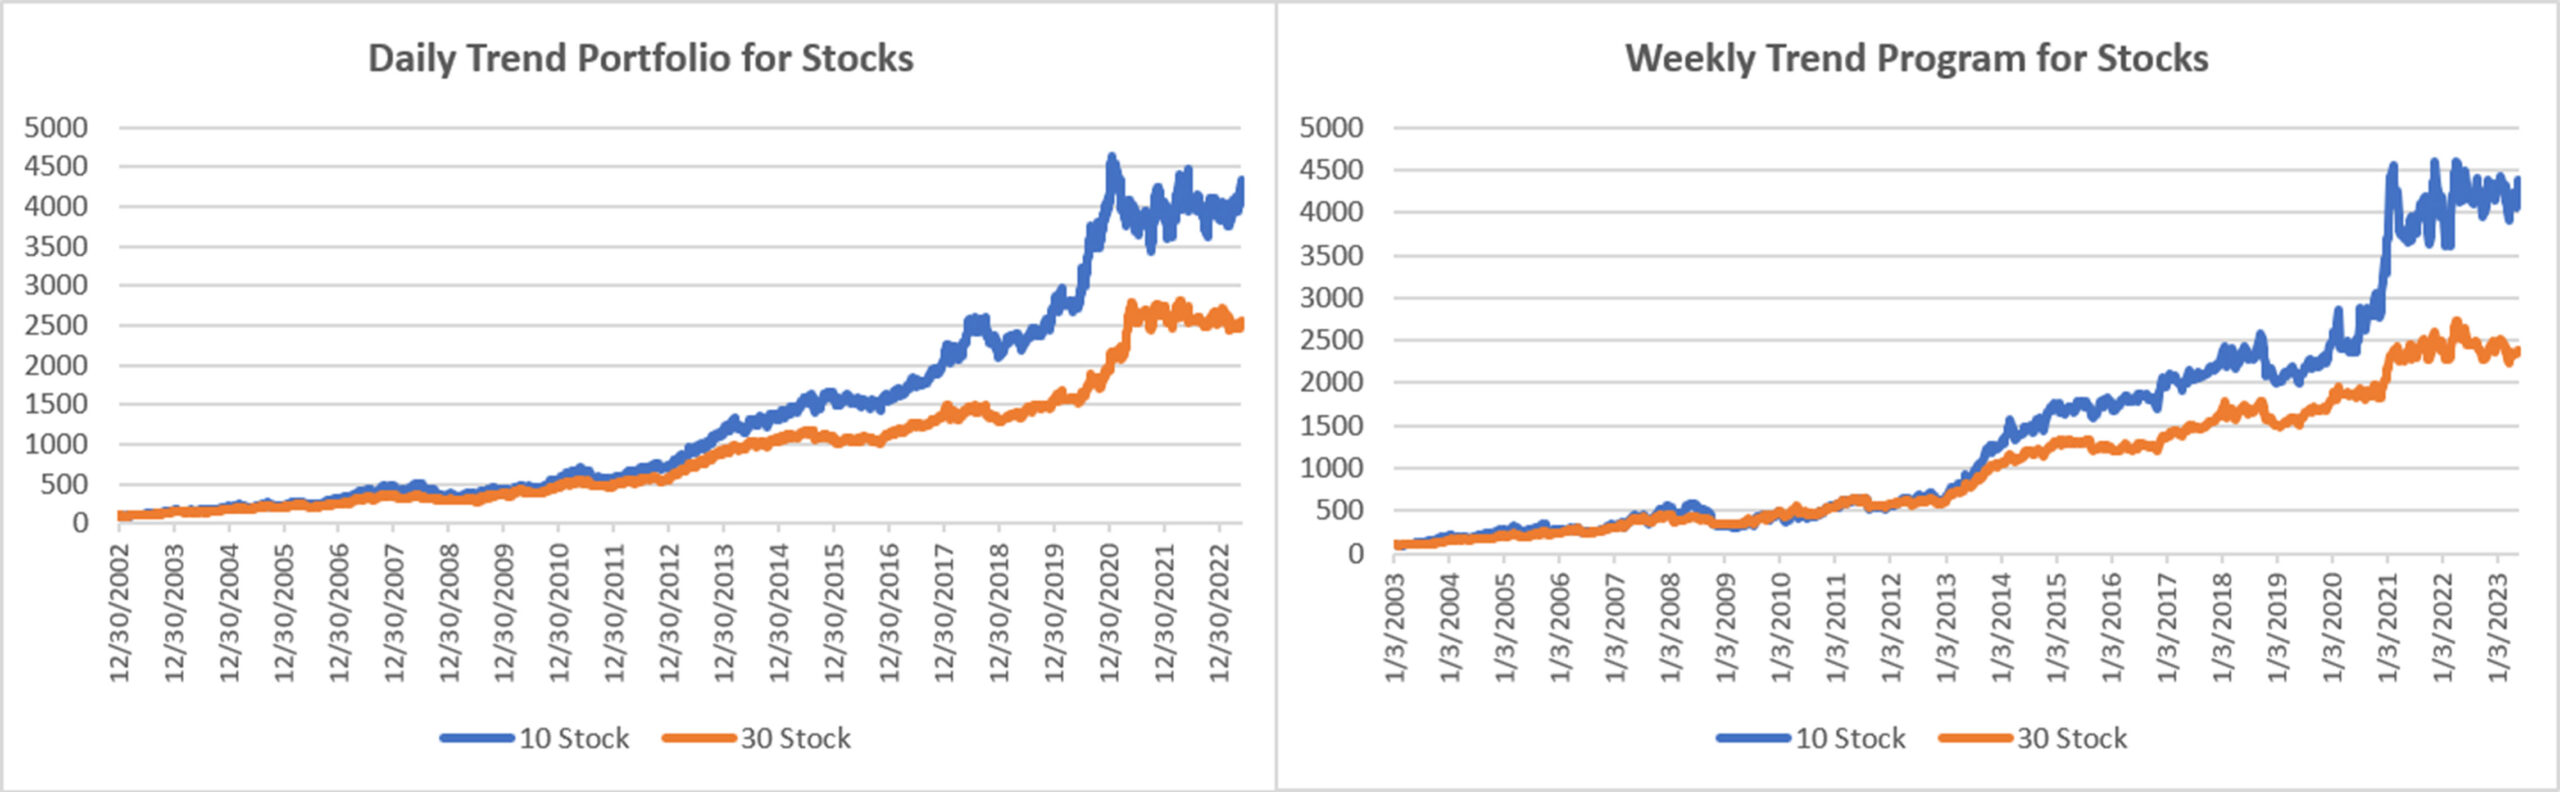
Groups DE1 and WE1: Daily and Weekly Trend Program for Stocks, including Income Focus, and DowHedge, and the new Sector Rotation
The Trend program seeks long-term directional changes in markets and the portfolios choose stocks that have realized profitable performance over many years combined with good short-term returns. It will hold fewer stocks when they do not meet our condition and exit the entire portfolio when there is extreme risk or a significant downturn.
The smaller 10-stock Daily and Weekly Trend portfolio both gain on Nvdia’s 30% jump, putting them well positive for the year. That profit was diluted in the 30-stock portfolios, which had good returns but well below the smaller portfolios. Both daily and weekly 10-stock programs are not approaching previous highs. It could be the long-awaited bull market.
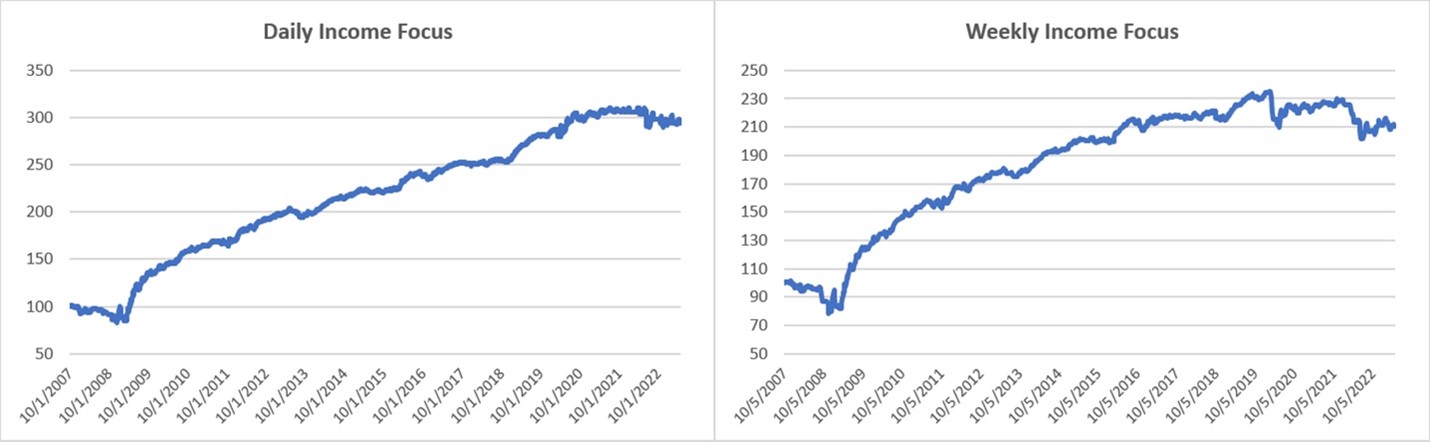
Income Focus and Sector Rotation
Another month of fighting the Fed but hope is in sight. Rumor is that the Fed will pause at the next meeting. If inflation declines and the Fed doesn’t raise rates at the next meeting, it will look like the end of the interest rate move. Meanwhile, the daily Income Focus program is holding up better than the weekly program and will be first to rally.
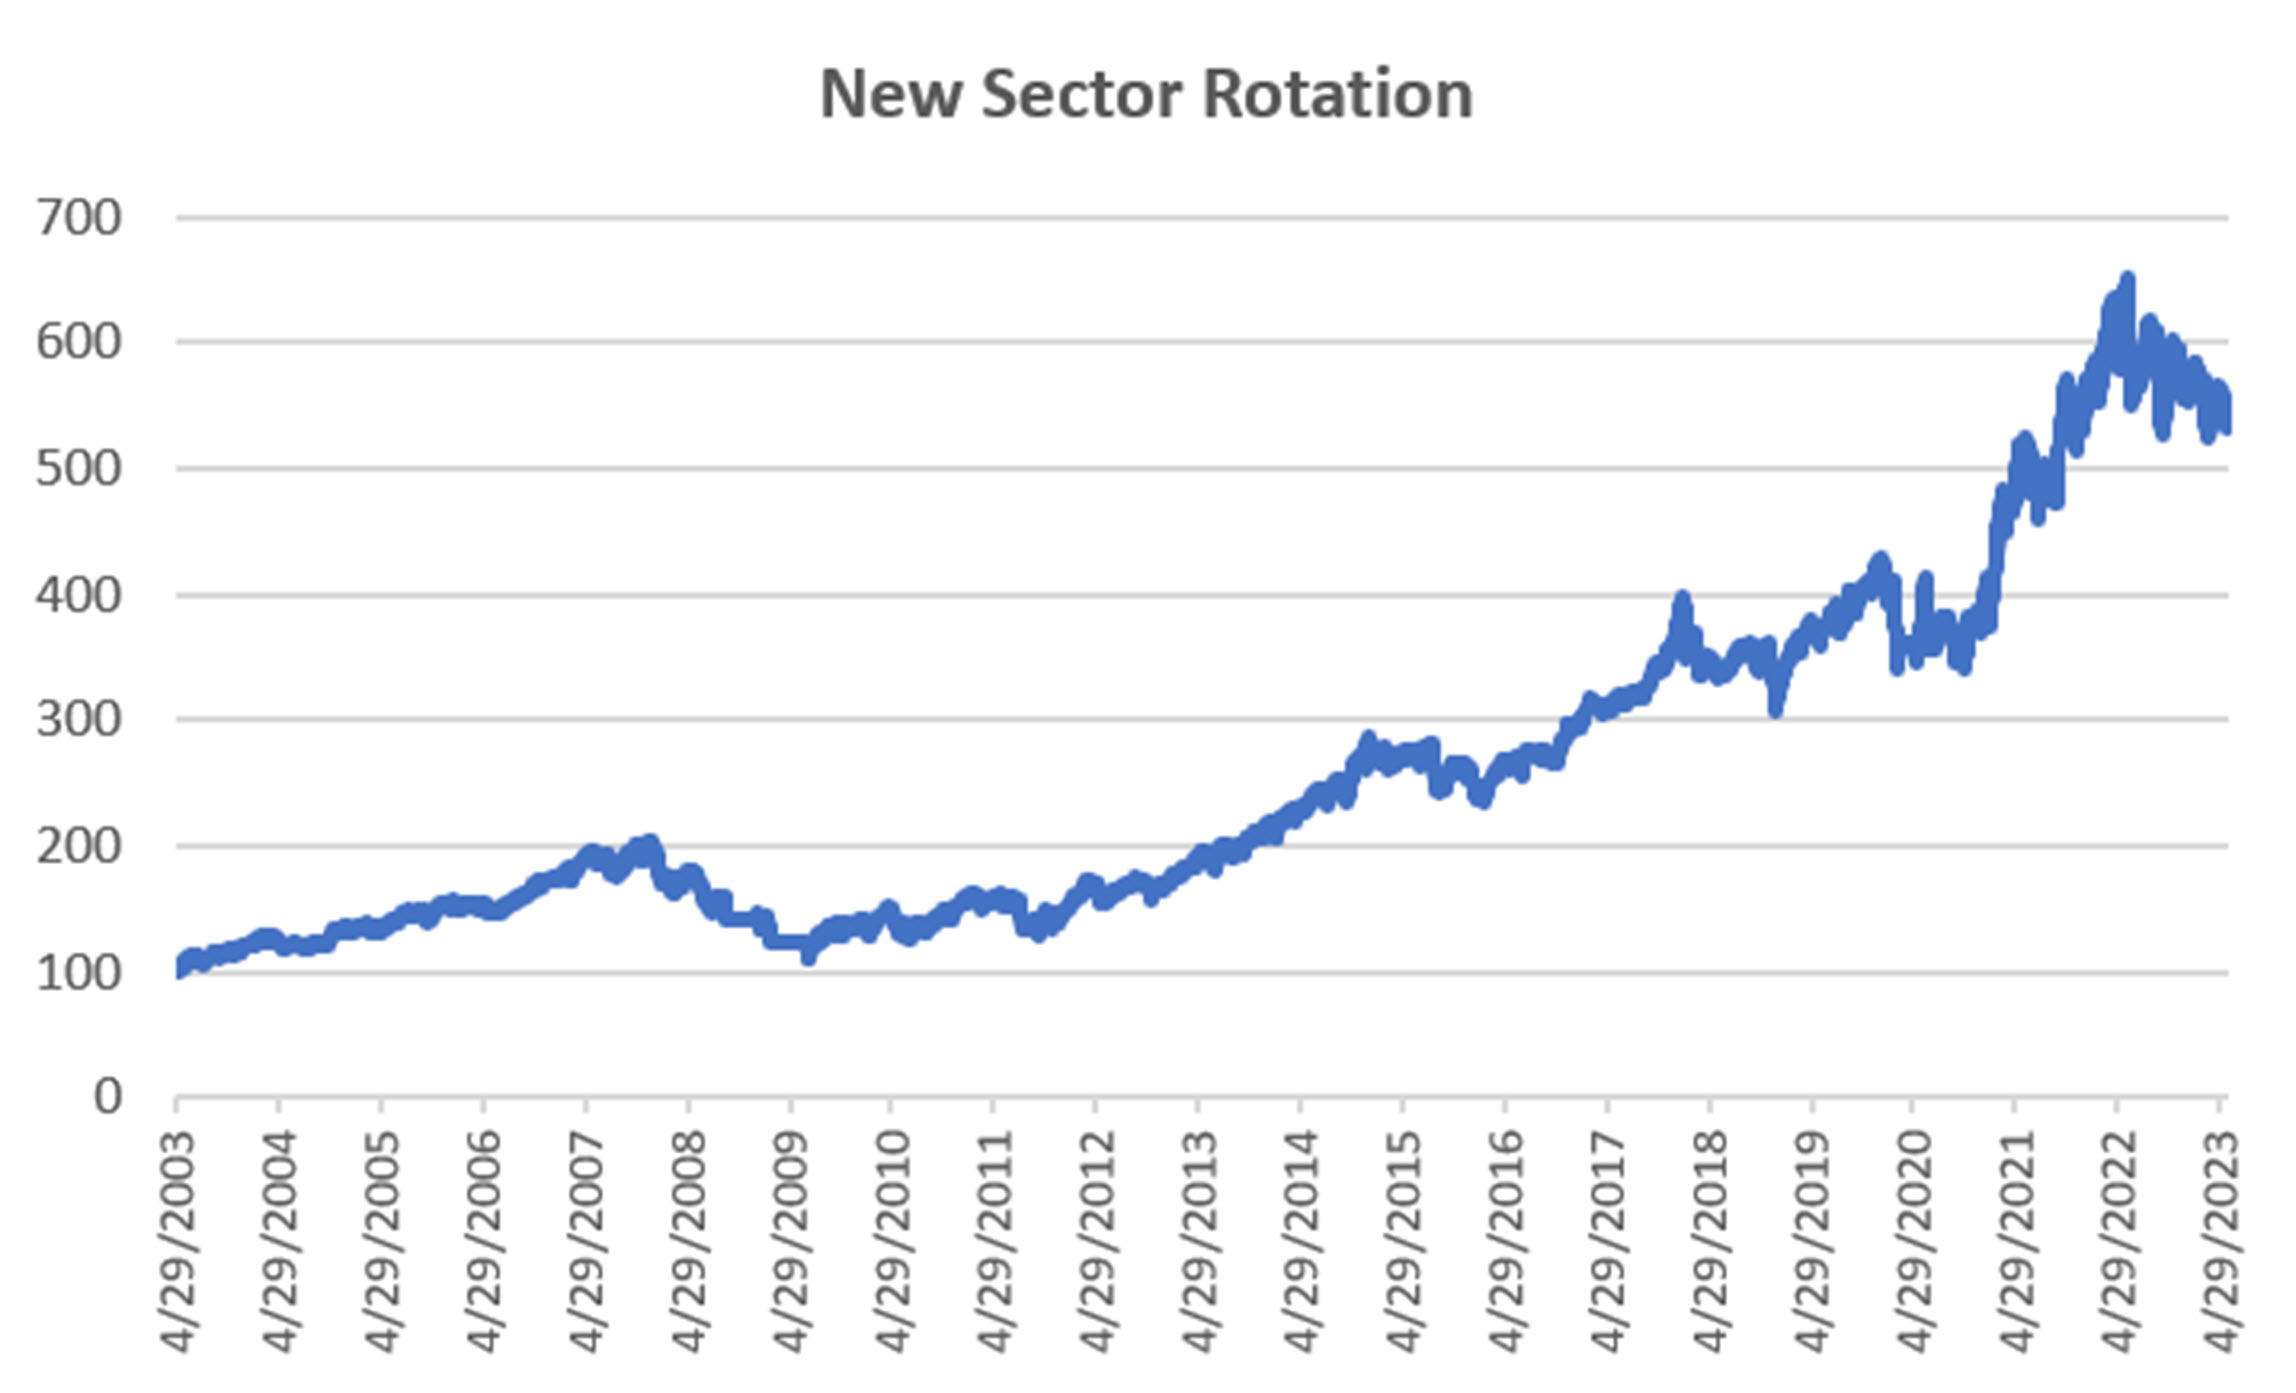
NEW Sector Rotation
A poor month for the Sector Rotation program, holding the same ETFs: Financials, Utilities, and Stables. What was good last month seems to be left behind. The program is close to switching off Materials for Staples, but no where near taking a position in Technology.
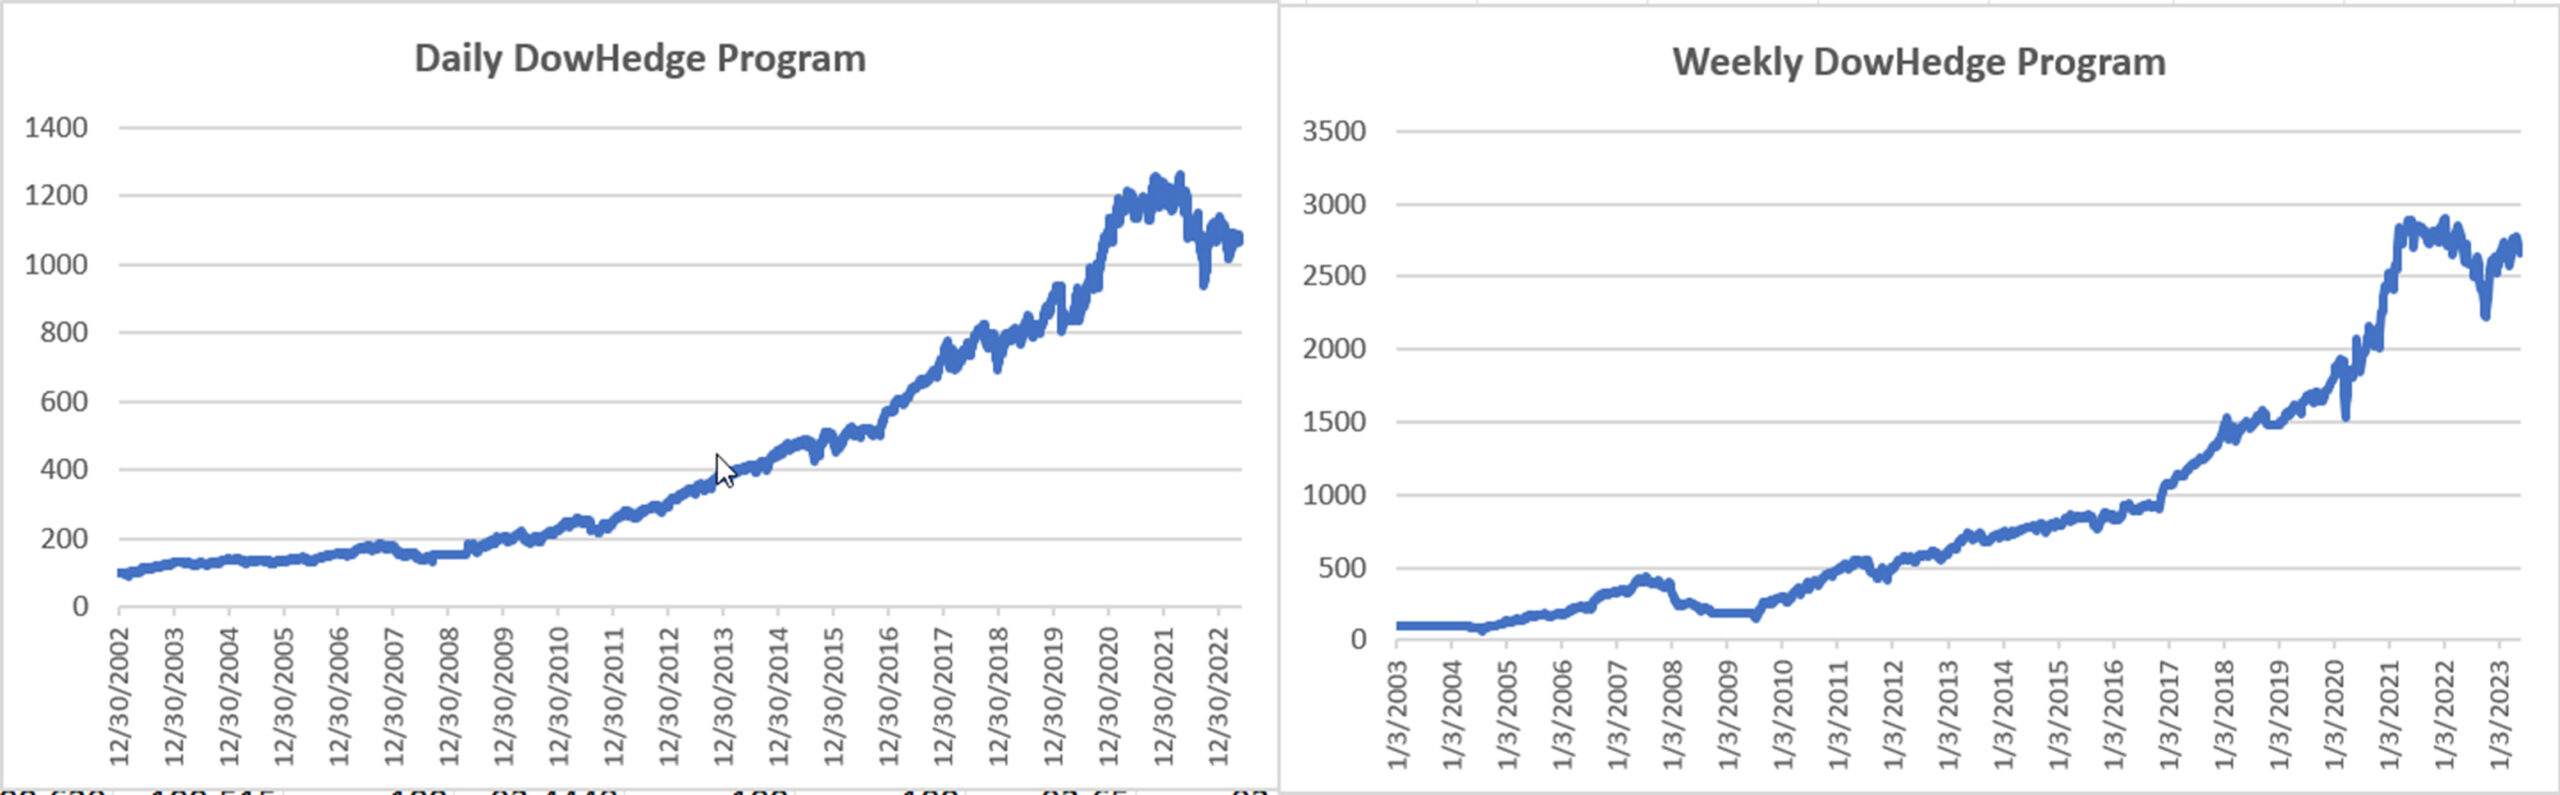
DowHedge Programs
The Weekly DowHedge portfolio is higher by 3.6% for the year, even after taking a 4% loss this month. The Daily program is essentially flat. The DOW has not been the recipient of the good news in AI. But has remained flat for the past six months, tending towards lower recently. Sometimes you just need to wait it out.
Group DE2: Divergence Program for Stocks
The Divergence program looks for patterns where price and momentum diverge, then takes a position in anticipation of the pattern resolving itself in a predictable direction, often the way prices had moved before the period of uncertainty.
The Daily Divergence portfolio is struggling a bit more than the Weekly portfolio. It depends on finding the trend, then capturing a pause before the trend resumes. Hopefully, that scenario will appear soon!

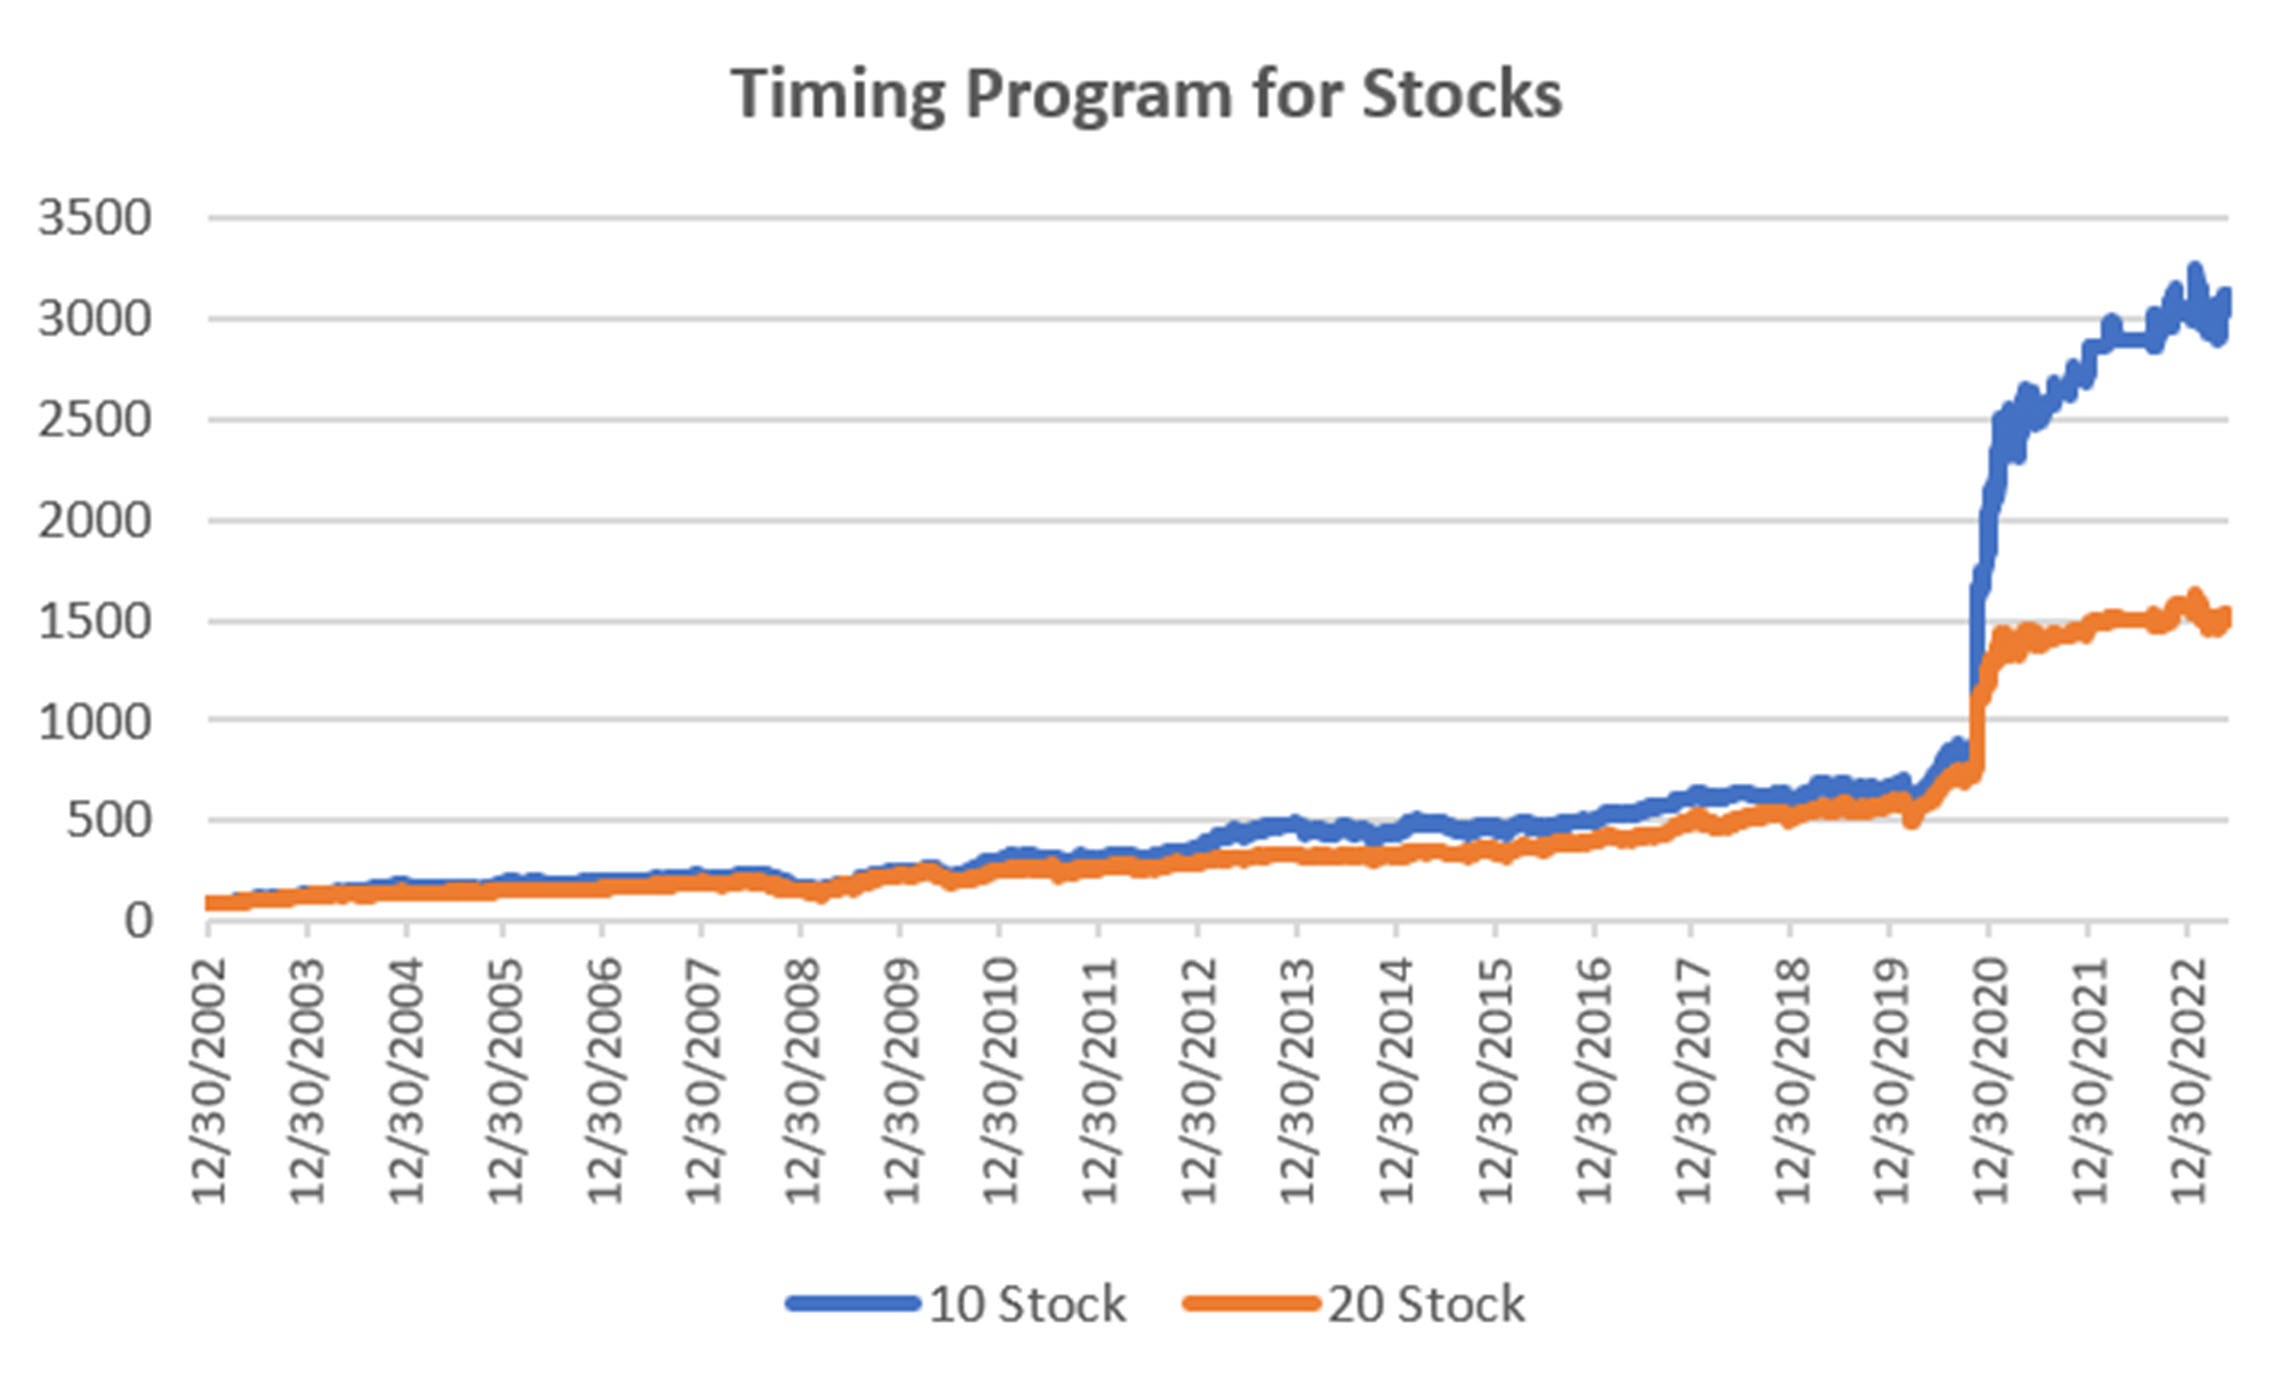
Group DE3: Timing Program for Stocks
The Timing program is a relative-value arbitrage, taking advantage of undervalued stocks relative to its index. It first finds the index that correlates best with a stock, then waits for an oversold indicator within an upwards trend. It exits when the stock price normalizes relative to the index, or the trend turns down. These portfolios are long-only because the upwards bias in stocks and that they are most often used in retirement accounts.
Gains of 2% still leave this program hovering on both sizes of breakeven. While it has not been able to find stocks to buy on a pullback – then rally – it has held very steady. It needs a trend to move to new highs.
Futures Programs
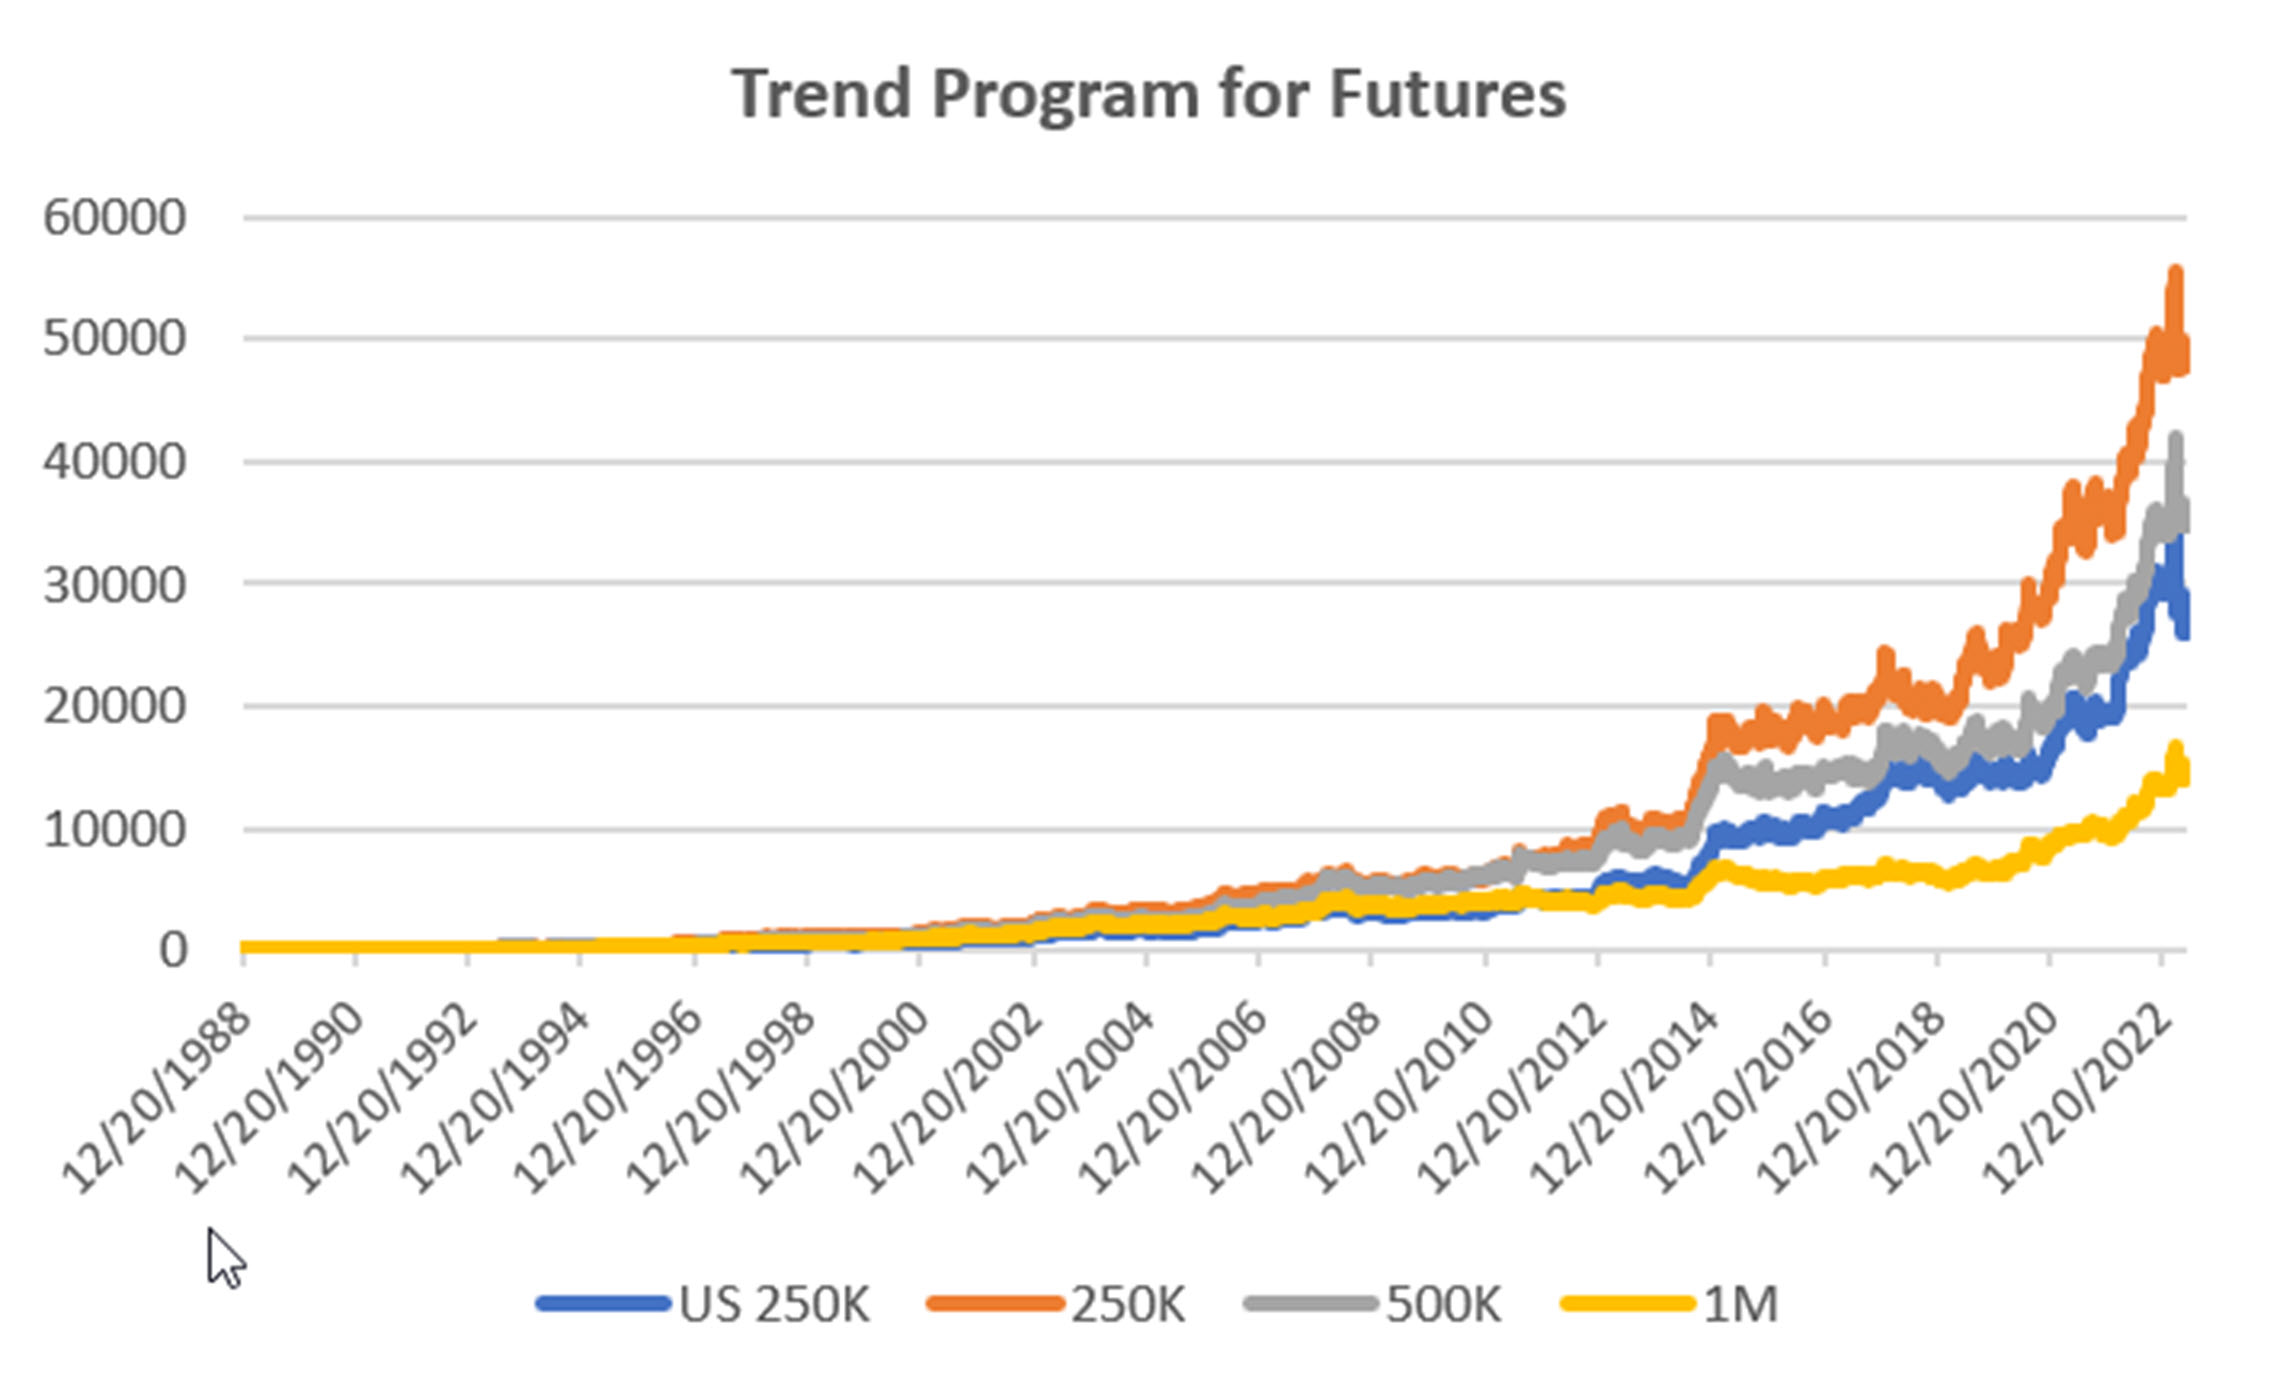
Groups DF1 and WF1: Daily and Weekly Trend Programs for Futures
Futures allow both high leverage and true diversification. The larger portfolios, such as $1million, are diversified into both commodities and world index and interest rate markets, in addition to foreign exchange. Its performance is not expected to track the U.S. stock market and is a hedge in every sense because it is uncorrelated. As the portfolio becomes more diversified its returns are more stable.
The leverage available in futures markets allows us to manage the risk in the portfolio, something not possible to the same degree with stocks. This portfolio targets 14% volatility. Investors interested in lower leverage can simply scale down all positions equally in proportion to their volatility preference. Note that these portfolios do not trade Asian futures, which we believe are more difficult for U.S. investors to execute. The “US 250K” portfolio trades only U.S. futures.
The Futures Trend program was mixed in May, having gotten rid of the interest rate positions that had caused a price shock two months ago. The big picture looks good but we need an end to the Fed rate hikes to allow the market to start trending. We may not see it in rates first. The equity market and energy should rally as the economic starts to bubble.
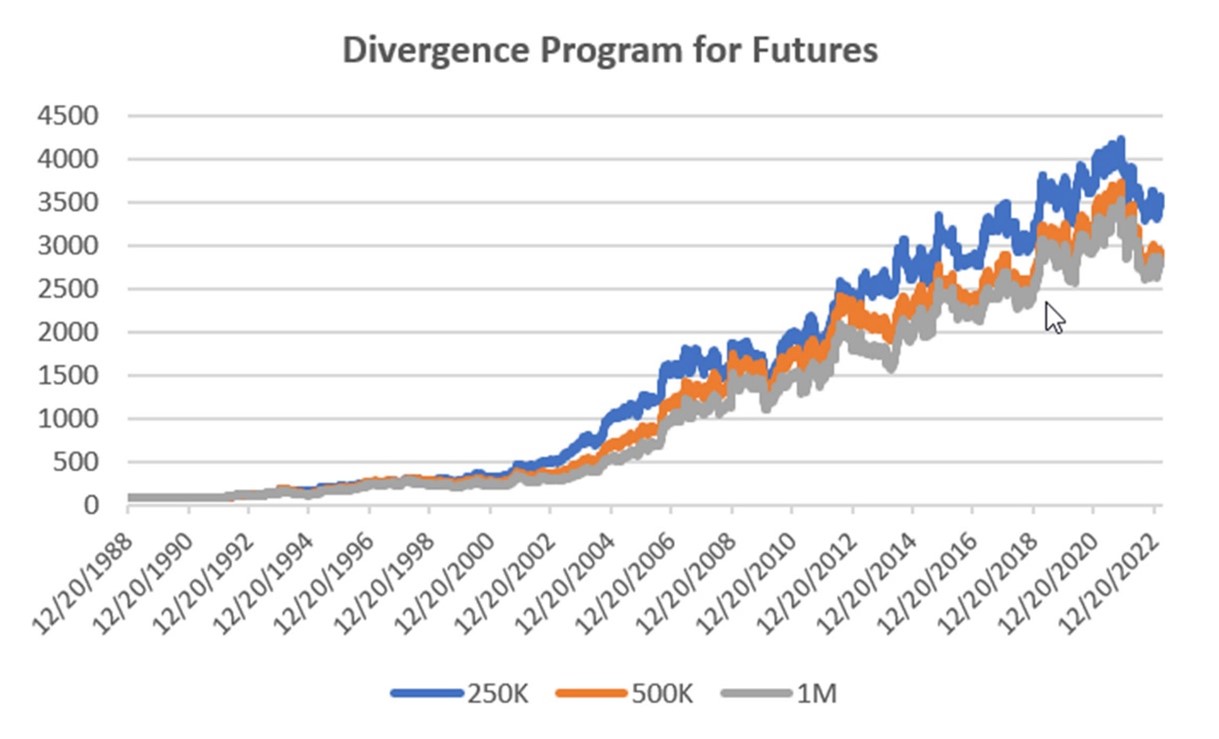
Group DF2: Divergence Portfolio for Futures
Fractional losses in May leaves this program at breakeven for all portfolios. Just like the equity version, we need a trend and a pause in that trend in order to capture short-term gains. Holding even is a good result for a market with no sustained trends.
Blogs and Recent Publications
Perry’s books are all available on Amazon or through our website, www.kaufmansignals.com.
May 2023
A new post on Seeking Alpha, “Profiting From Green Energy – But Not EVs” on May 31. Shows which stocks are best for investing in energy given the moving targets.
April 2023
On April 18th, Perry gave a webinar to the Society of Technical Analysts (London) on how to develop and test a successful trading system. Check their website for more details, https://www.technicalanalysts.com..
The April issue of Technical Analysis of Stocks & Commodities published a new article by Perry, “Repatriation,” an interesting trading pattern used by FX traders but adapted for us “normal traders.”
March 2023
Perry was interviewed by Mark Ursell of Ursell of TradeInform on March 3. You can see it or listen to it on UTube https://www.youtube.com/watch?v=9gIlIIzngCk. Or, you can listen to it at
A new article by Perry, “Can Volume Predict Price?” in the March issue of Technical Analysis of Stocks & Commodities. You’ll need to read it to find out!
February 2023
The February 2023 issue of Technical Analysis of Stocks & Commodities published Perry’s article, “Do Small Price Changes Matter?” It tells you whether you should be ignoring those days when prices close up or down by a fraction.
Perry gave a webinar to Eduardo Lopez’ Robotrader students in Spain on Wednesday, February 8, noon (New York).
January 2023
Another year! Technical Analysis of Stocks & Commodities published “Matching the Markets to the Strategy” in the January issue. It is a look at why certain markets do best with specific strategies and why that can materially improve results.
Alejandro de Luis will publish Perry’s article “Living Off Profits,” translated into Spanish, in the January issue of his magazine, Hispatrading. It’s a good way to practice your Spanish!
Seeking Alpha posted Perry’s article, “How To Hedge Your Equity Portfolio,” showing a way to follow the Fed action.
October 2022
An interview with Perry was featured in the October anniversary issue of Technical Analysis of Stocks & Commodities. The interviewer is his wife, Barbara Diamond, giving a different perspective on his career.
September 2022
“The Real Risk of System Trading” can be found in the September issue of Technical Analysis of Stocks & Commodities. It summarizes the many way we can measure risk and suggests ways that will help you.
July 2022
The basis for this month’s Close-Up was posted on Seeking Alpha June 16. This month, Perry posted “3 Ways to Reduce Risk and 2 Ways to Increase Profits.”
June 2022
The July issue of Technical Analysis of Stocks & Commodities has Perry’s latest article, “Is It Too Volatile to Trade?” It is important to understand when the risk is greater than the reward.
Perry posted “How To Tell When the Bear Market Has Ended” on Seeking Alpha. You might find it useful if you are thinking about getting back in.
Older Items of Interest
Perry’s webinar on risk, given to the U.K. Society of Technical Analysts, can be seen using the following link: https://vimeo.com/708691362/04c8fb70ea
For older articles please scan the websites for Technical Analysis of Stocks & Commodities, Modern Trader, Seeking Alpha, ProActive Advisor Magazine, and Forbes. You will also find recorded presentations given by Mr. Kaufman at BetterSystemTrader.com, TalkingTrading.com, FXCM.com, systemtrade.pl, the website for Alex Gerchik, Michael Covel’s website, TrendFollowing.com, and Talking Trading.com.
In May 2021, Mr. Kaufman gave a 30-minute presentation, “Lagged Trends,” for The Money Show on Tuesday, May 11. You can see it using the following link: https://youtu.be/bh2fA8oBwBk
You will also find back copies of our “Close-Up” reports on our website, www.kaufmansignals.com. You can address any questions to perry@kaufmansignalsdaily.com.
© May 2023, Etna Publishing, LLC. All Rights Reserved.