

Industry Benchmark Performance
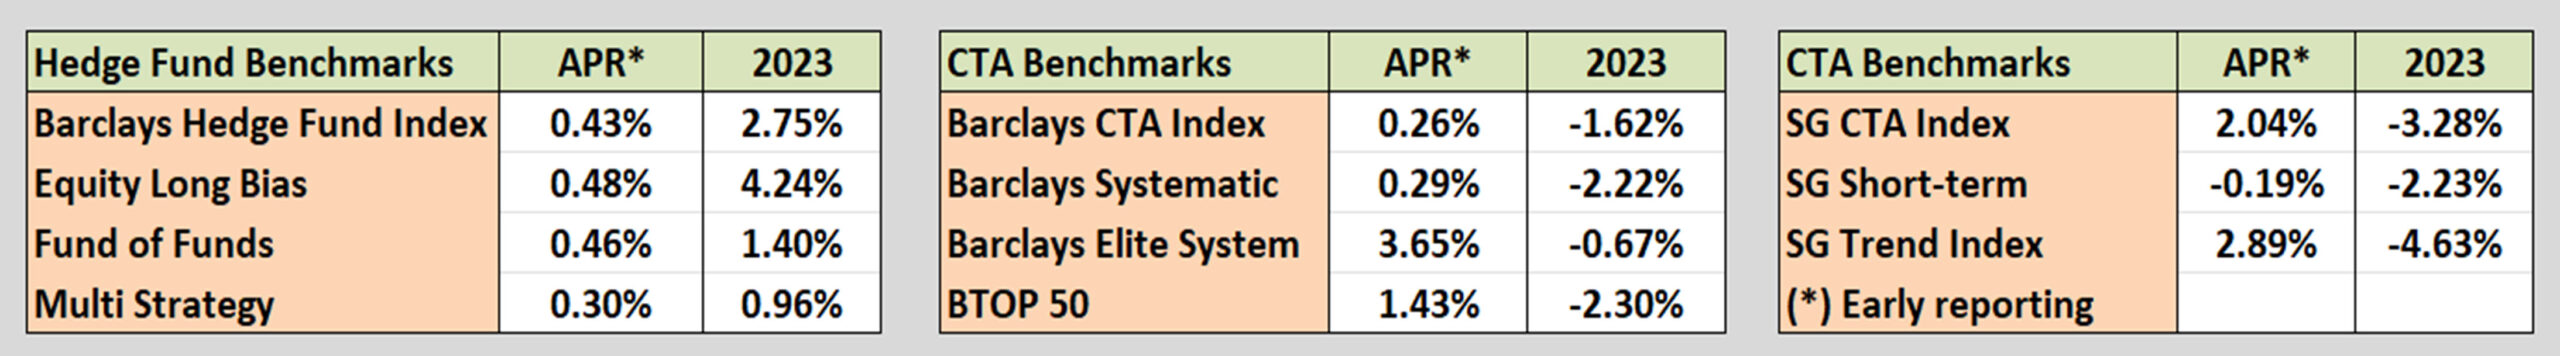
Most equity funds gained fractionally in April, paralleling the major equity ETFs. All are positive for the year. Futures remain marginally lower due to interest rate volatility and continued uncertainty over what the Fed will do with interest rates. Most investors see the end to Fed rate hikes, but the Fed is not giving any hints. There is still a lot of time left to turn this into a positive year.
Kaufman’sMost Popular Books (available on Amazon)
Trading Systems and Methods, 6th Edition. The complete guide to trading systems, with more than 250 programs and spreadsheets. The most important book for a system developer.
Kaufman Constructs Trading Systems. A step-by-step manual on how to develop, test, and trade an algorithmic system.
Learn To Trade. Written for both serious beginners and practiced traders, this book includes chart formations, trends, indicators, trading rules, risk, and portfolio management. You can find it in color on Amazon.
You can also find these books on our website, www.kaufmansignals.com.
Blogs and Recent Publications
Find Mr. Kaufman’s other recent publications and seminars at the end of this report. We post new interviews, seminars, and reference new articles by Mr. Kaufman each month.
April Performance in Brief
Interest rates continue to batter the futures program, up one day and down the next, with an occasional price shock. We recovered partly from last month’s loss only to take another one-day hit. Still, there is plenty of time to recover and we expect that the beginning of a bull market is not far off.
Equities are also still at odds with the Fed. While our benchmark Trend and Timing portfolios were profitable, there is still no clear underlying trend, so strong gains are hard to come by. It’s the nature of trading, being patient while the market flounders.
Major Equity ETFs
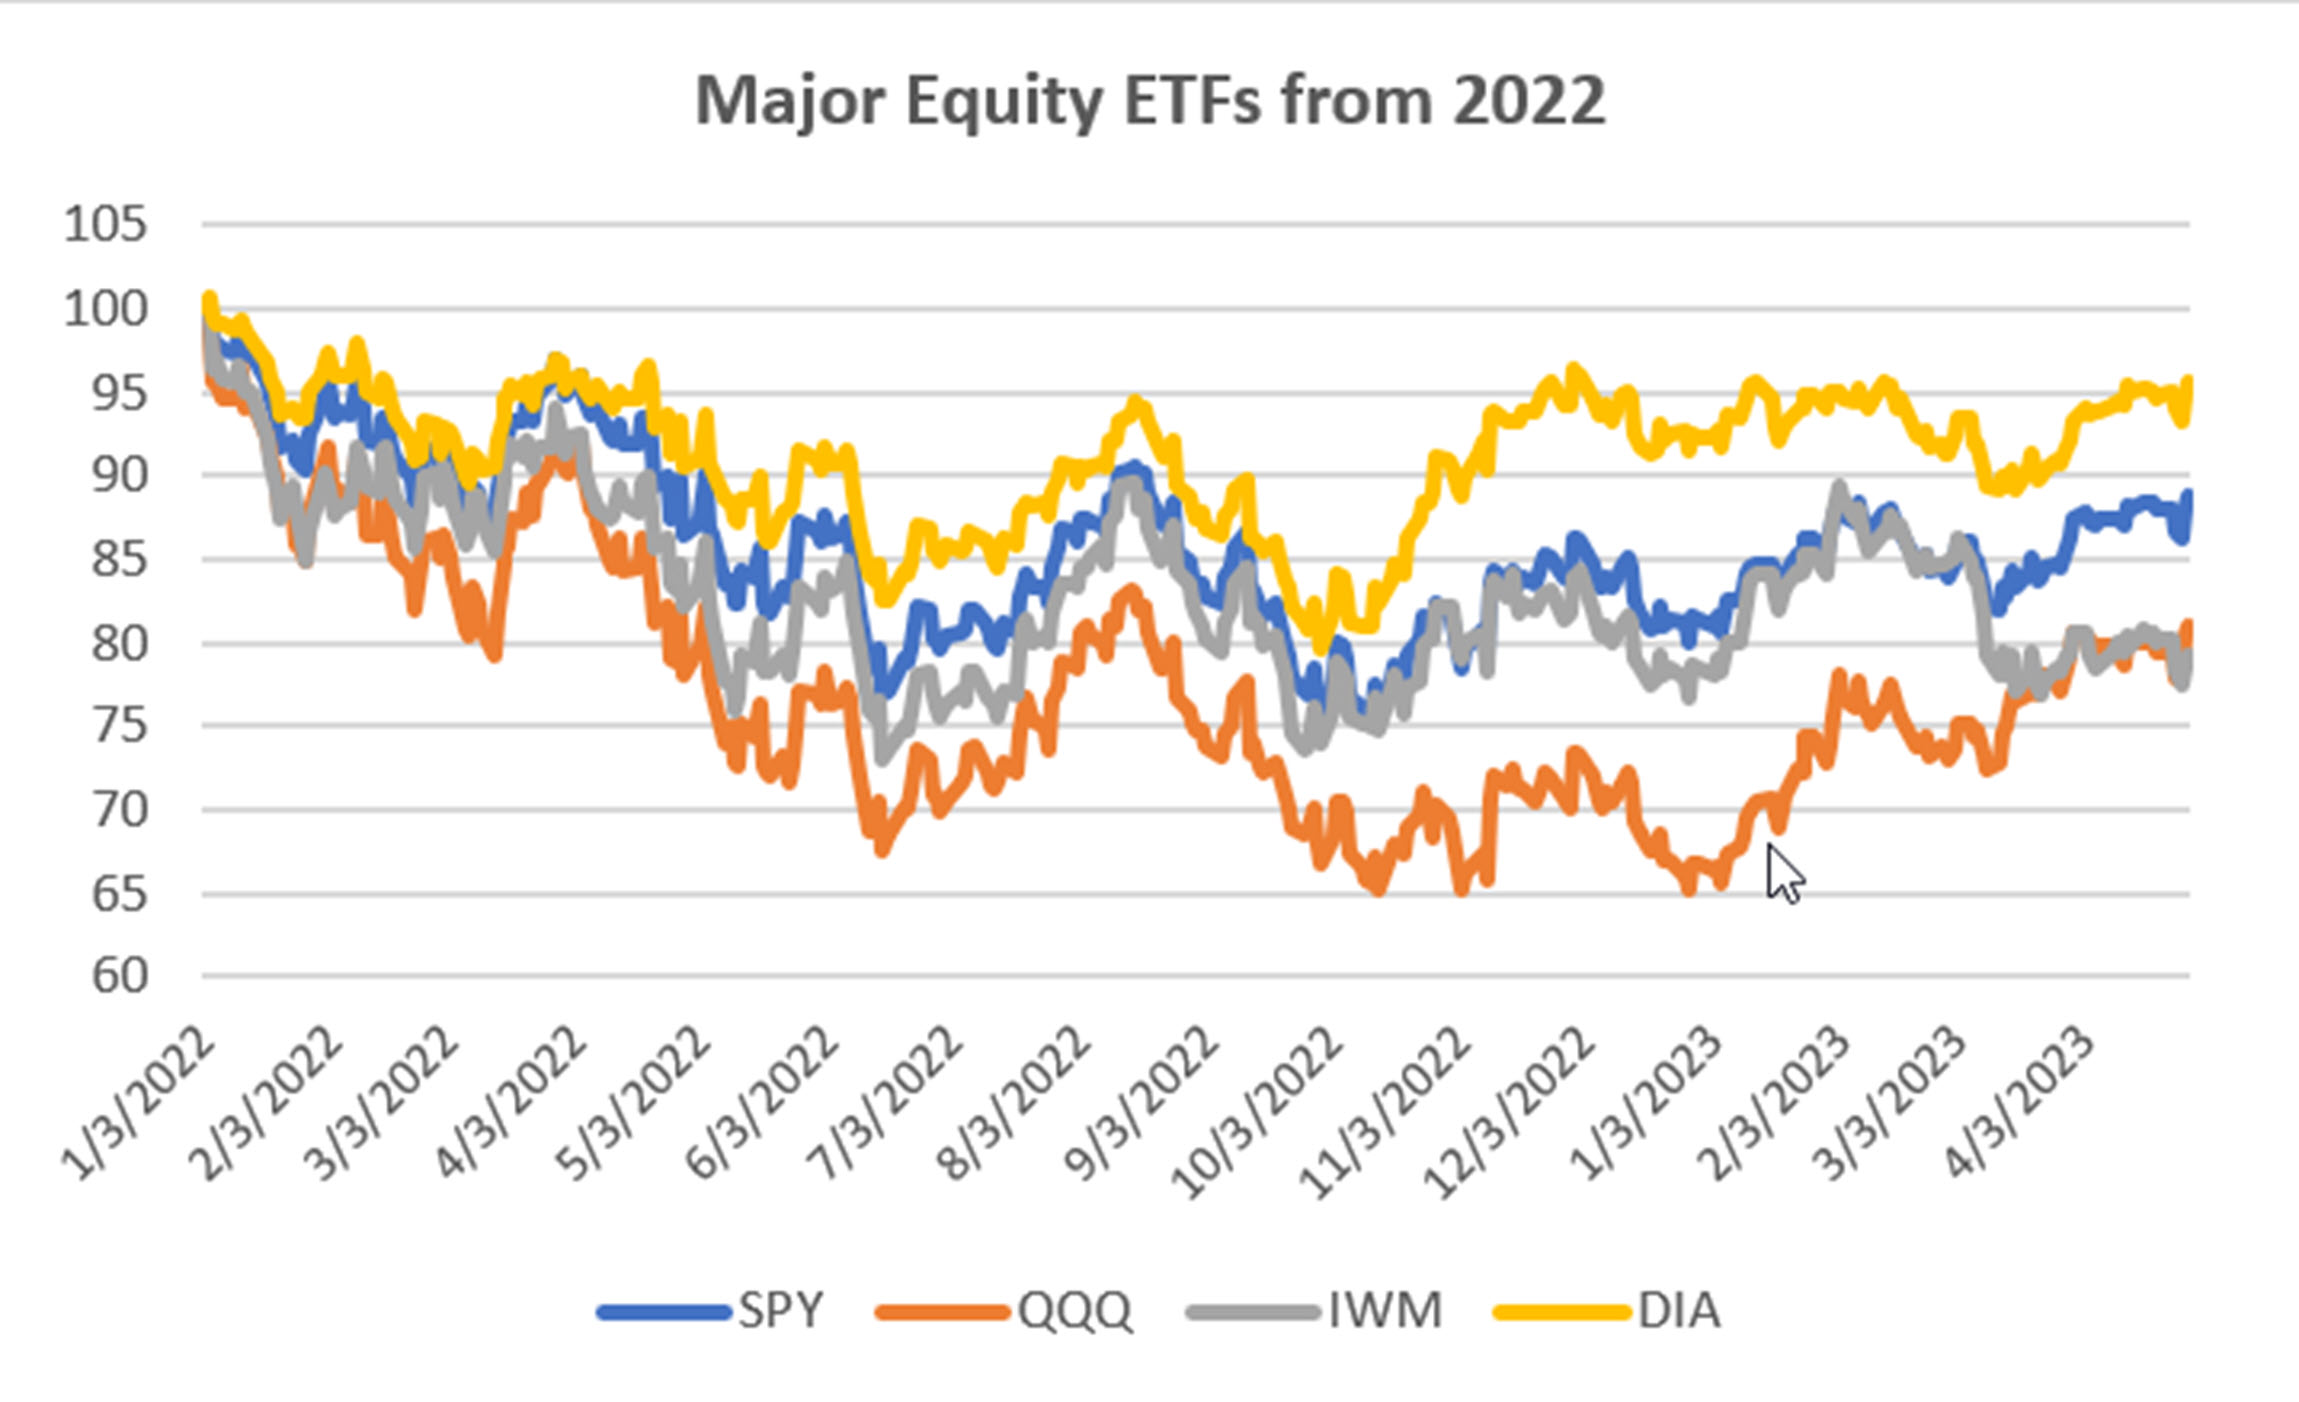
The equity ETFs show an interesting picture of a market trying to break out to new highs. The DOW is sitting at 18-month highs, NASDAQ is showing the most strength after being the weakest, and SPY is in an uptrend that started in October of last year. Only the small caps, IWM are lagging. This coming month should tell us more.
CLOSE-UP: The Best Breakout Rules
Last month we looked at two moving average entry rules. Given a choice between entering when the price crossed the trendline or when the trendline turned up and down, the conclusion was that using the direction of the trendline was best.
Although the differences were not dramatic, there were two reasons for this choice:
When you use a trendline to see past the noise in the price moves, then the trendline is a more reliable indicator of price direction.
The number of trades were significantly higher using the entry rule where the price crosses the trendline. That was not justified based on better returns.
Profile of a Breakout System
Now we look at another important trend system, the N-Day Breakout. I have always liked the breakout system because it recognizes significant changes in the value of a stock or futures market. It lets prices wander around between their highest high and lowest low without getting you out of the trade. That has good and bad features.
The risk of a breakout trade is the distance from the N-day high to the N-day low. That can be quite large, especially if the “N” is 60 days or more, needed for a macrotrend approach.
On the other hand, prices don’t go up every day, even in a bull market. A moving average trendline will get closer to the current price each day and, even in a sideways market, cause you to exit before the trend makes a significant reversal.
In a sideways market the breakout system performs best by doing nothing. It will wait for a new high or low, indicating that something has changed. Because of that, it can have more than 50% good trades compared to 30% to 35% for a moving average system.
Do You Use the Highs and Lows, or the Close?
Traditionally, a breakout occurs when the high of today goes above the previous N-day high, or today’s low below the N-day low. While I have defined the N-day high-low range using the highs and lows (not a surprise) I require that today’s close be above the N-day high or below the N-day low as a confirmation that the breakout is real. I believe that rule will prevent a few false breakout on intraday price moves. However, I have never tested it until now.
We will use the same markets that we tested in last month’s report: Apple (AAPL), Amazon (AMZN), Micron (MU), and, of course, the index ETFs SPY and QQQ, all starting in 2000.
Apple (AAPL)
Starting with Apple (AAPL), Chart 1 shows the net profits of long and short sale trades. Results using the highs and lows for breakouts (left) and the close for breakouts (right) have the same scale on the left, so results are not very different, but the pattern is different. For this test, the close was better for both long and short sales, and the percentage of profitable trades slightly better (Chart 2). At the end of this report there is a table that will show the exact values, so that you can draw your own conclusions.
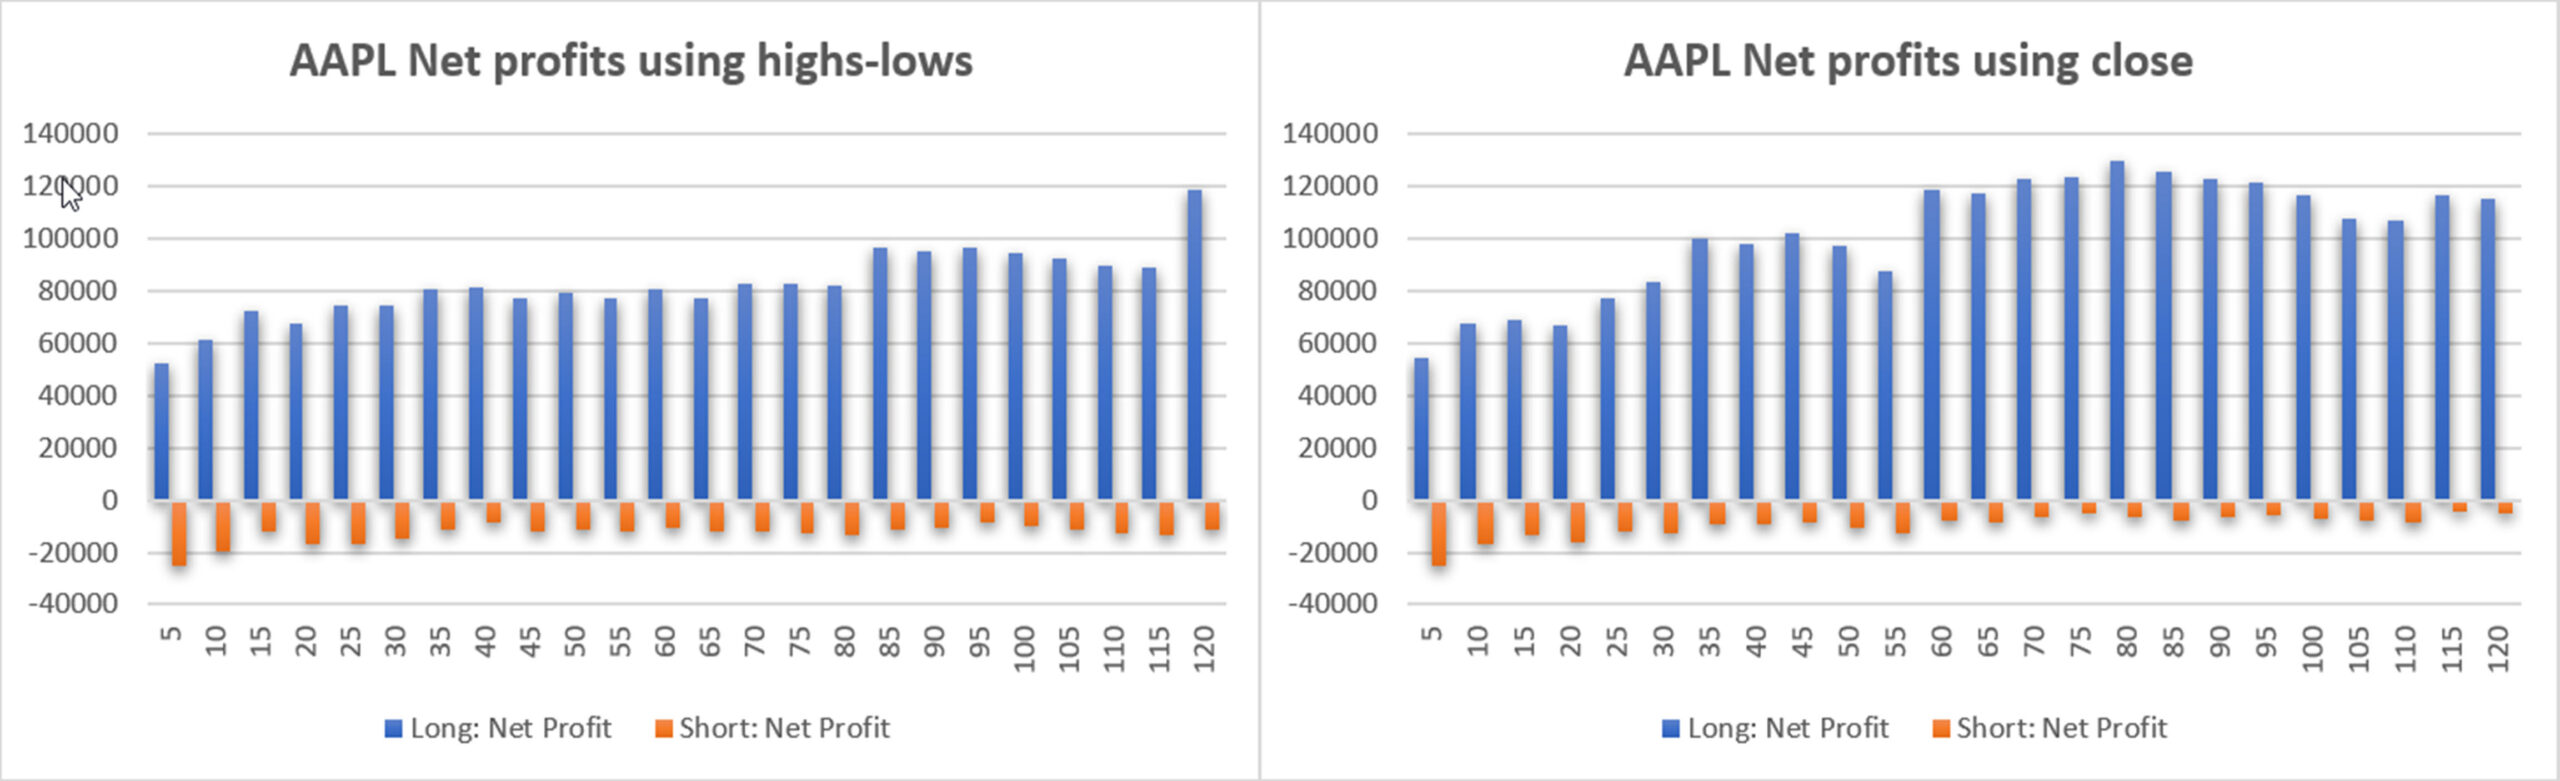
Chart 1. Apple (AAPL) shows net profits using the highs and lows for breakouts (left) and the close for breakouts (right).
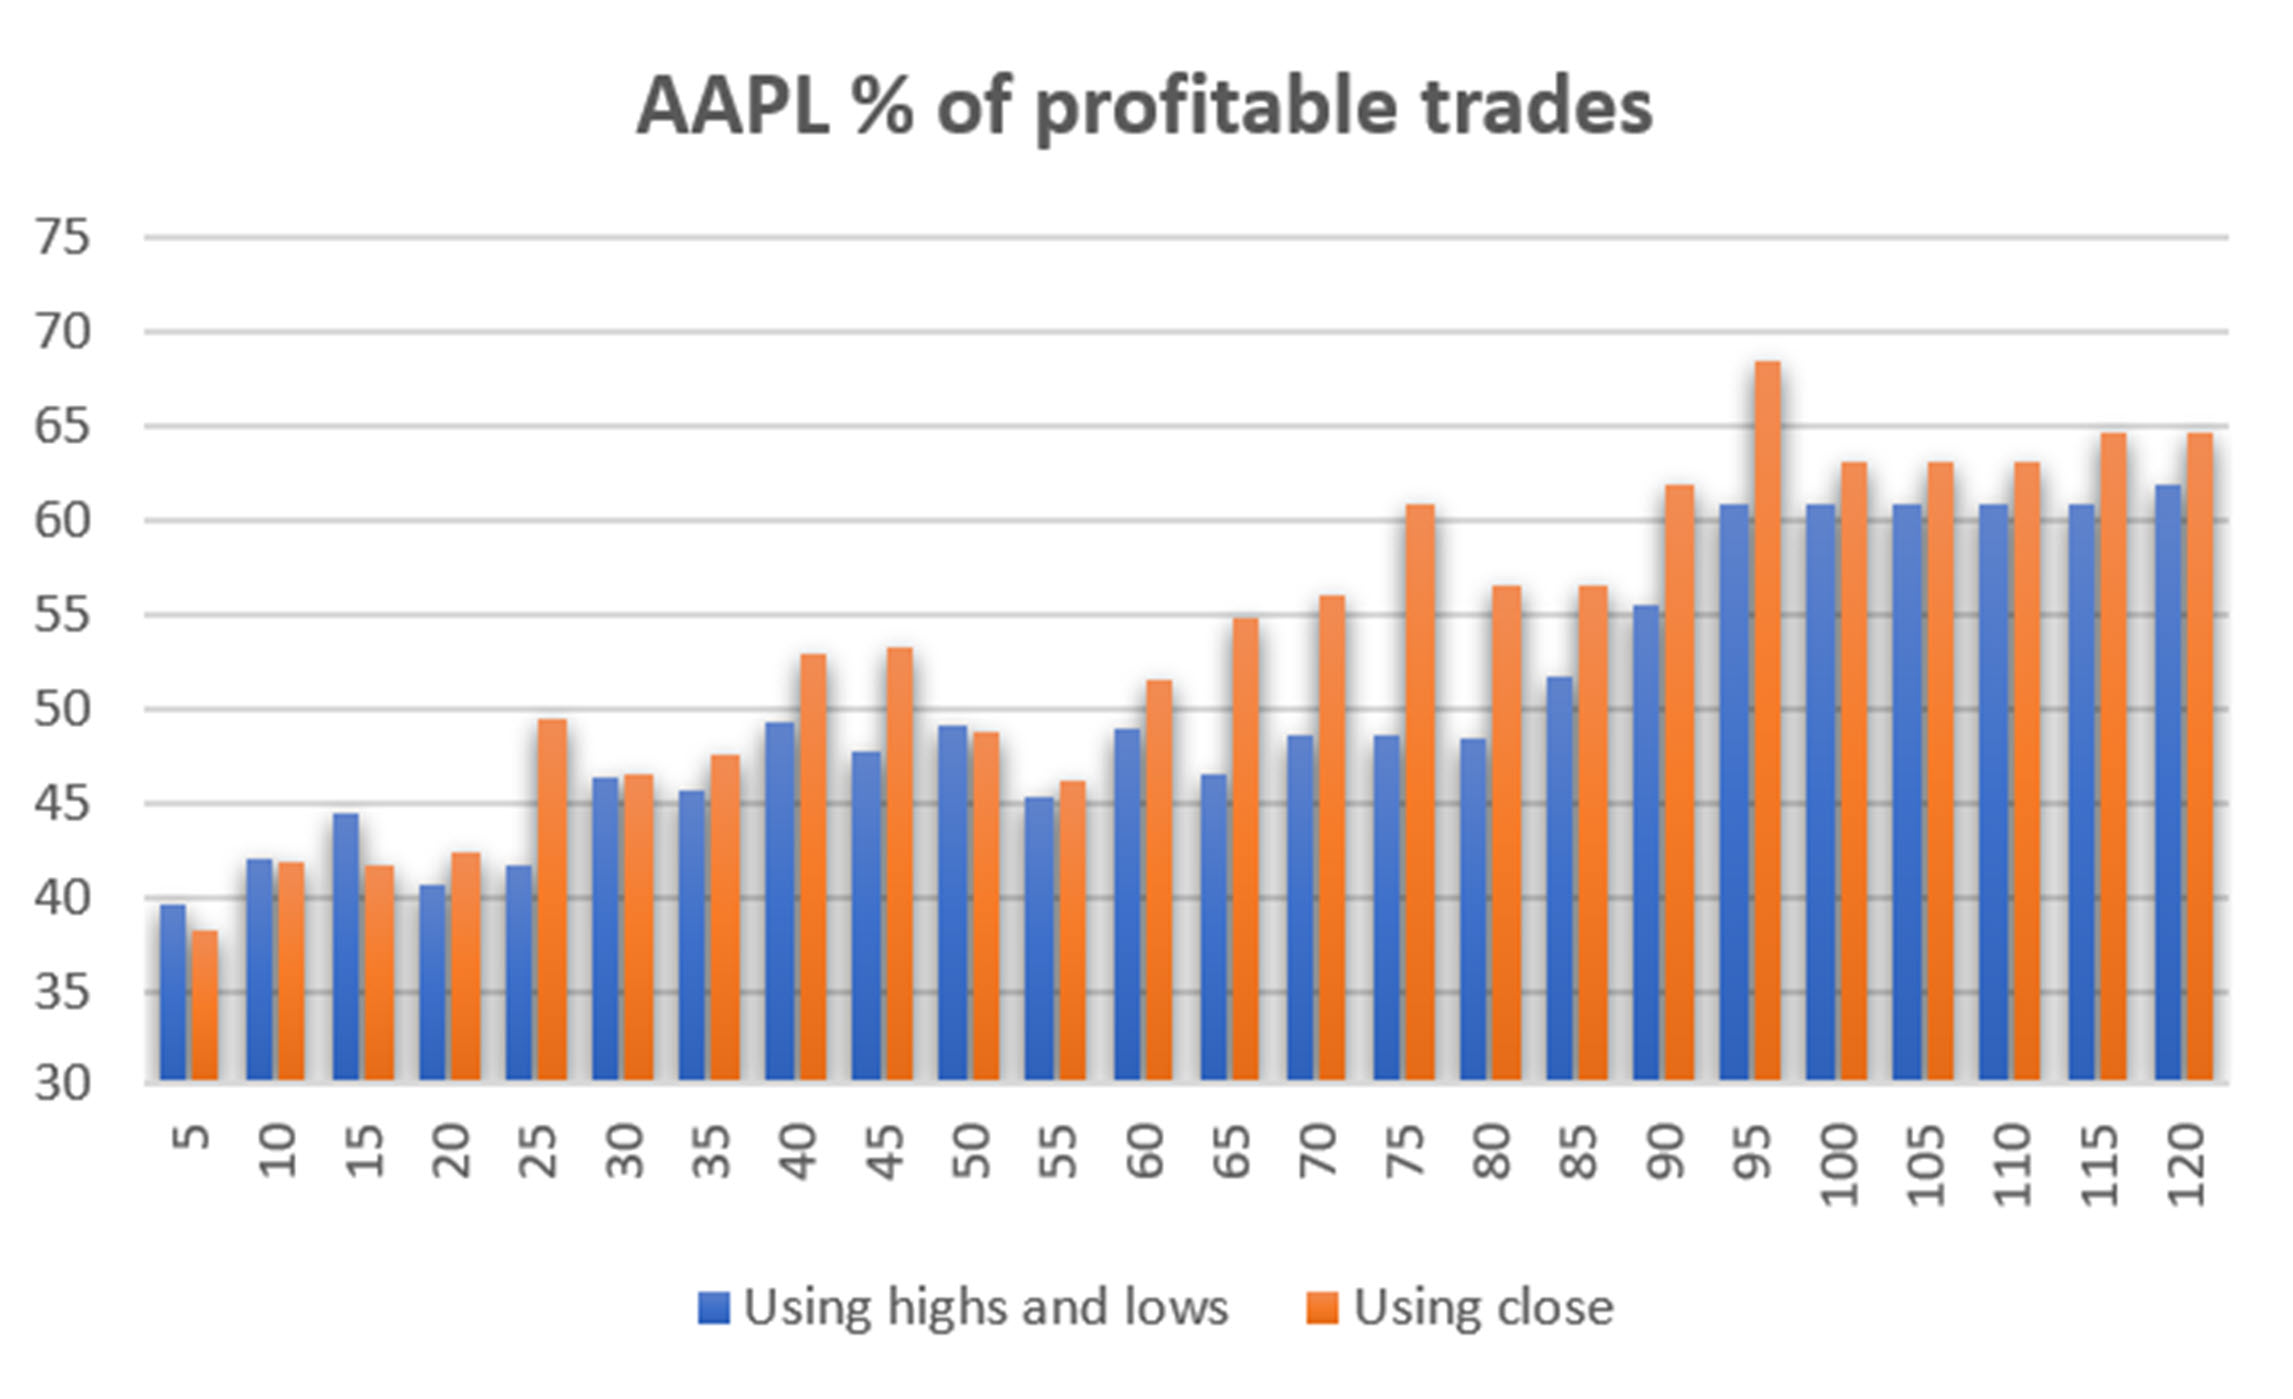
Chart 2. Apple (AAPL) percentage of profitable trades.
In Chart 2 it is clear that using the close for the breakout (the orange bar) is consistently better.
Amazon (AMZN)
Another giant company is Amazon (AMZN). Net profits are compared in Chart 3. As with Apple, the profit scale on the left is the same for both strategies, but the pattern is somewhat different. You can see that using the close (the right chart), has higher profits starting with the 55-day calculation period. In Chart 4 the use of the highs and lows for a breakout have an edge over the close.
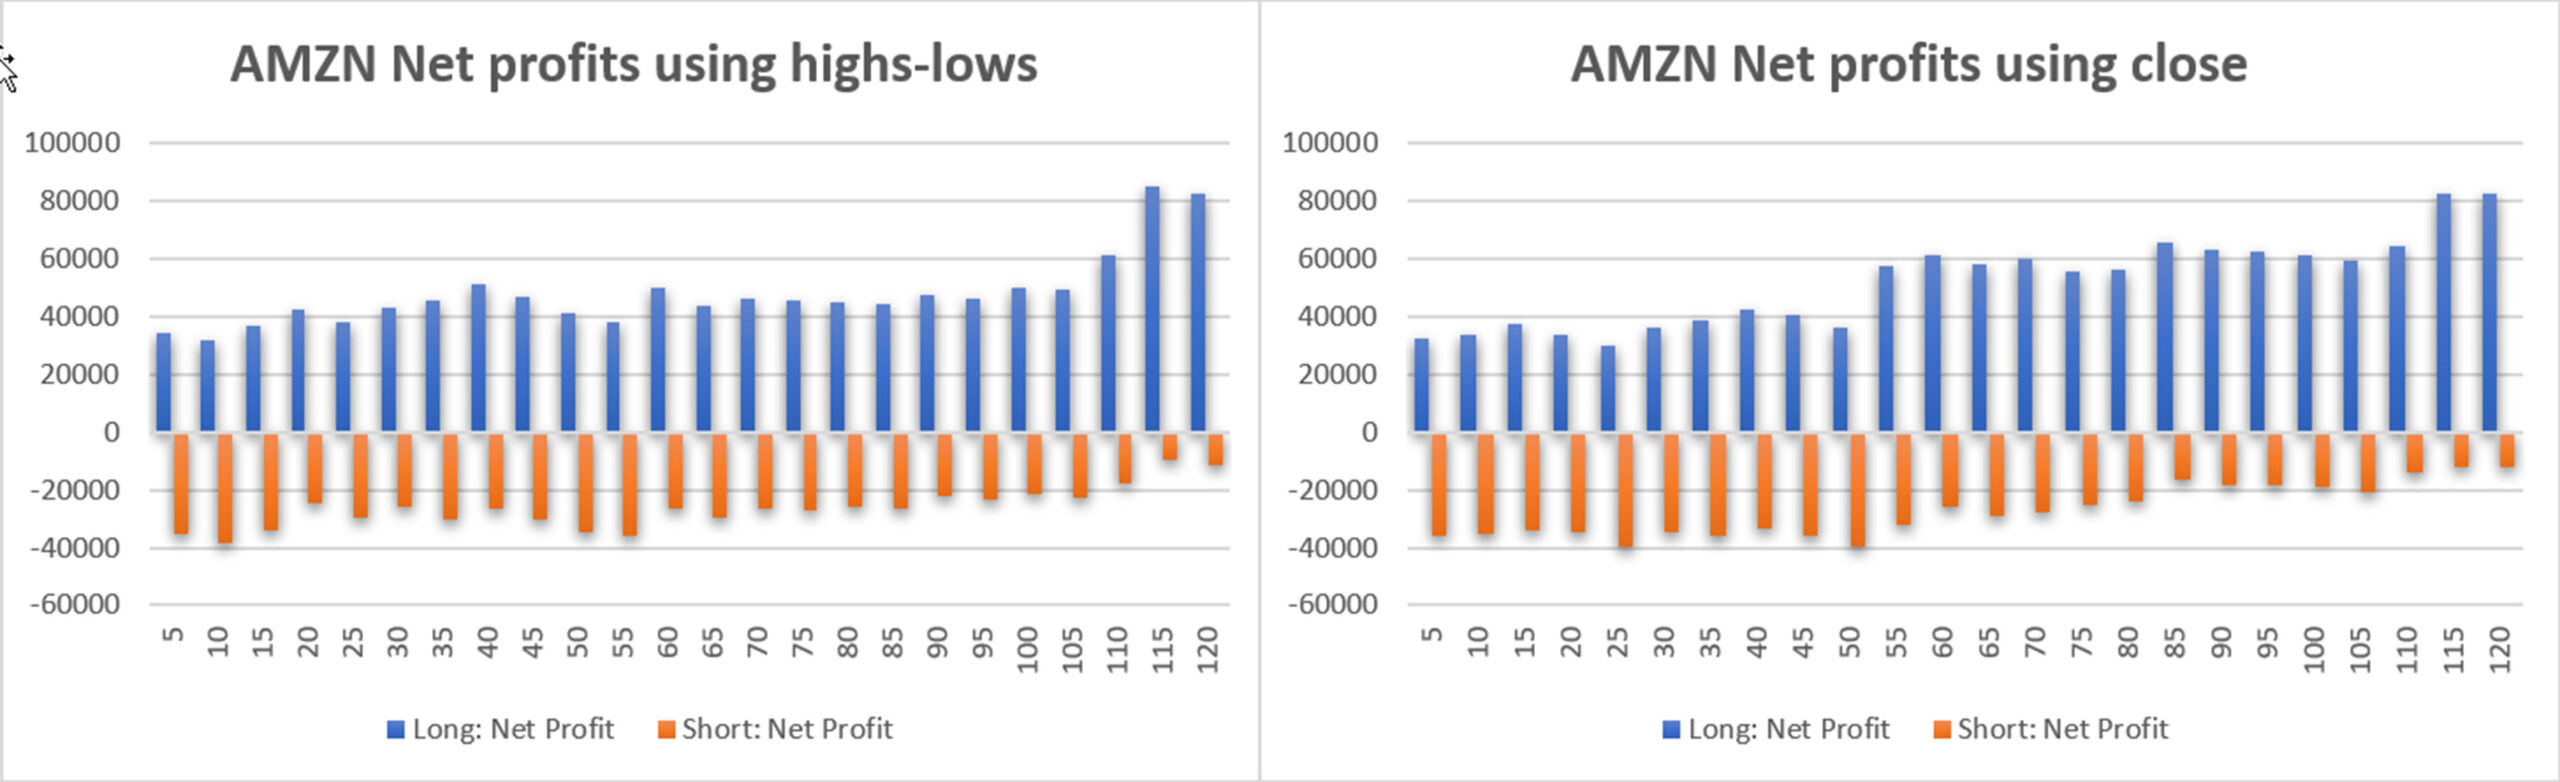
Chart 3. Amazon (AMZN) shows net profits using the highs and lows for breakouts (left) and the close for breakouts (right).
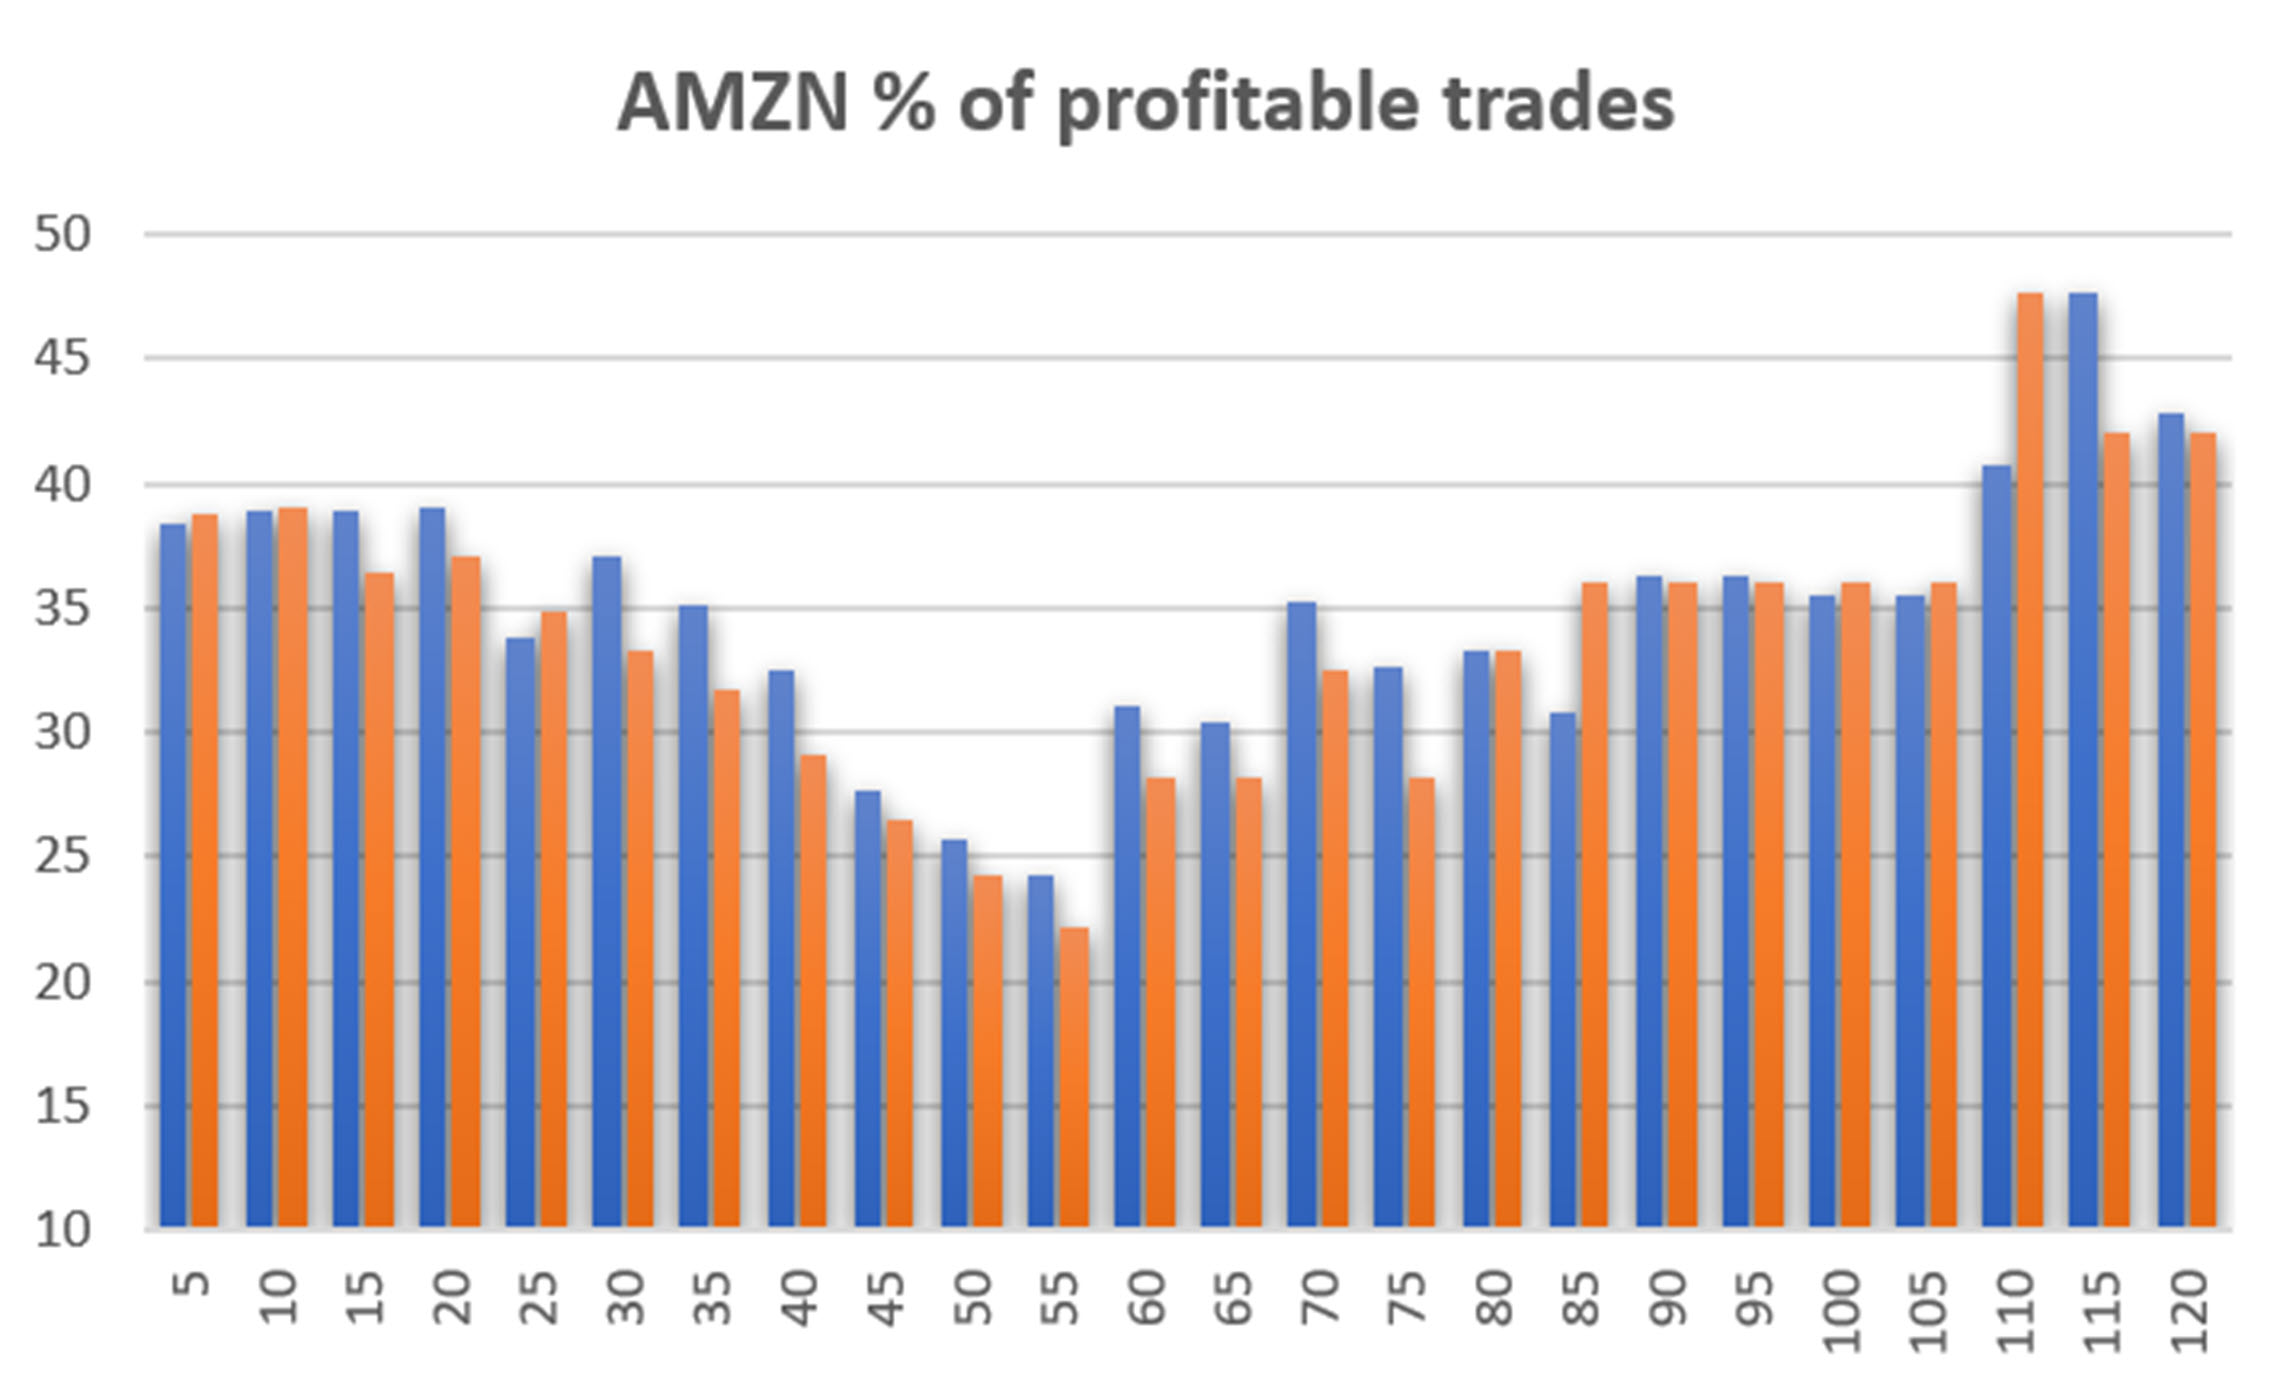
Chart 4. Amazon (AMZN) percentage of profitable trades.
Micron (MU)
Micron is a good representative of the technology industry, with a history of volatility. It produces computer memory chips and storage units. Chart 5 shows that short-term breakouts are not profitable, but longer calculation periods capture the trend. Using the close to identify a breakout seems to show smoother results. In Chart 6, the percentage of profitable trades, we see mixed results.
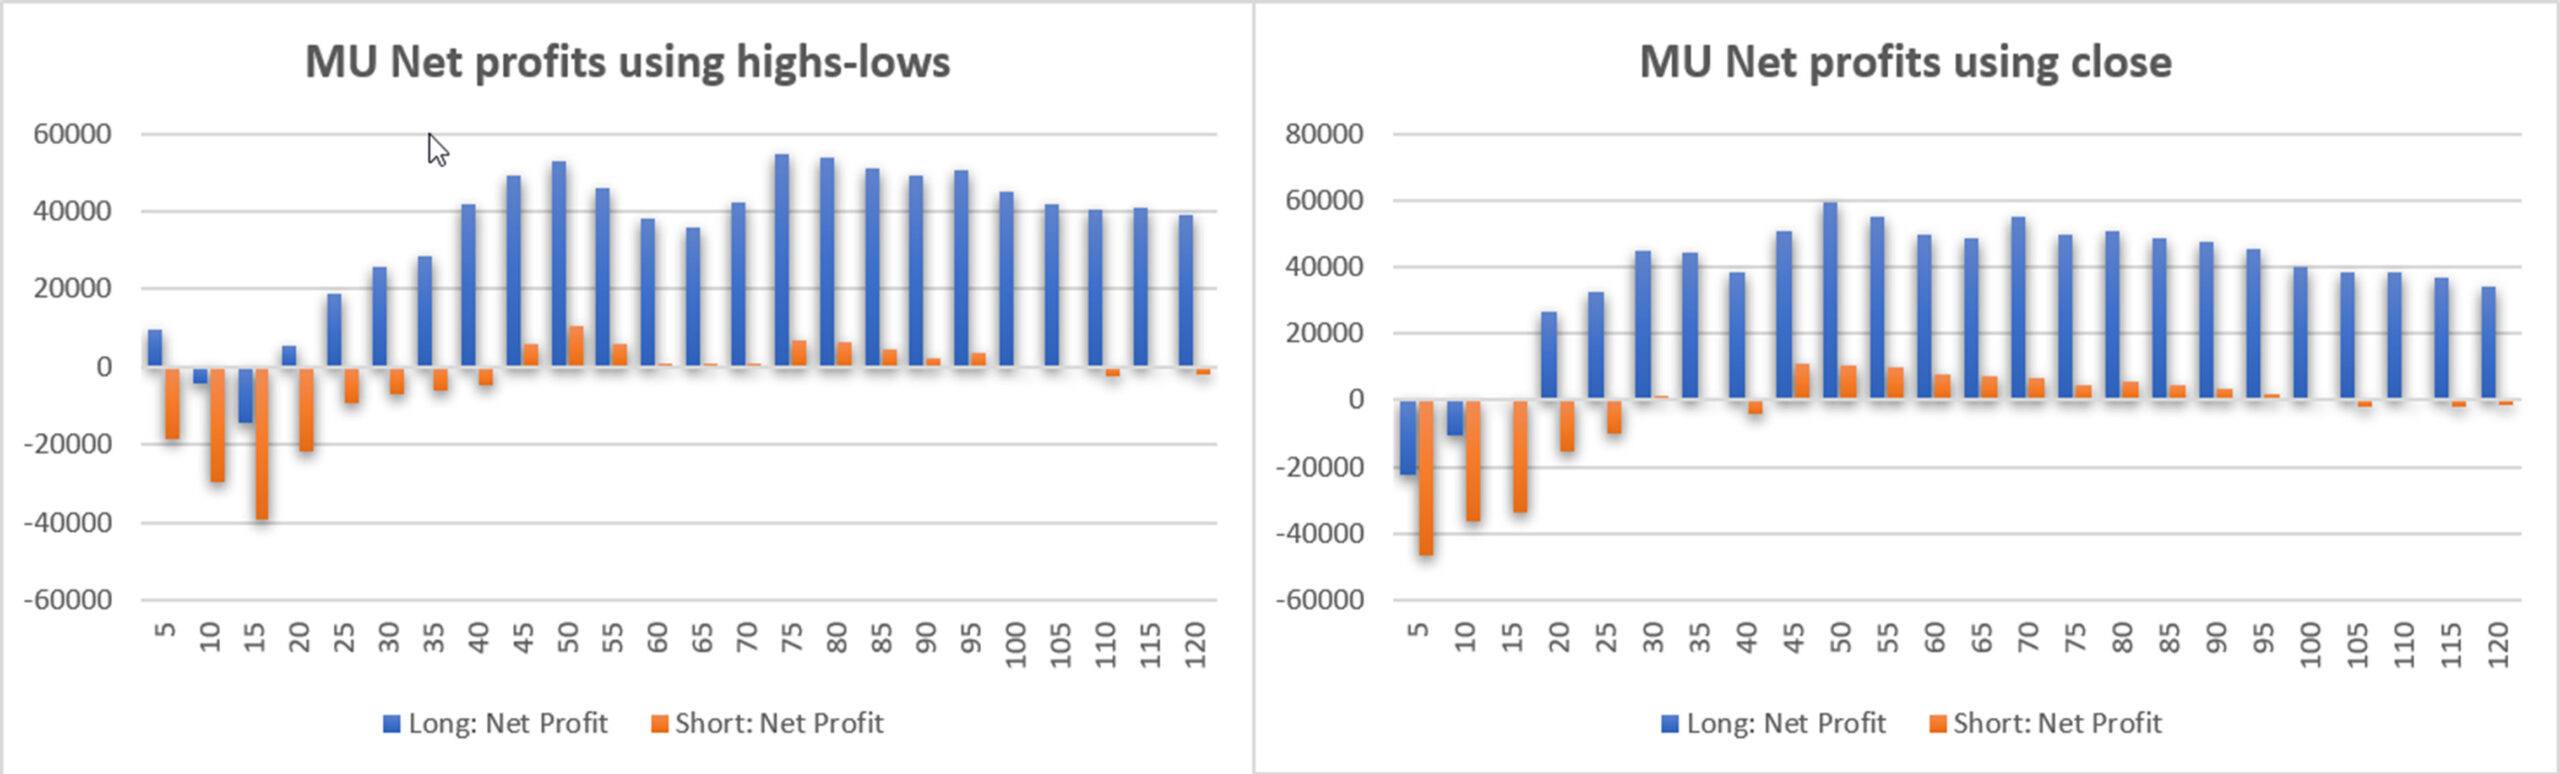
Chart 5. Micron (MU) shows net profits using the highs and lows for breakouts (left) and the close for breakouts (right).

Chart 6. Micron (MU) Percentage of profitable trades.
S&P 500 – SPY
Now we come to the major index ETFs, first SPY then QQQ. While the overall pattern for SPY (Chart 7) is similar for both types of breakouts, using the highs and lows are clearly better for both long and short sales. As we will see in the Summary Table at the end, SPY is different, if only slightly, from the results of the other markets tested. Similarly, Chart 8 shows that using the highs and lows are slightly more reliable. Why?
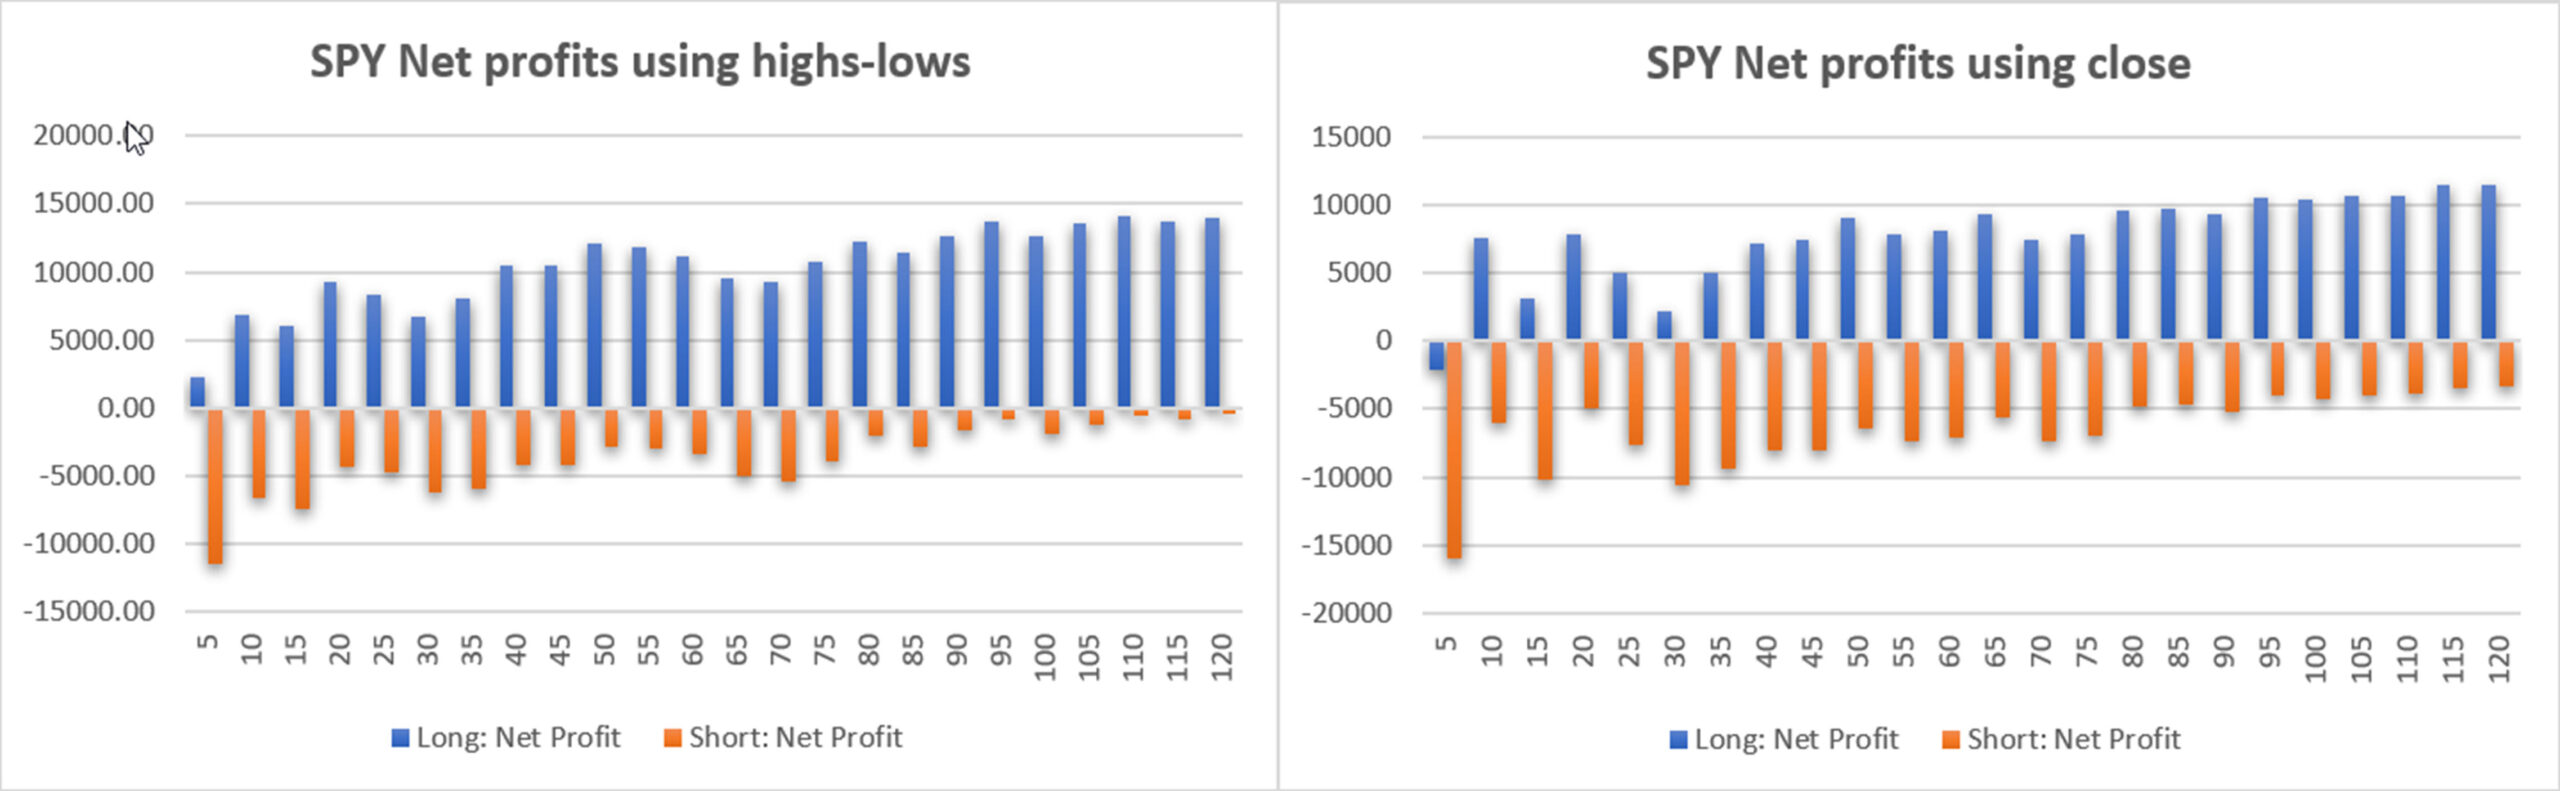
Chart 7. SPY net profits using the highs and lows for breakouts (left) and the close for breakouts (right).

Chart 8. SPY percentage of profitable trades.
Better returns using the highs and lows for breakouts implies that there is immediate follow-through when a breakout occurs. On the other hand, the S&P is one of the noisest markets, meaning that prices reverse frequently. The two are inconsistent. We can make a decision about this when we look at the Summary Table at the end.
NASDAQ QQQ
Finally, we look at QQQ, the NASDAQ ETF. In my tests, it tends to be a little less noisy than SPY and a little more volatile. Chart 9 shows that it conforms to the pattern of stocks shown earlier, with profits higher for both longs and short sales using the close as the breakout confirmation. Similarly, the percentage of profitable trades was higher using the close (Chart 10).
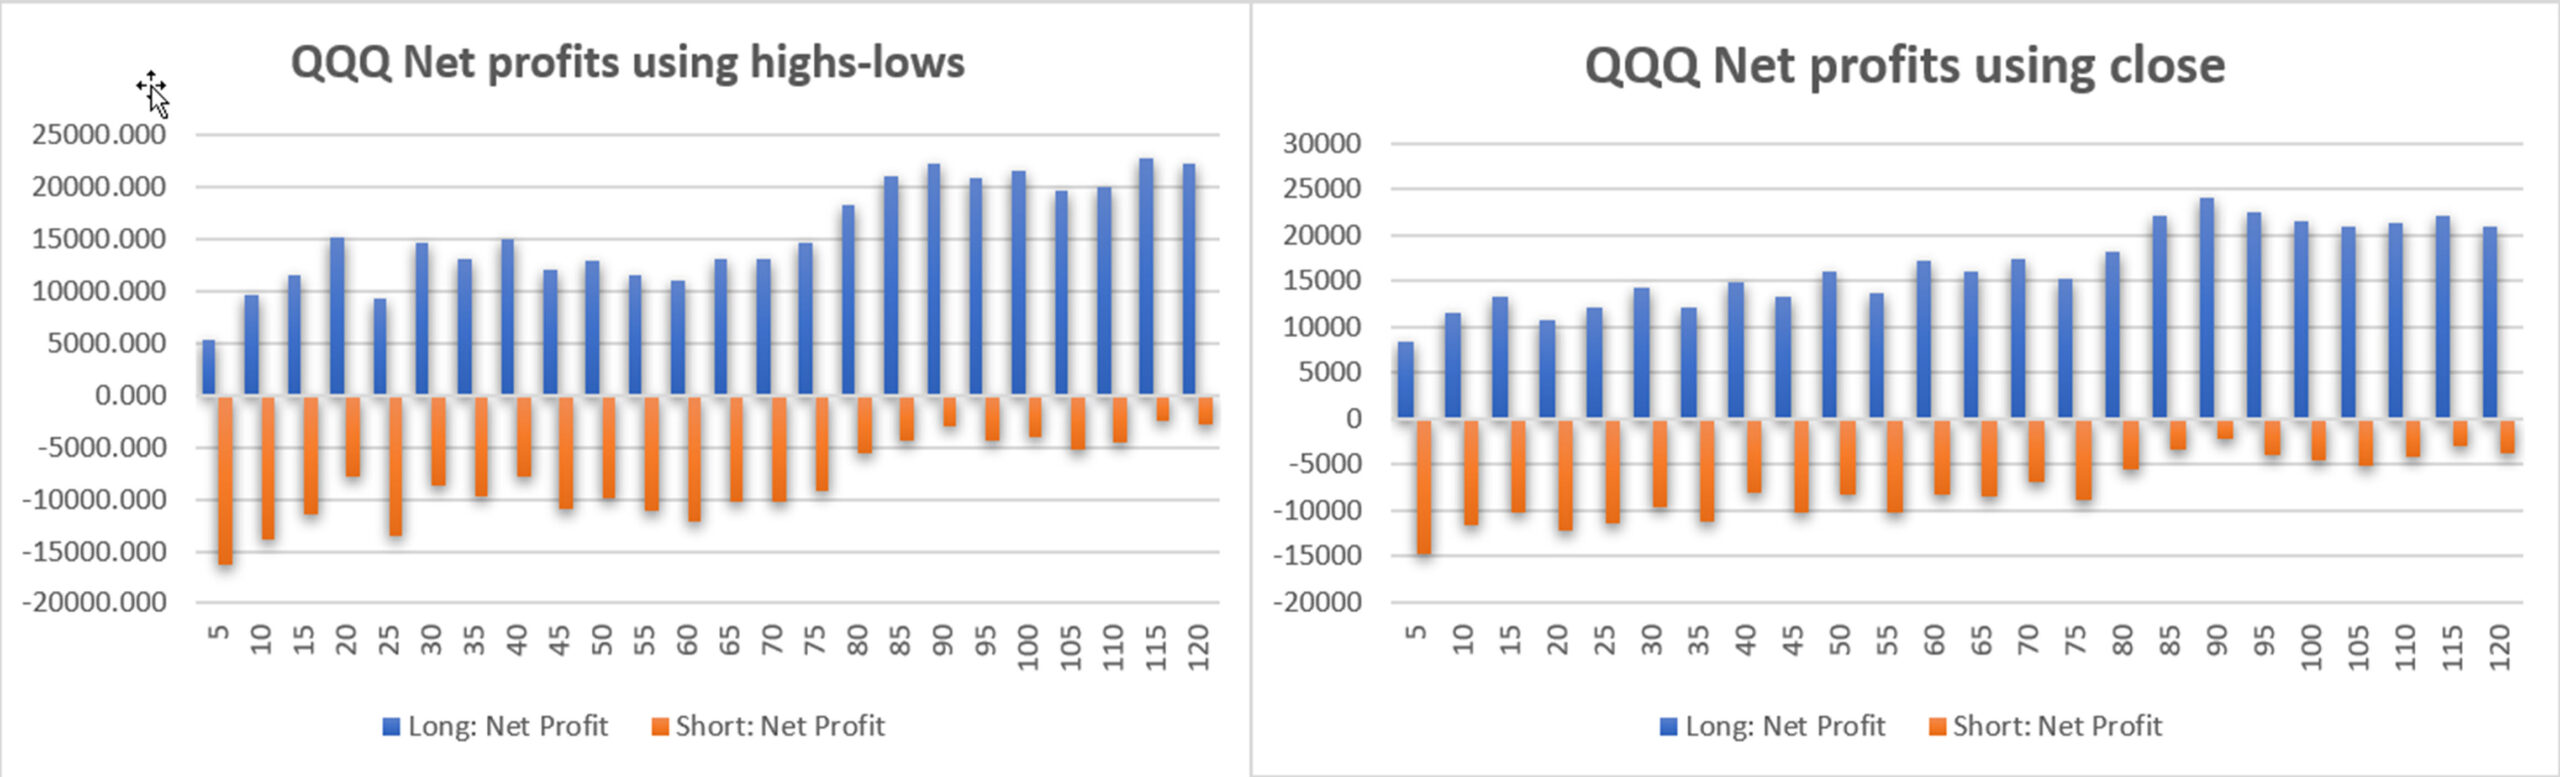
Chart 9. QQQ net profits using the highs and lows for breakouts (left) and the close for breakouts (right).
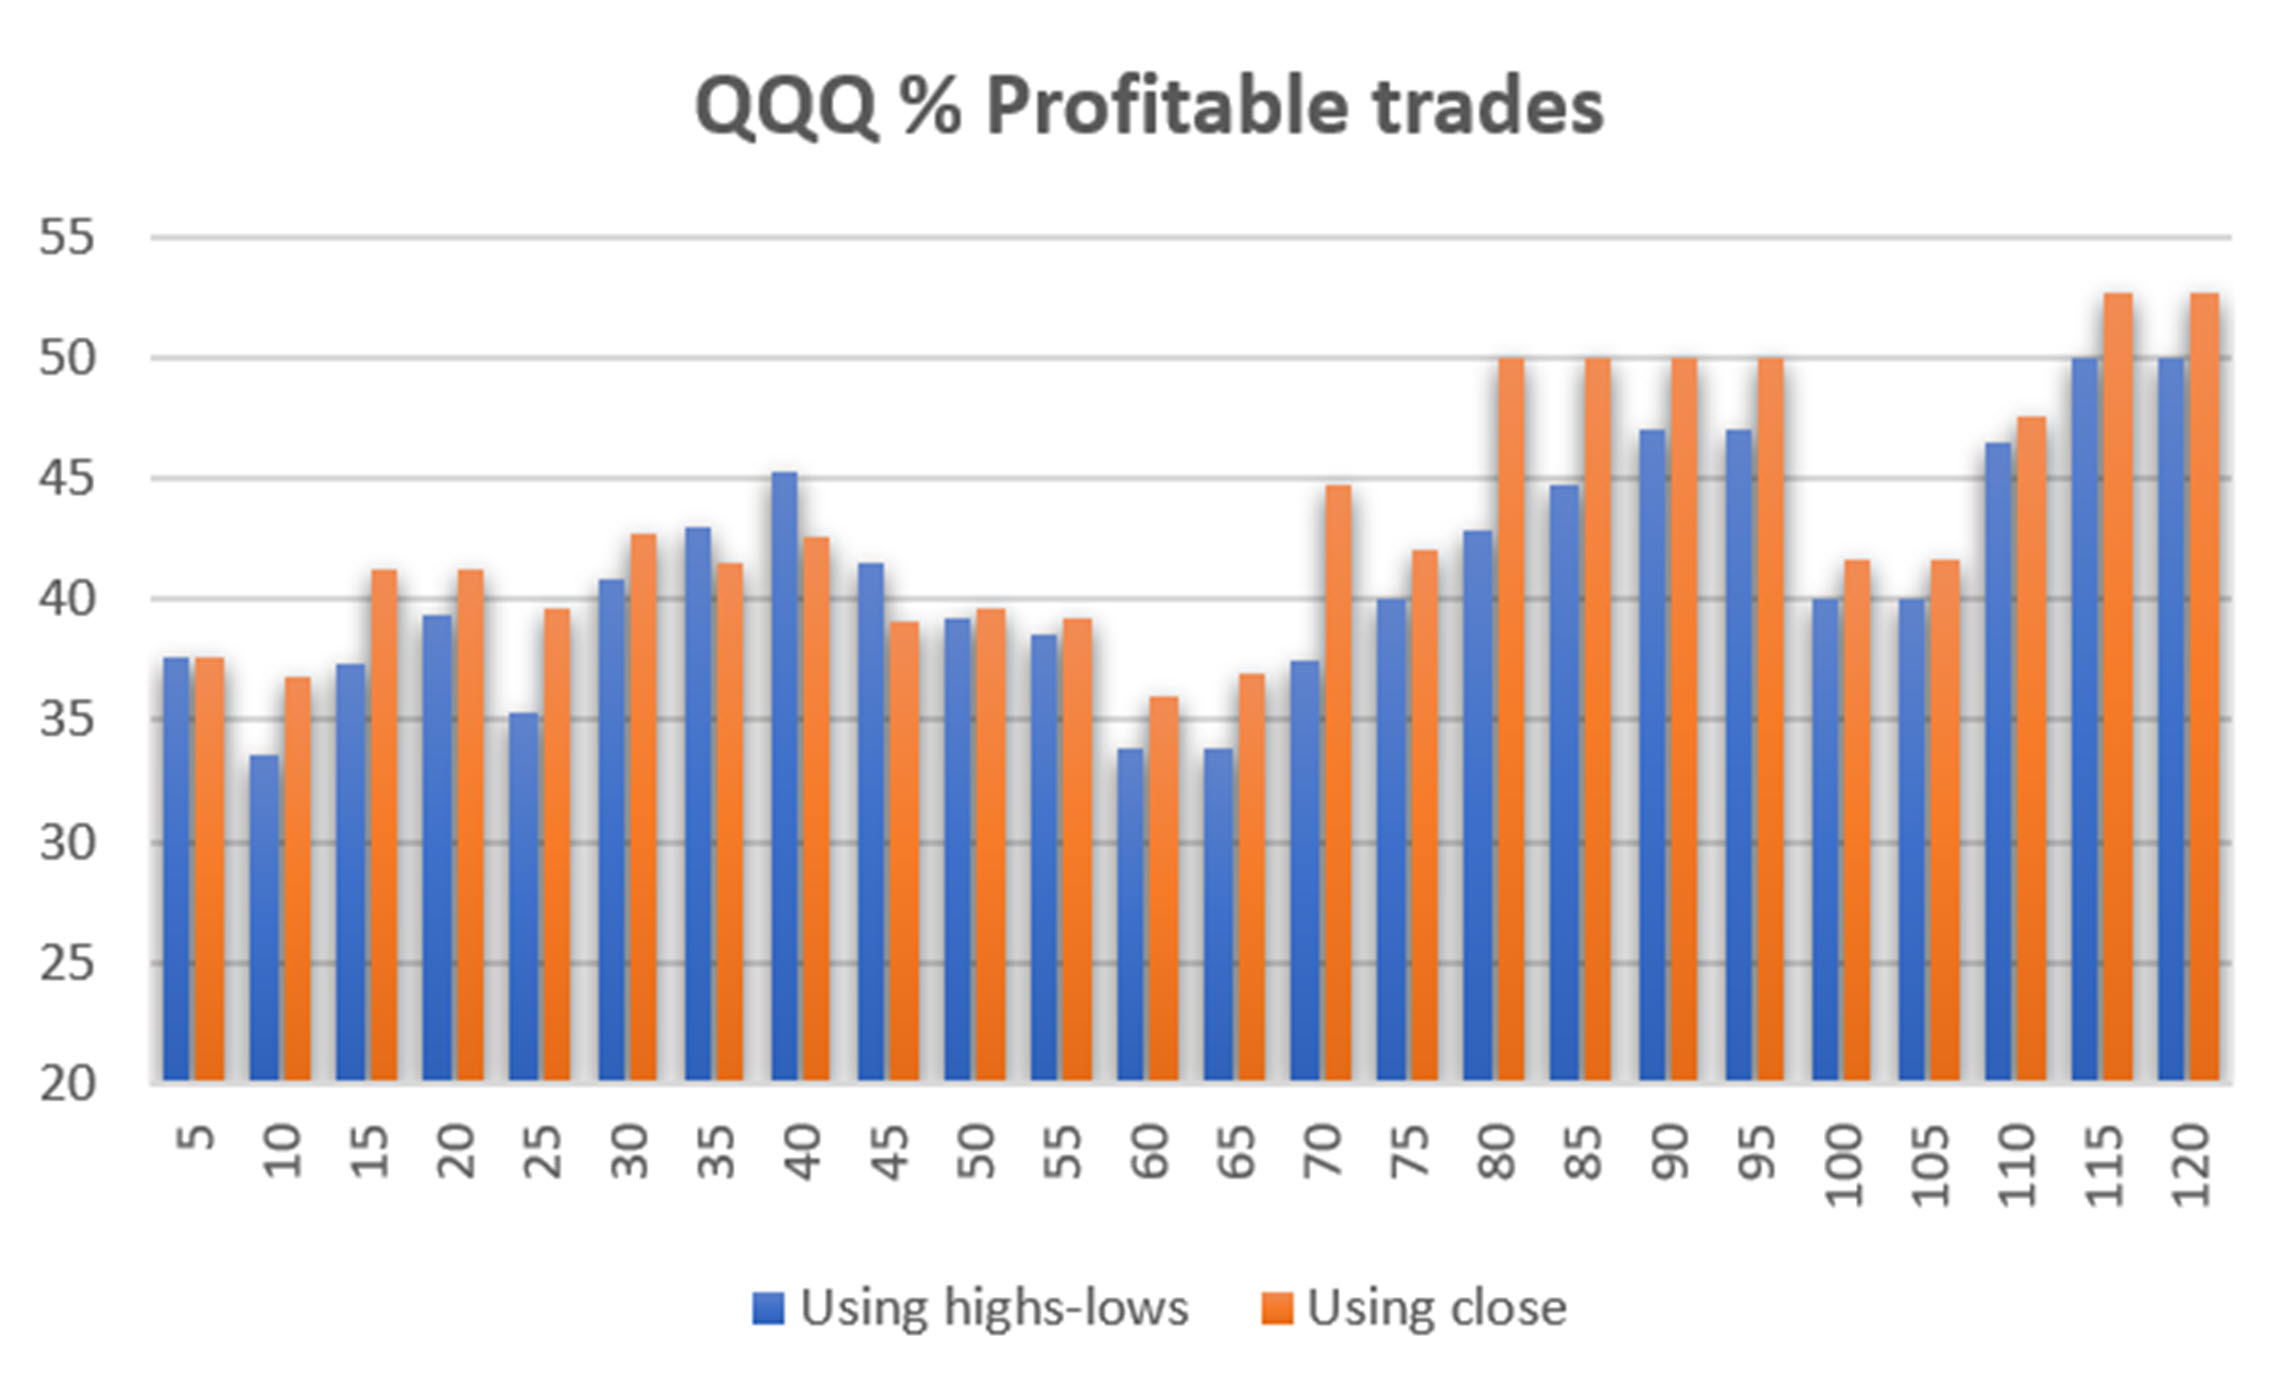
Chart 10. SPY percentage of profitable trades.
Conclusion
As much as I would like to see clear choices in all our studies, this one turns out to be marginal. Most of our tests favored using the close as a confirmation of a breakout. That implies that the highs and lows of the breakout days are noisy. Because it is not likely that prices close at the highs or lows of the day, it seems reasonable that the close will be a better entry price.
There should also be less slippage executing on the close. When there are clear support or resistance levels, orders tend to bunch up at those points and prices can jump, making it difficult to get a good execution. There are also days when there is a false breakout and prices quickly reverse back into the previous high-low range.
The Summary Table below lets you decide how to trade the breakouts. The green boxes are those that showed better results. The last line is the average of the column. On average, using the close for the breakout was best, with SPY as the notable exception. For my own trading, I am more comfortable using the close. I don’t like chasing the price and the Net Profits of this sample are 13% higher with the losses in short sales smaller. Small improvements can add up.
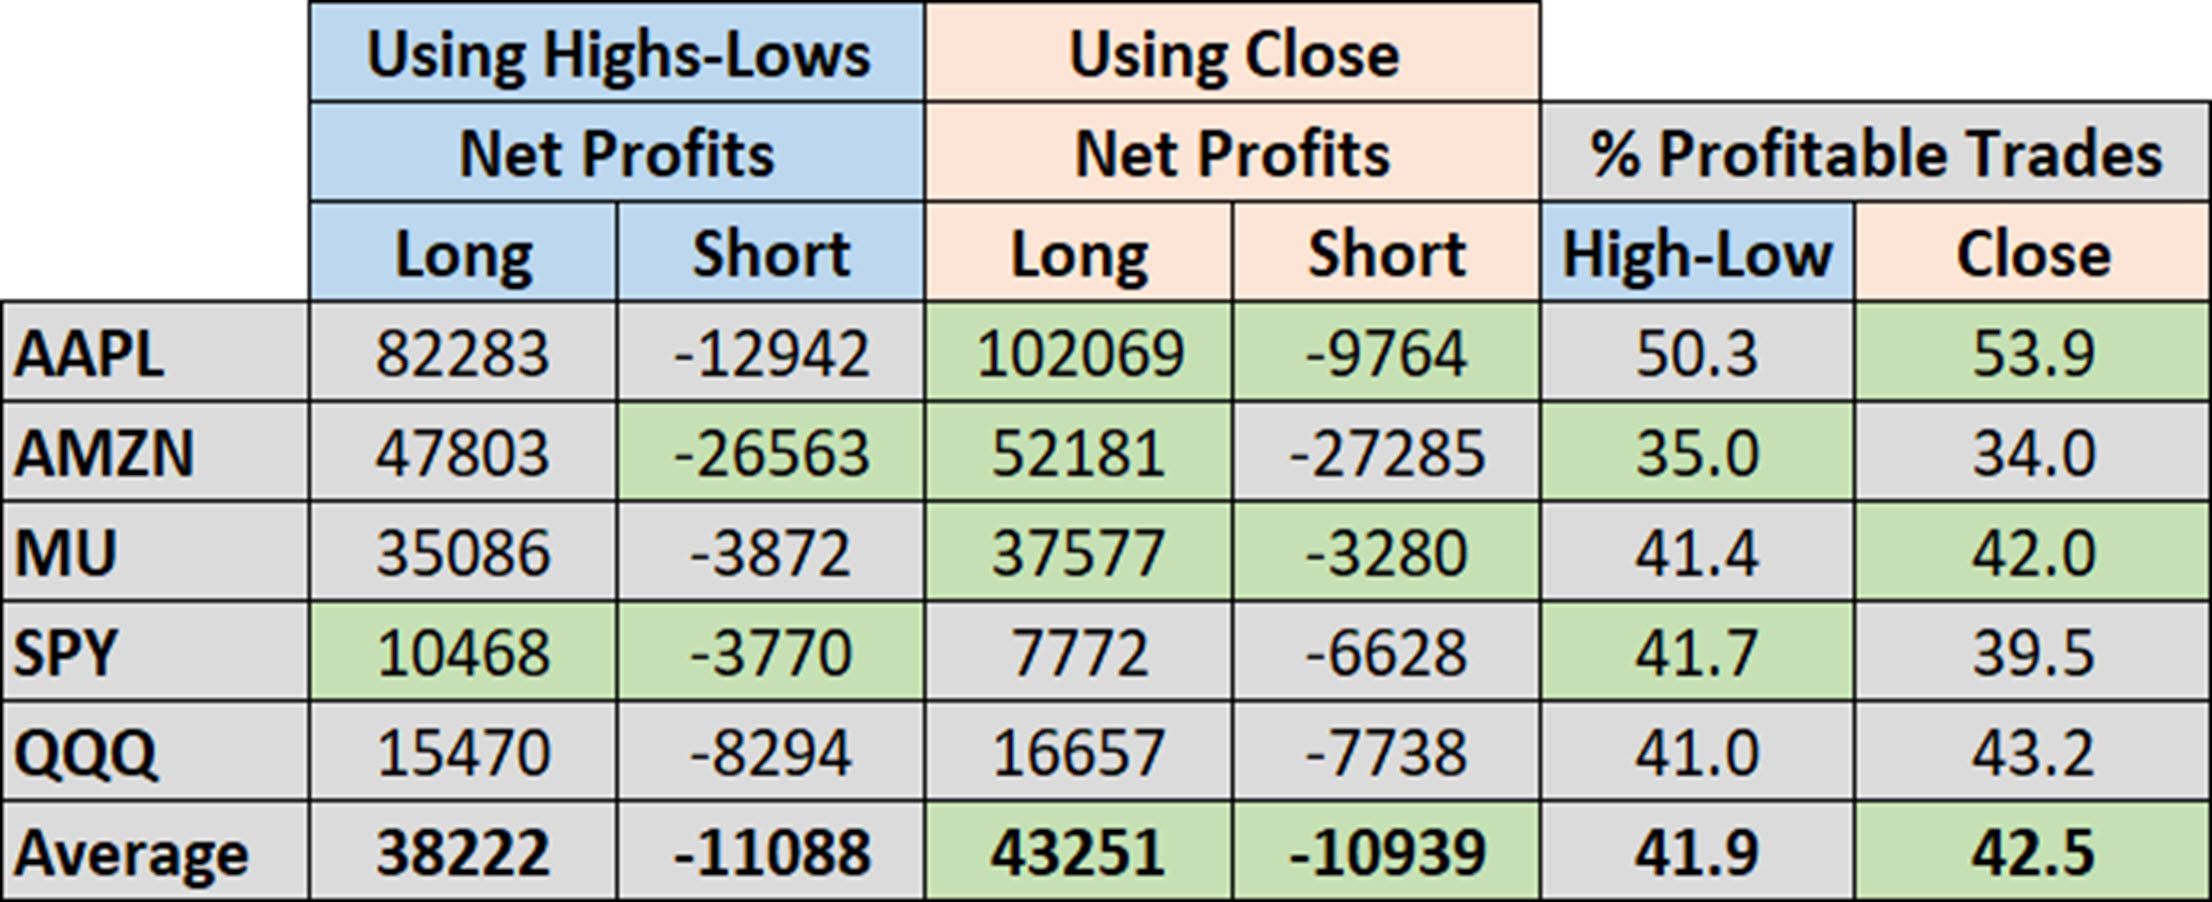
Summary Table. Comparison of net profits and percentage of profitable trades.
A Standing Note on Short Sales
Note that the “All Signals” reports show short sales in stocks and ETFs, even though short positions are not executed in the equity portfolios. Our work over the years shows that downturns in the stock market are most often short-lived and it is difficult to capture with a longer-term trend. The upwards bias also works against shorter-term systems unless using futures, which allows leverage. Our decision has been to take only long positions in equities and control the risk by exiting many of the portfolios when there is extreme volatility and/or an indication of a severe downturn.
PORTFOLIO METHODOLOGY IN BRIEF
Both equity and futures programs use the same basic portfolio technology. They all exploit the persistence of performance, that is, they seek those markets with good long-term and short-term returns on the specific system, rank them, then choose the best, subject to liquidity, an existing current signal, with limitations on how many can be chosen from each sector. If there are not enough stocks or futures markets that satisfy all the conditions, then the portfolio holds fewer assets. In general, these portfolios are high beta, showing higher returns and higher risk, but have had a history of consistently outperforming the broad market index in all traditional measures.
PERFORMANCE BY GROUP
NOTE that the charts show below represent performance “tracking,” that is, the oldest results since are simulated but the returns from 2013 are the systematic daily performance added day by day. Any changes to the strategies do not affect the past performance, unless noted. The system assumes 100% investment and stocks are executed on the open, futures on the close of the trading day following the signals. From time to time we make logic changes to the strategies and show how the new model performs.
Groups DE1 and WE1: Daily and Weekly Trend Program for Stocks, including Income Focus, and DowHedge, and the new Sector Rotation
The Trend program seeks long-term directional changes in markets and the portfolios choose stocks that have realized profitable performance over many years combined with good short-term returns. It will hold fewer stocks when they do not meet our condition and exit the entire portfolio when there is extreme risk or a significant downturn.
Profits in the 10-Stock Equity Trend program, but modest loses in the other portfolios, including the Weekly portfolios. The picture remains sideway with a leaning upwards. It’s remarkable how the equities market has continued to withstand the Fed rate highs and talk about holding rates higher for longer. Earnings came in strong for most tech companies, which should give prices some room to move higher.

Income Focus and Sector Rotation
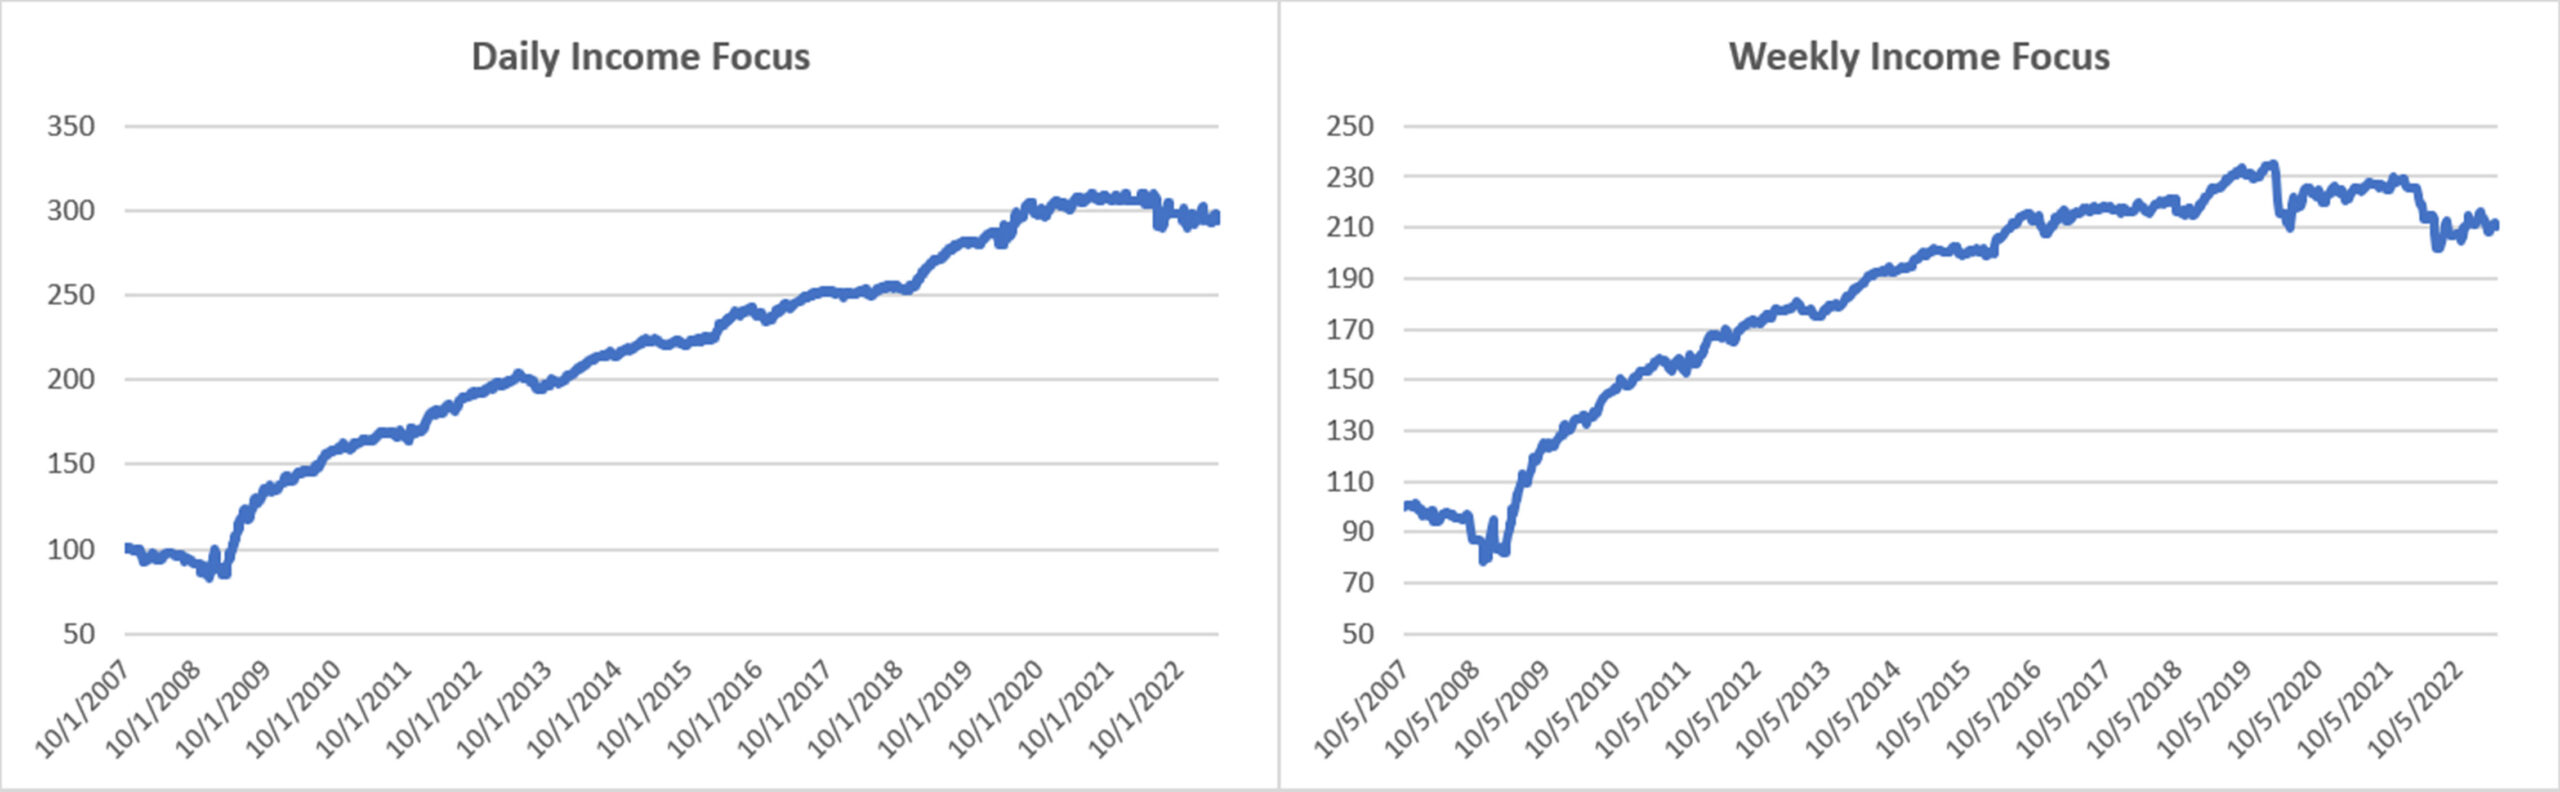
Mixed results in the Income Focus program, with both Daily and Weekly portfolios near break-even for the year. This program is now entering long positions for the first time in a while, anticipating falling yields. It is the first indication of a change in market sentiment.
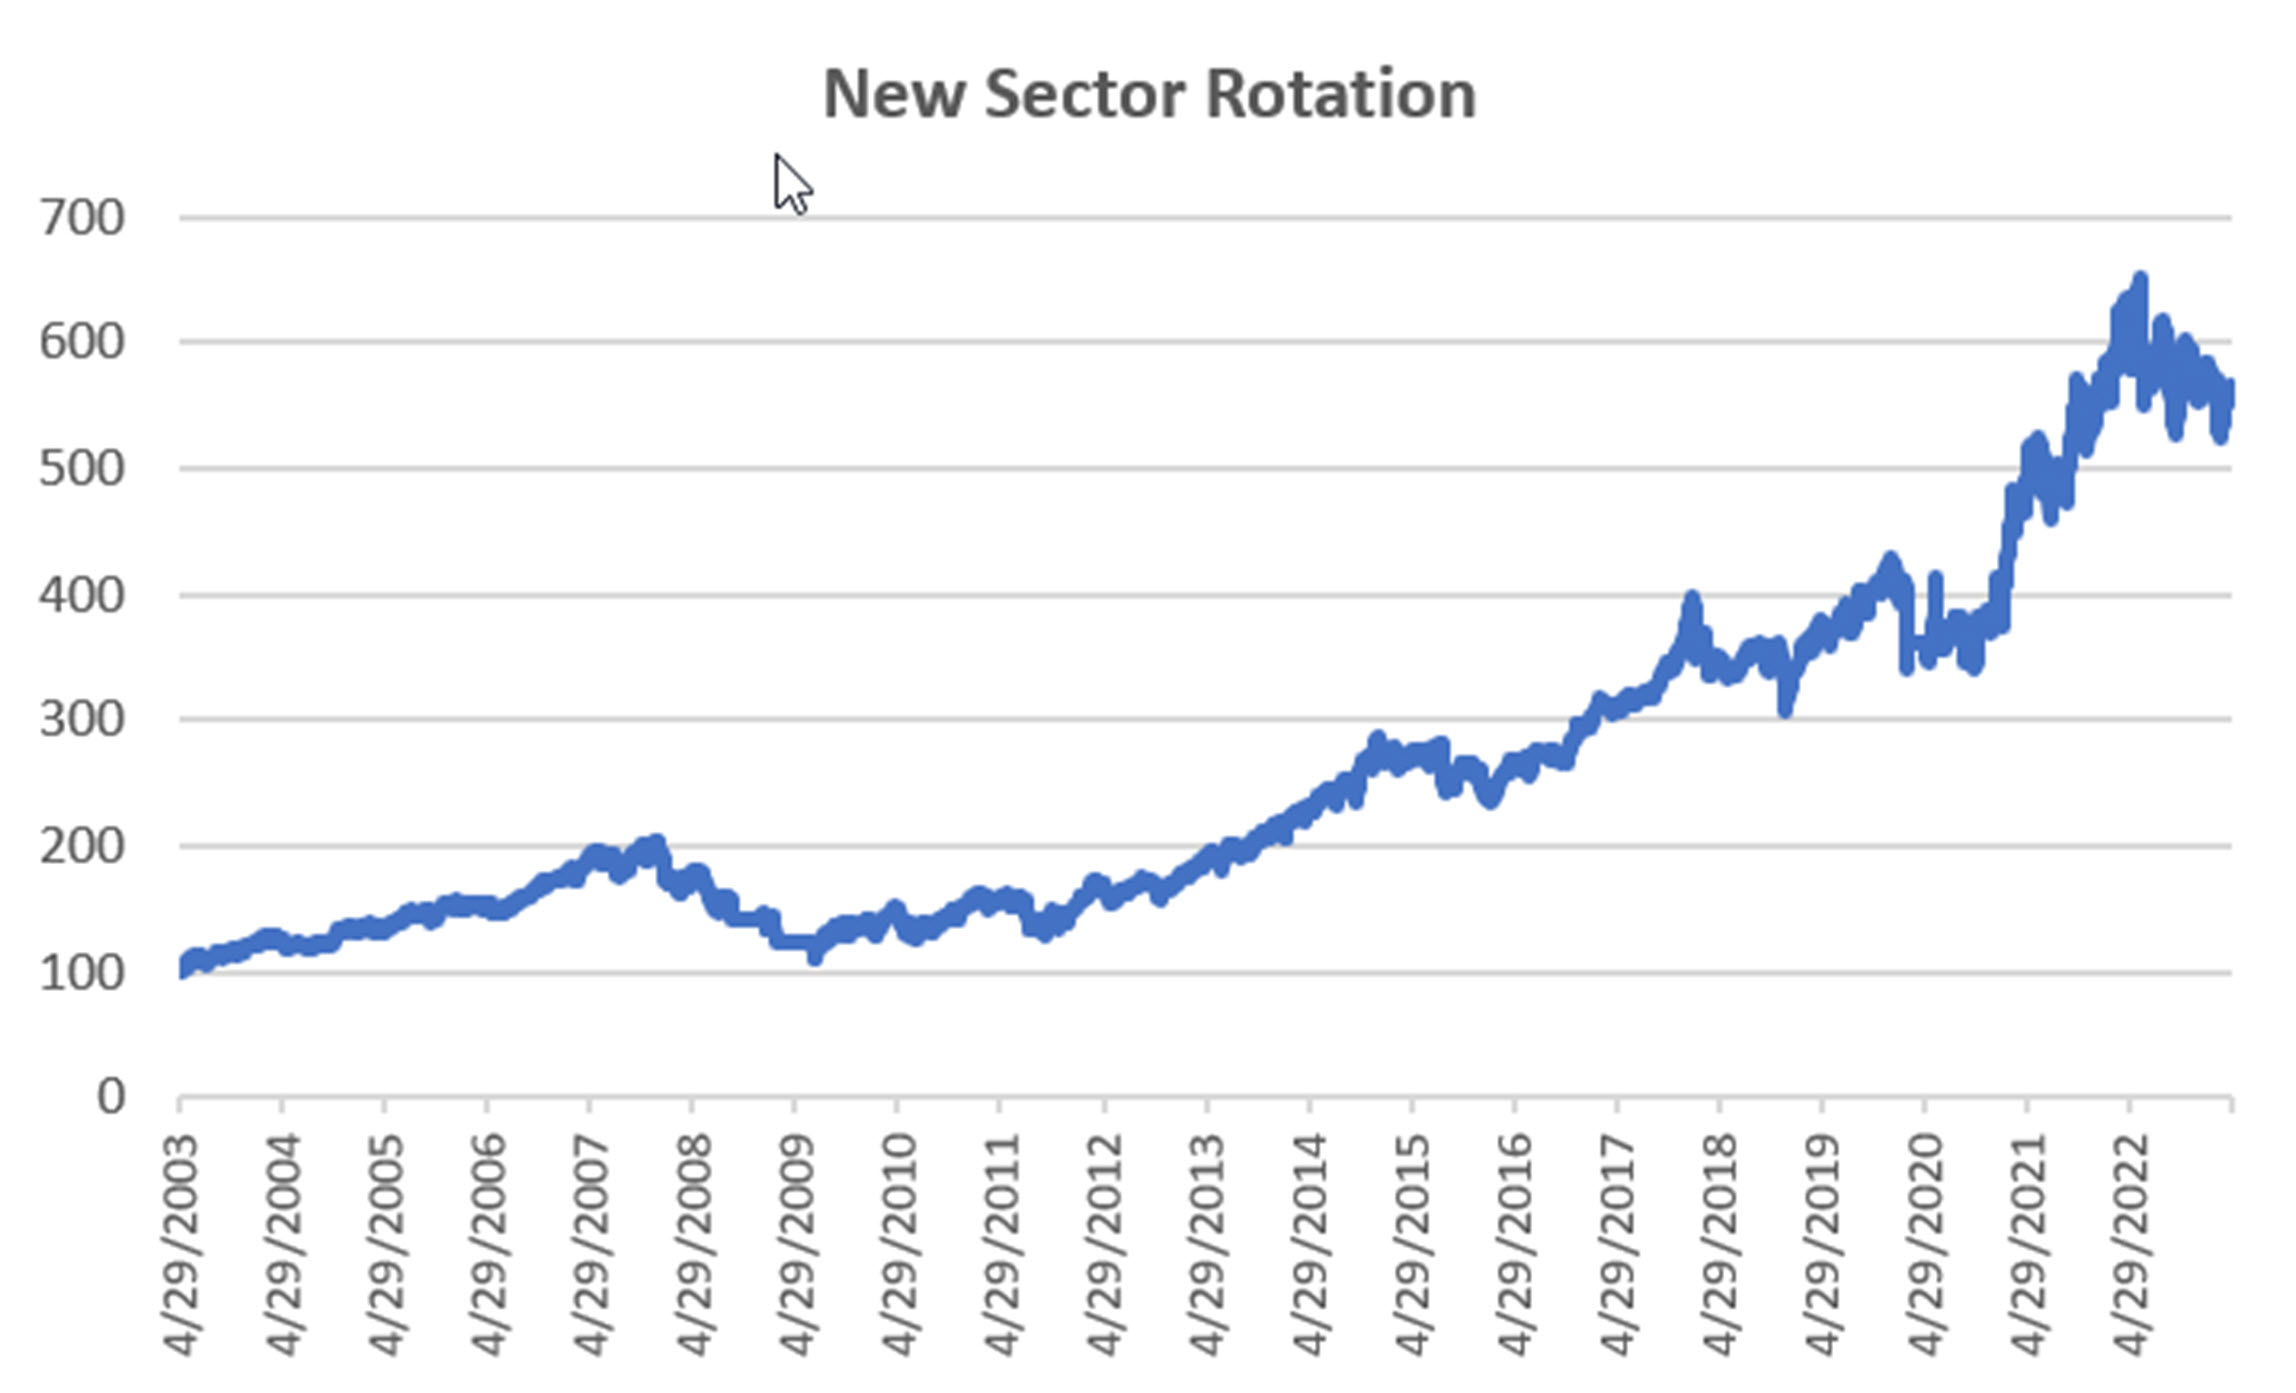
NEW Sector Rotation
Still no change in the ETFs holding for the new Sector Rotation program: Financials, Staples, and Utilities. But they are doing well with gains this month and net profits for the year. We will believe that the market is finally recovering when this program switches to more aggressive sectors.
DowHedge Programs
Small changes in returns for both the Daily and Weekly portfolios, but the Weekly is clearly outperforming the Daily program, showing signs of a nice move higher and up nearly 8% for the year. Trading the best of the biggest, we expect this to outperform the overall market.

Group DE2: Divergence Program for Stocks
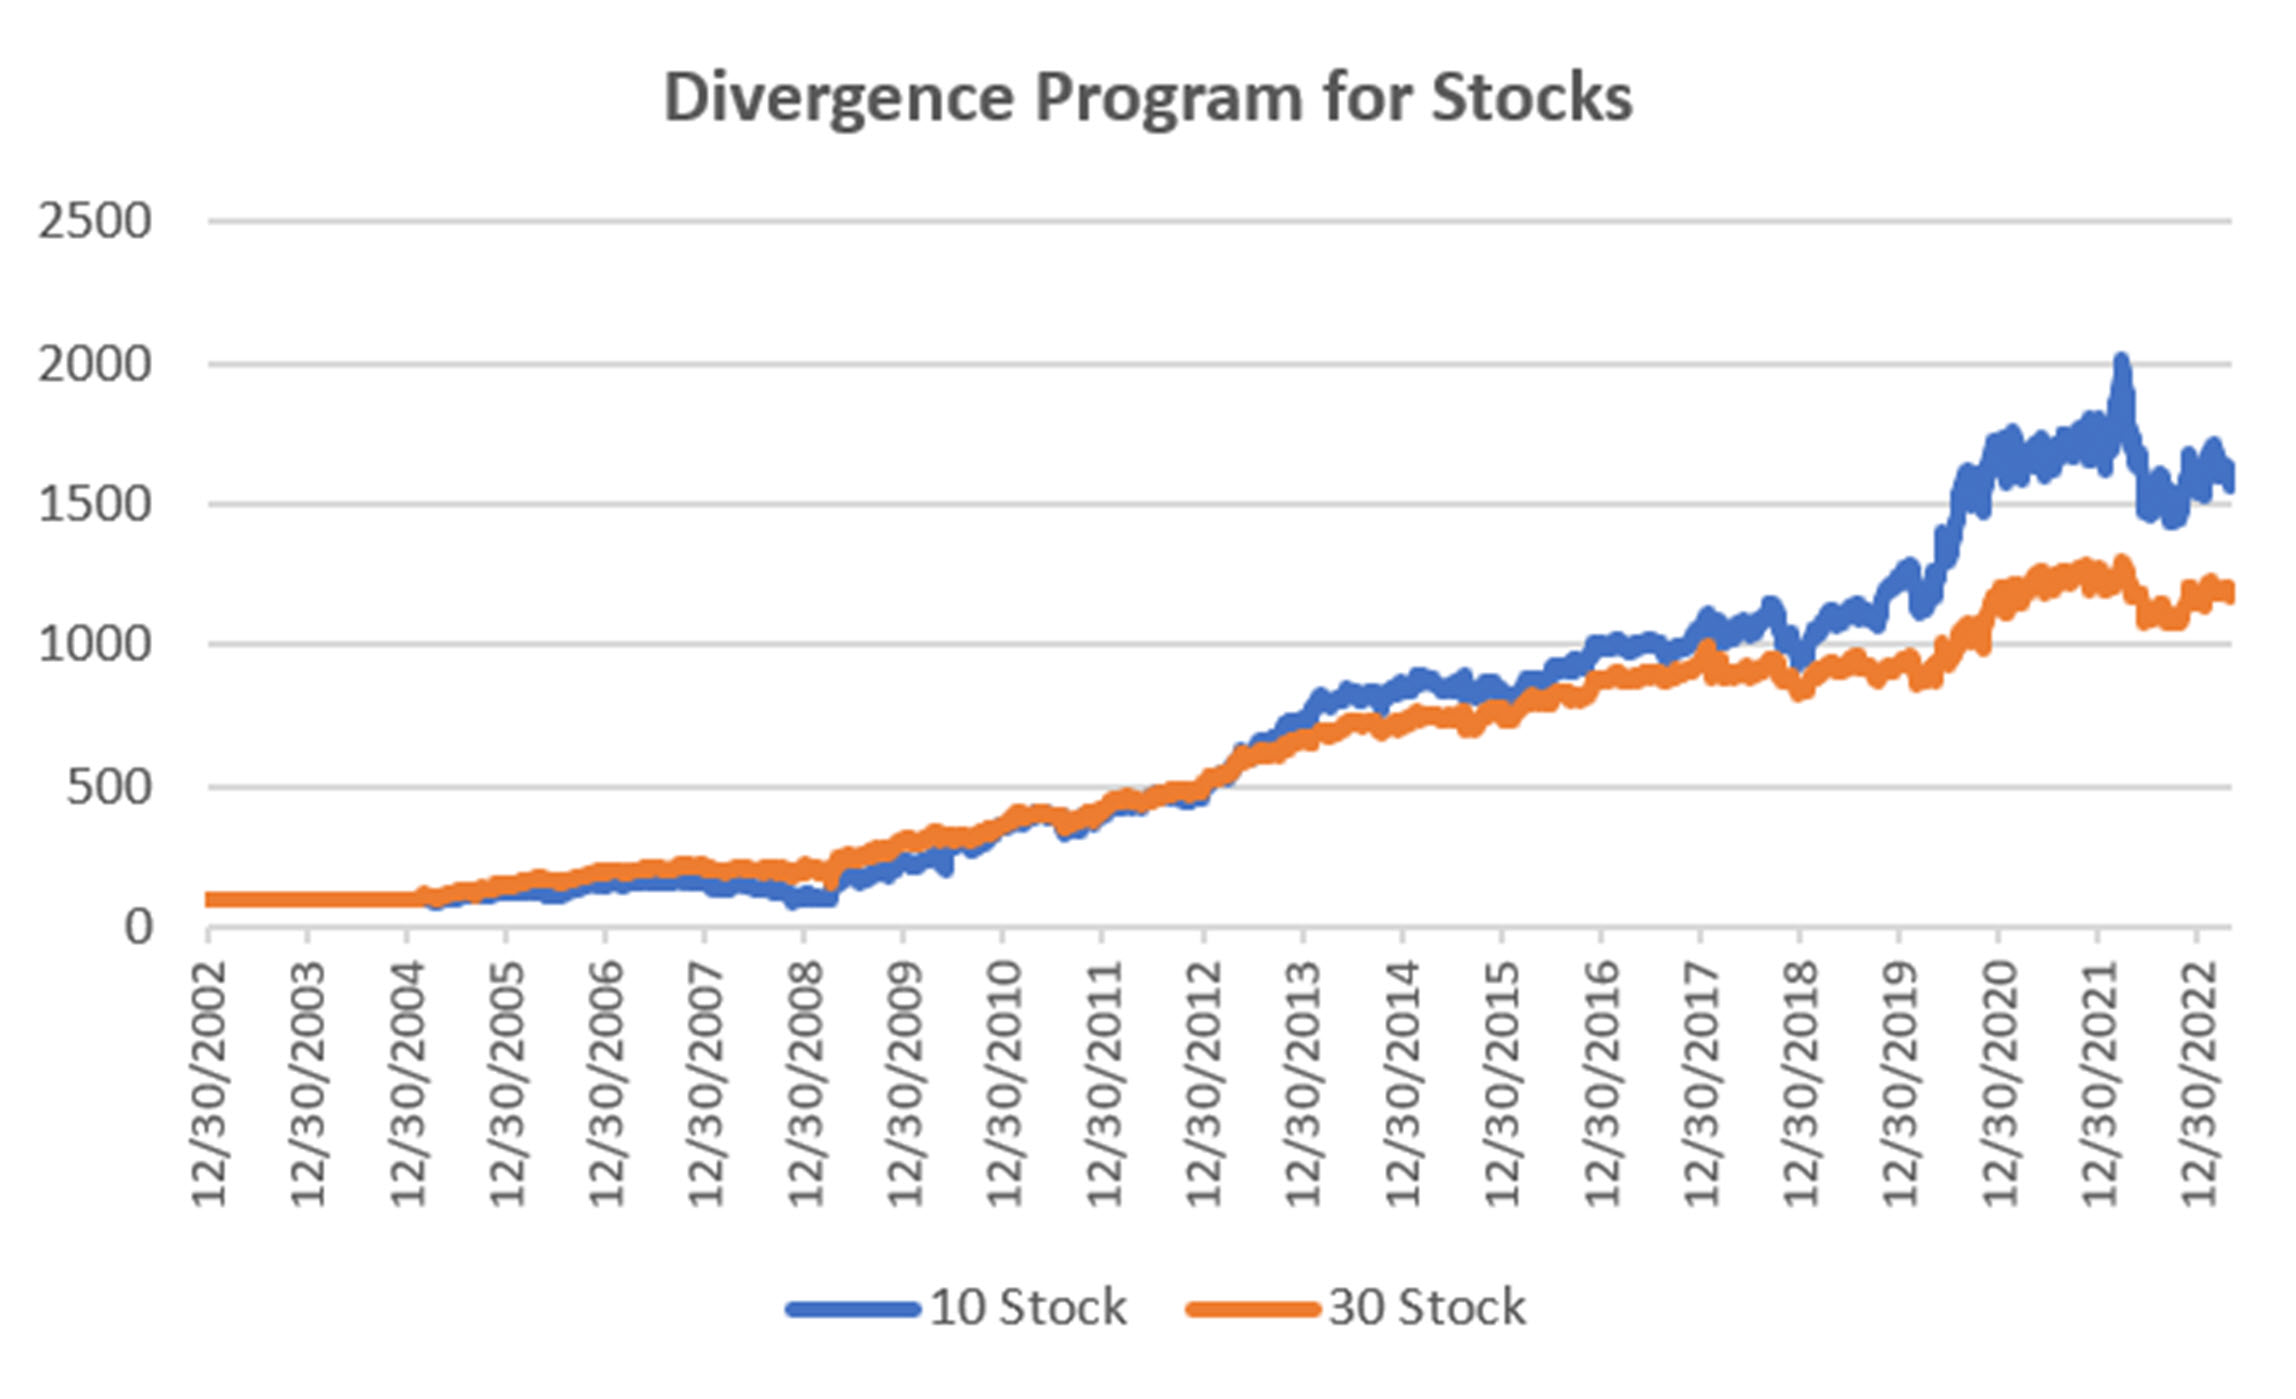
The Divergence program looks for patterns where price and momentum diverge, then takes a position in anticipation of the pattern resolving itself in a predictable direction, often the way prices had moved before the period of uncertainty.
Small losses and mixed results for the year in the Equity Divergence program. As we have mentioned before, this program tries to capture the pause and restart of a trending move. Given that the market is not yet trending, small gains and losses will be the profile.
Group DE3: Timing Program for Stocks
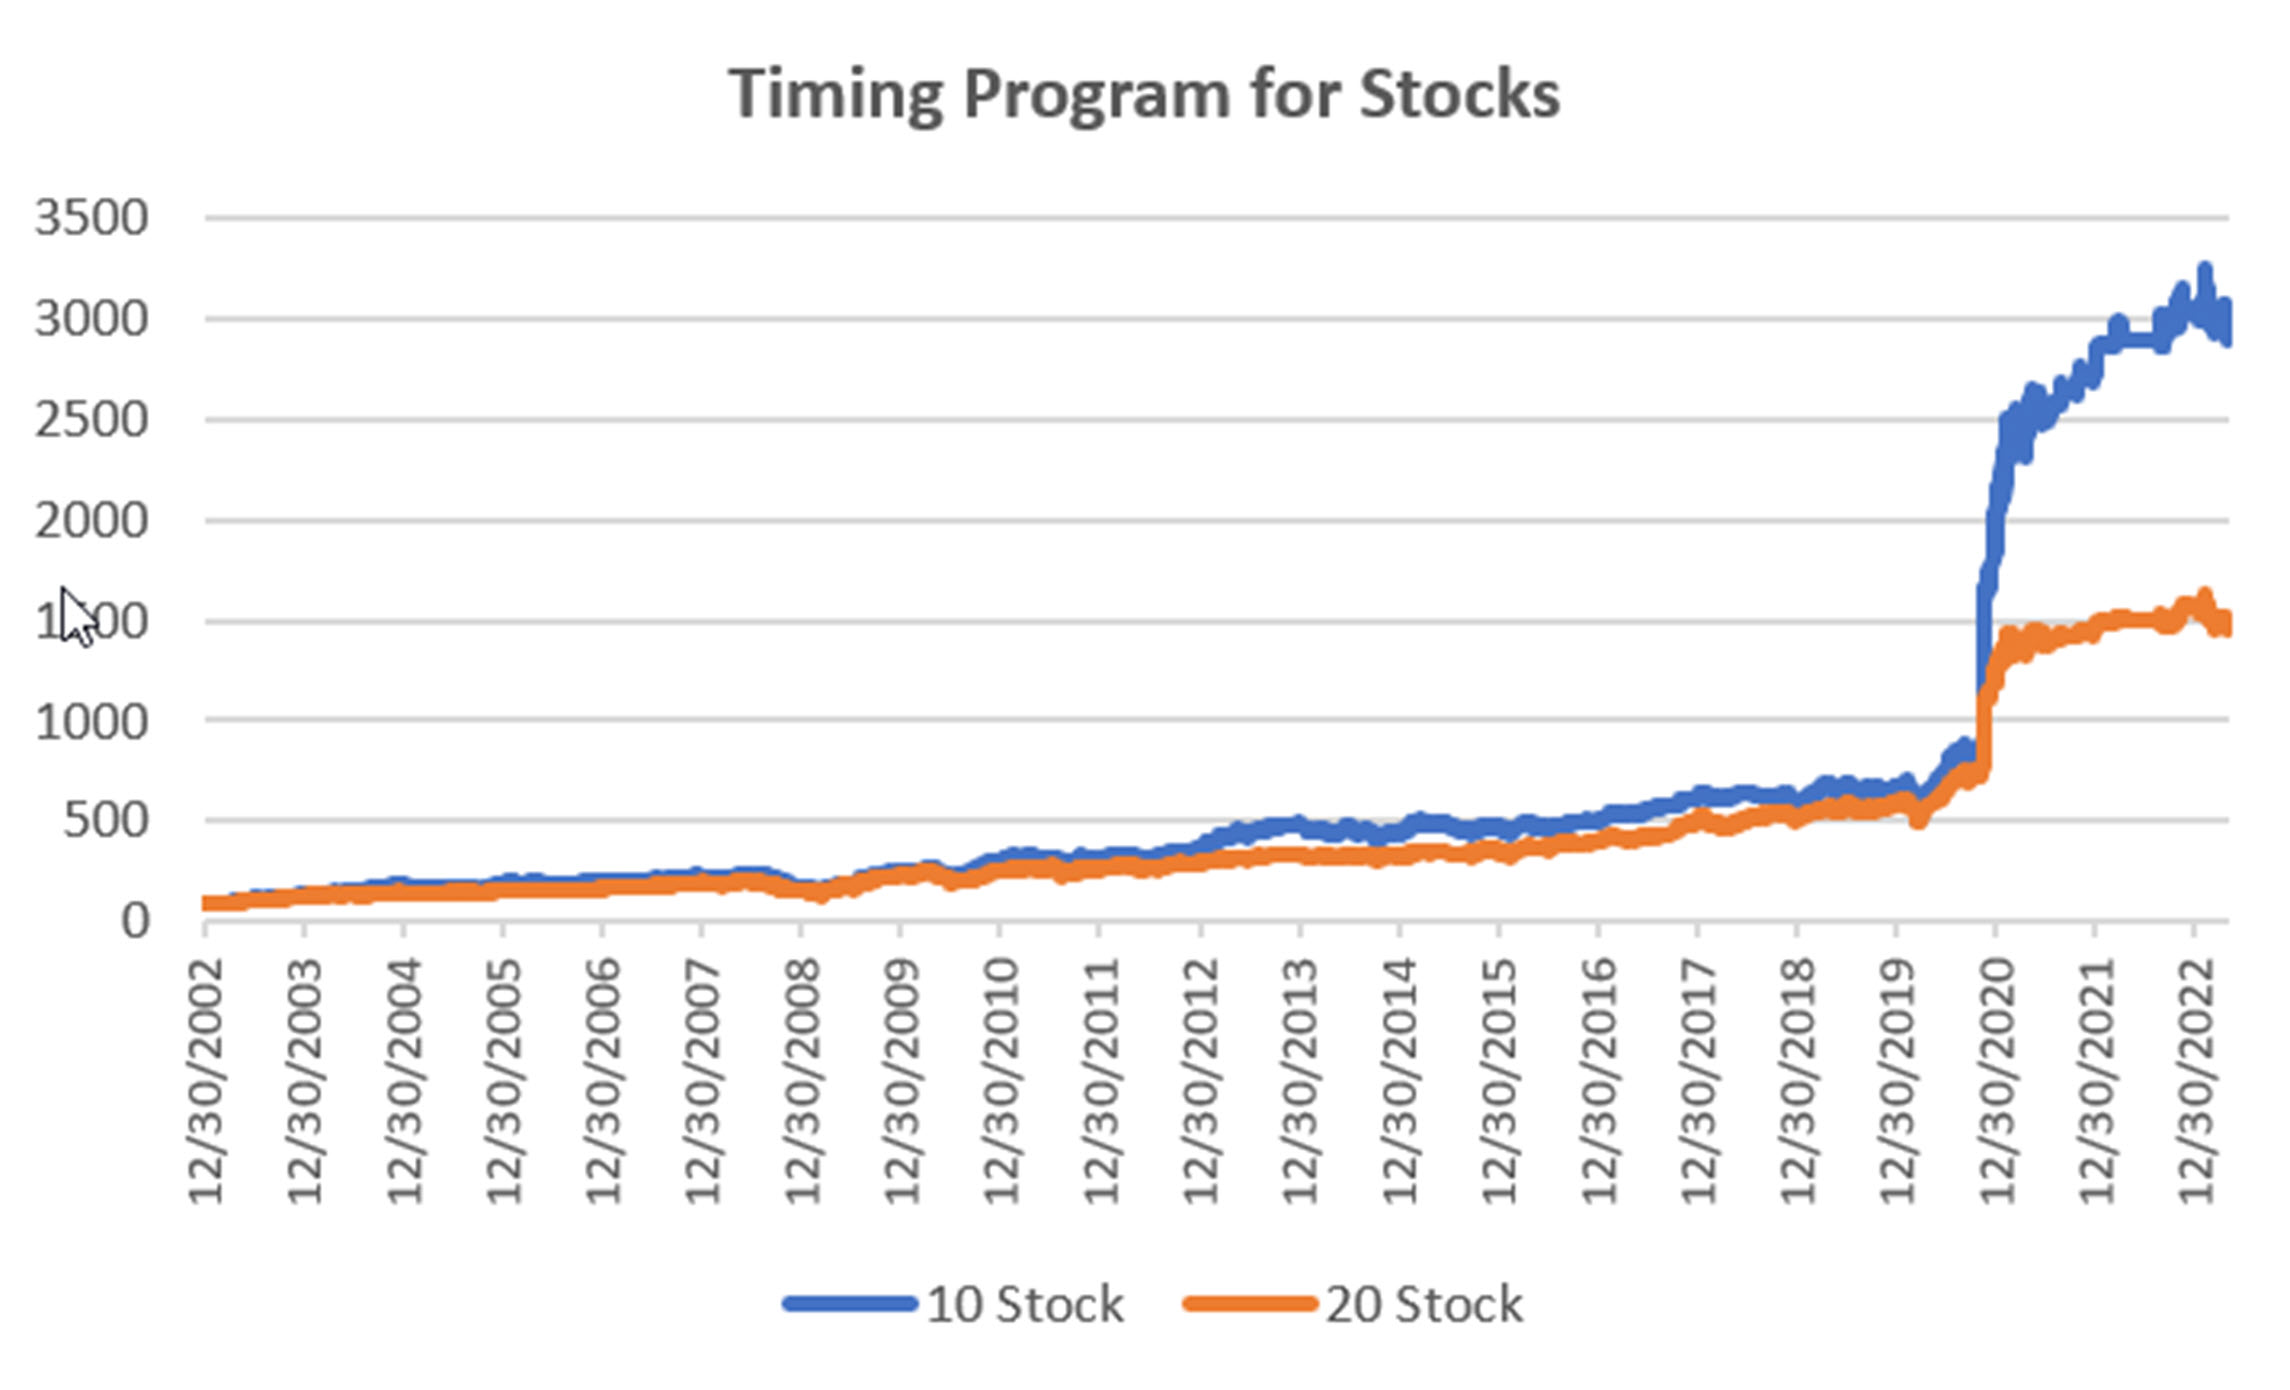
The Timing program is a relative-value arbitrage, taking advantage of undervalued stocks relative to its index. It first finds the index that correlates best with a stock, then waits for an oversold indicator within an upwards trend. It exits when the stock price normalizes relative to the index, or the trend turns down. These portfolios are long-only because the upwards bias in stocks and that they are most often used in retirement accounts.
Higher by almost 3% in the 10-Stock Portfolio, and 2% in the 20-Stock, this program also is waiting for a clear trend to capitalize on pullbacks and recoveries. So far, sustained trends are hard to come by, the program is still performing well.
Futures Programs
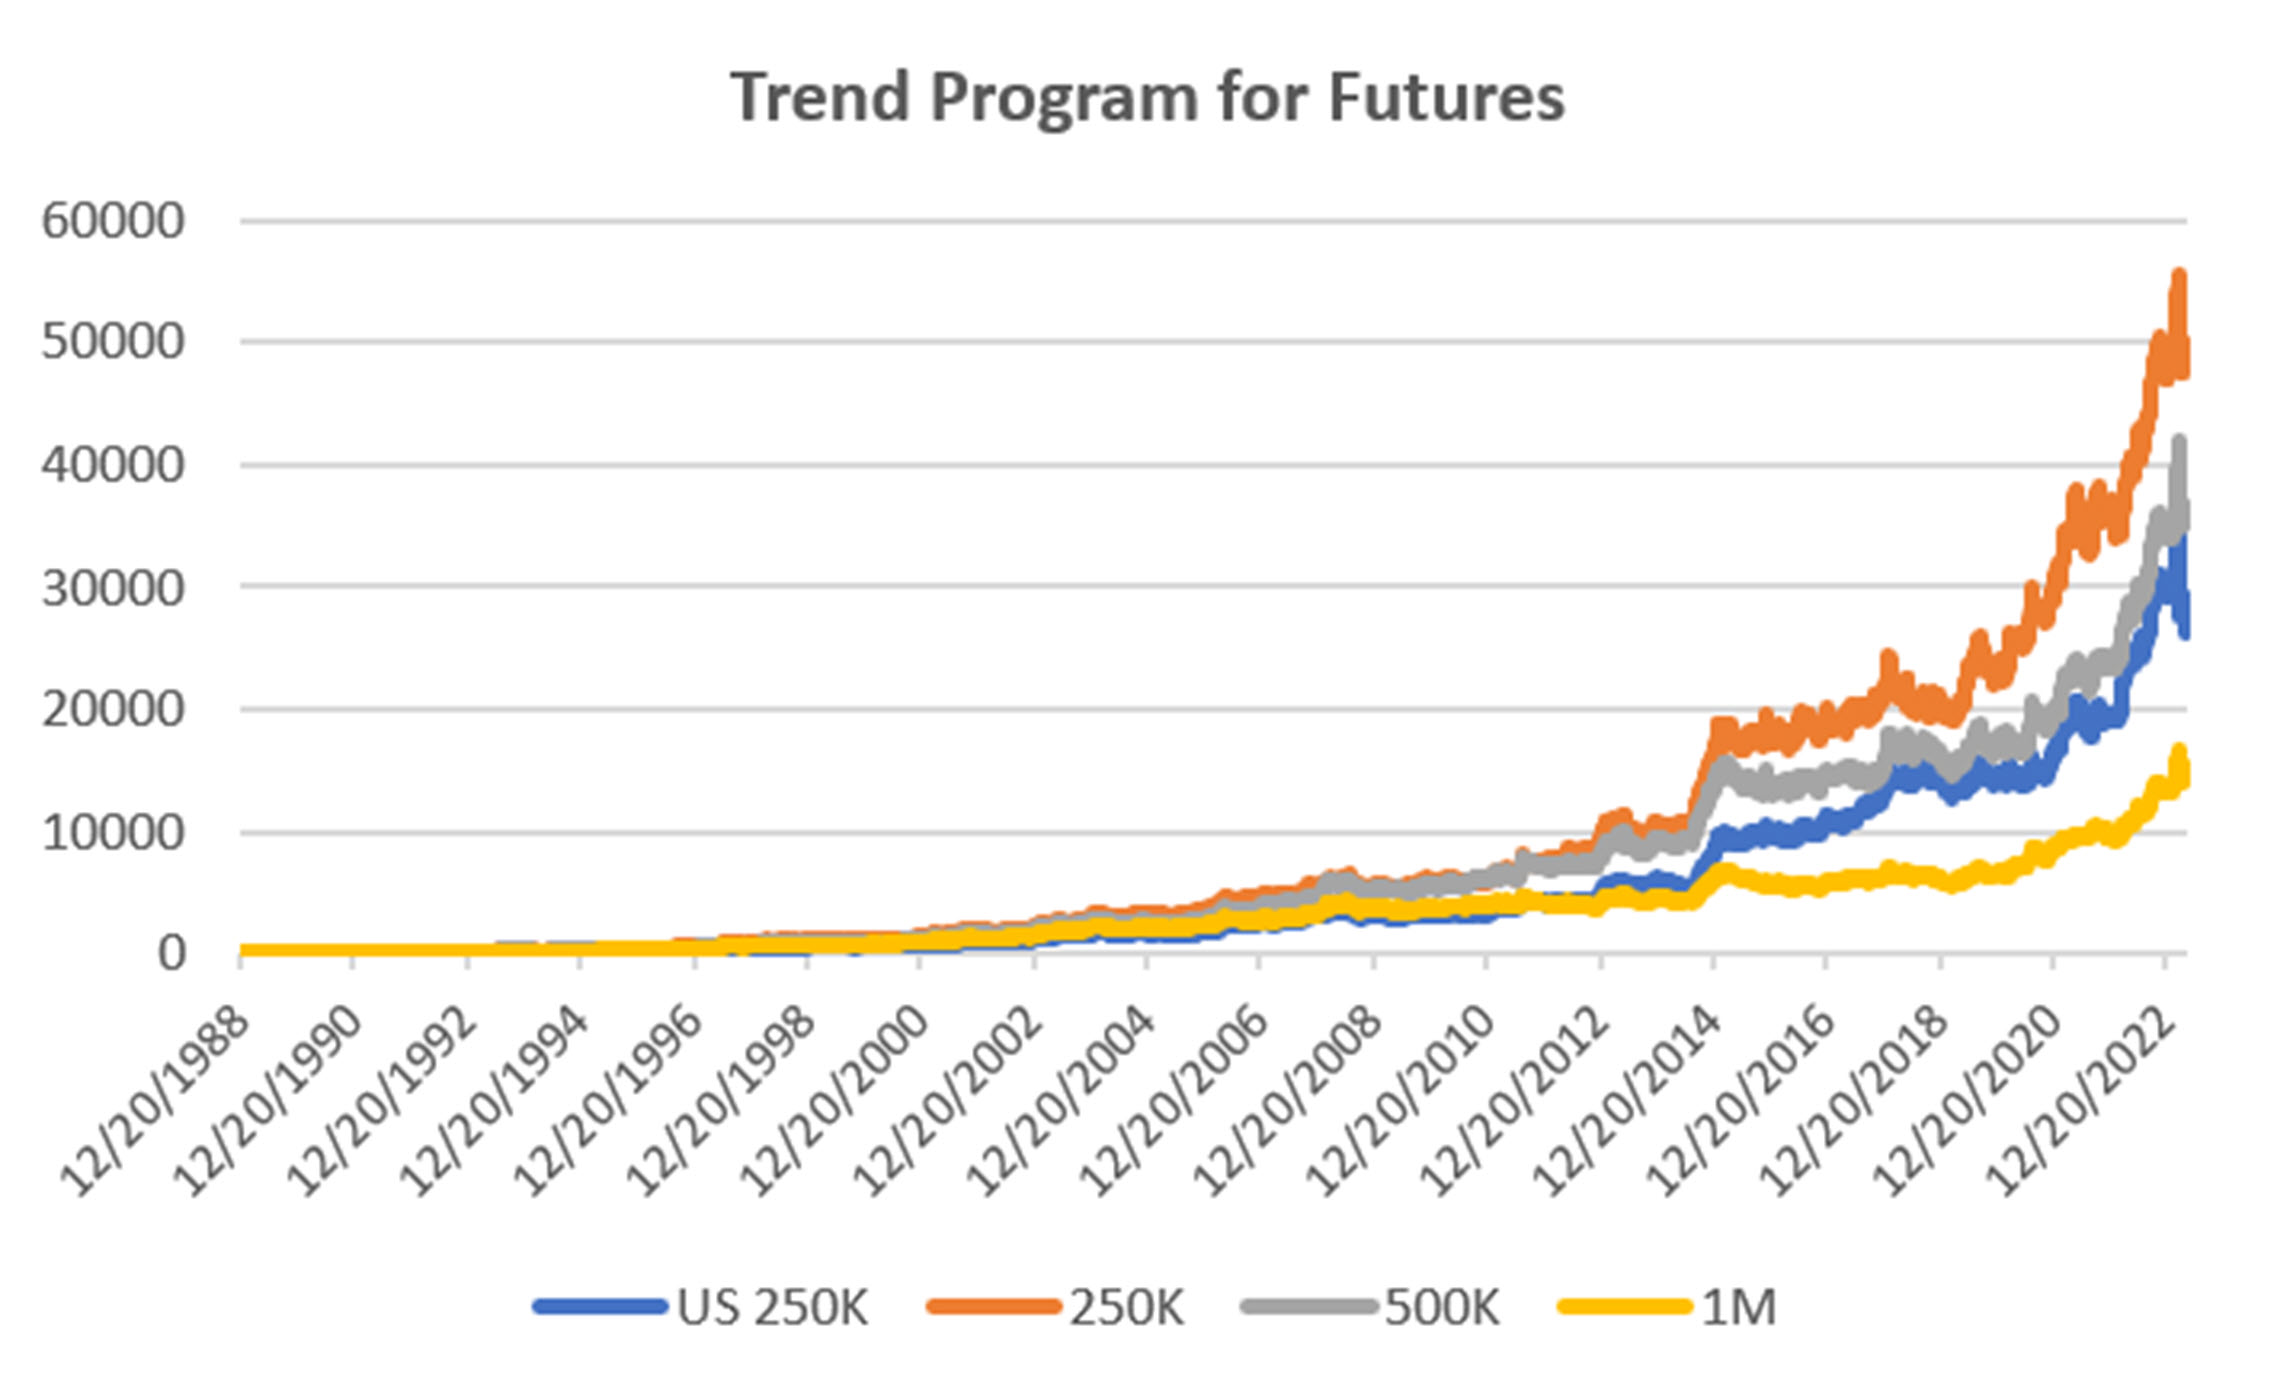
Groups DF1 and WF1: Daily and Weekly Trend Programs for Futures
Futures allow both high leverage and true diversification. The larger portfolios, such as $1million, are diversified into both commodities and world index and interest rate markets, in addition to foreign exchange. Its performance is not expected to track the U.S. stock market and is a hedge in every sense because it is uncorrelated. As the portfolio becomes more diversified its returns are more stable.
The leverage available in futures markets allows us to manage the risk in the portfolio, something not possible to the same degree with stocks. This portfolio targets 14% volatility. Investors interested in lower leverage can simply scale down all positions equally in proportion to their volatility preference. Note that these portfolios do not trade Asian futures, which we believe are more difficult for U.S. investors to execute. The “US 250K” portfolio trades only U.S. futures.
Most of the futures program held steady in April, but the smallest US $250K portfolio took another hit in the Eurodollar contract. We have now modified its exposure to avoid any overweighting in the future. As you can see by the “new” Eurodollar chart, the sudden rally in March generated a surprising loss and now rates are again inching higher. It is a difficult scenario for a trend-following system. Fortunately, it is a rare event. The system has now opted for exiting the Eurodollars.
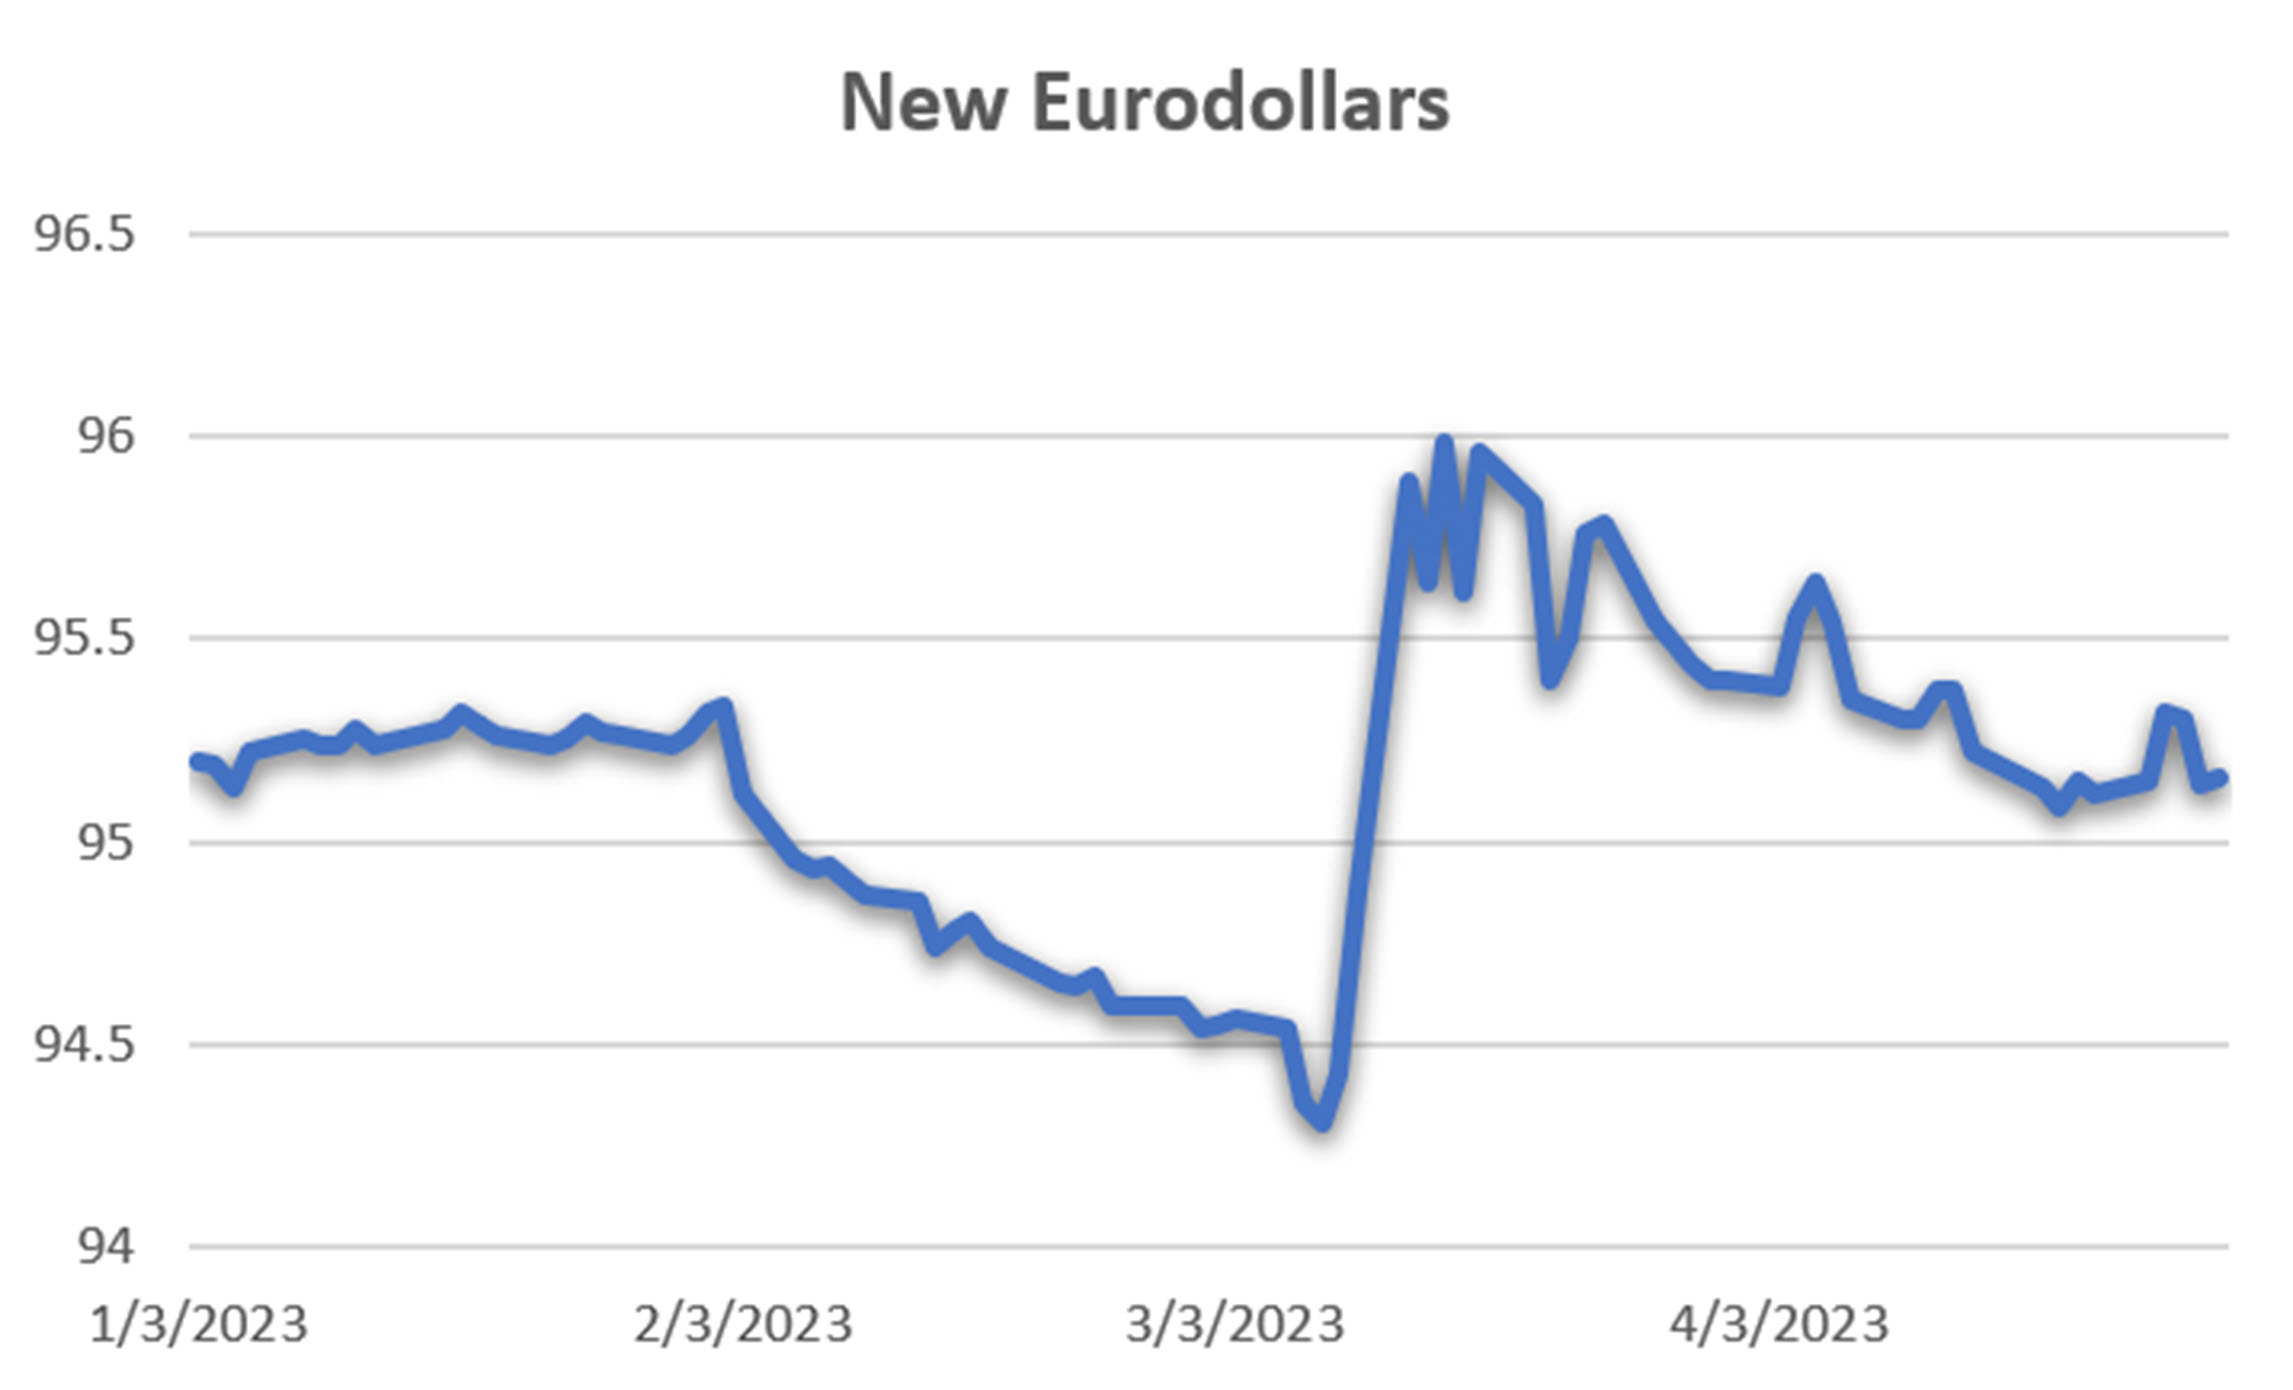
Eurodollar recent prices
Overall, the Futures program looks good. It should not be surprising that it is volatile after a gain of 50% last year. Systems often give back after large gains. Unfortunately, we never know when or how much. The chart below still looks good.
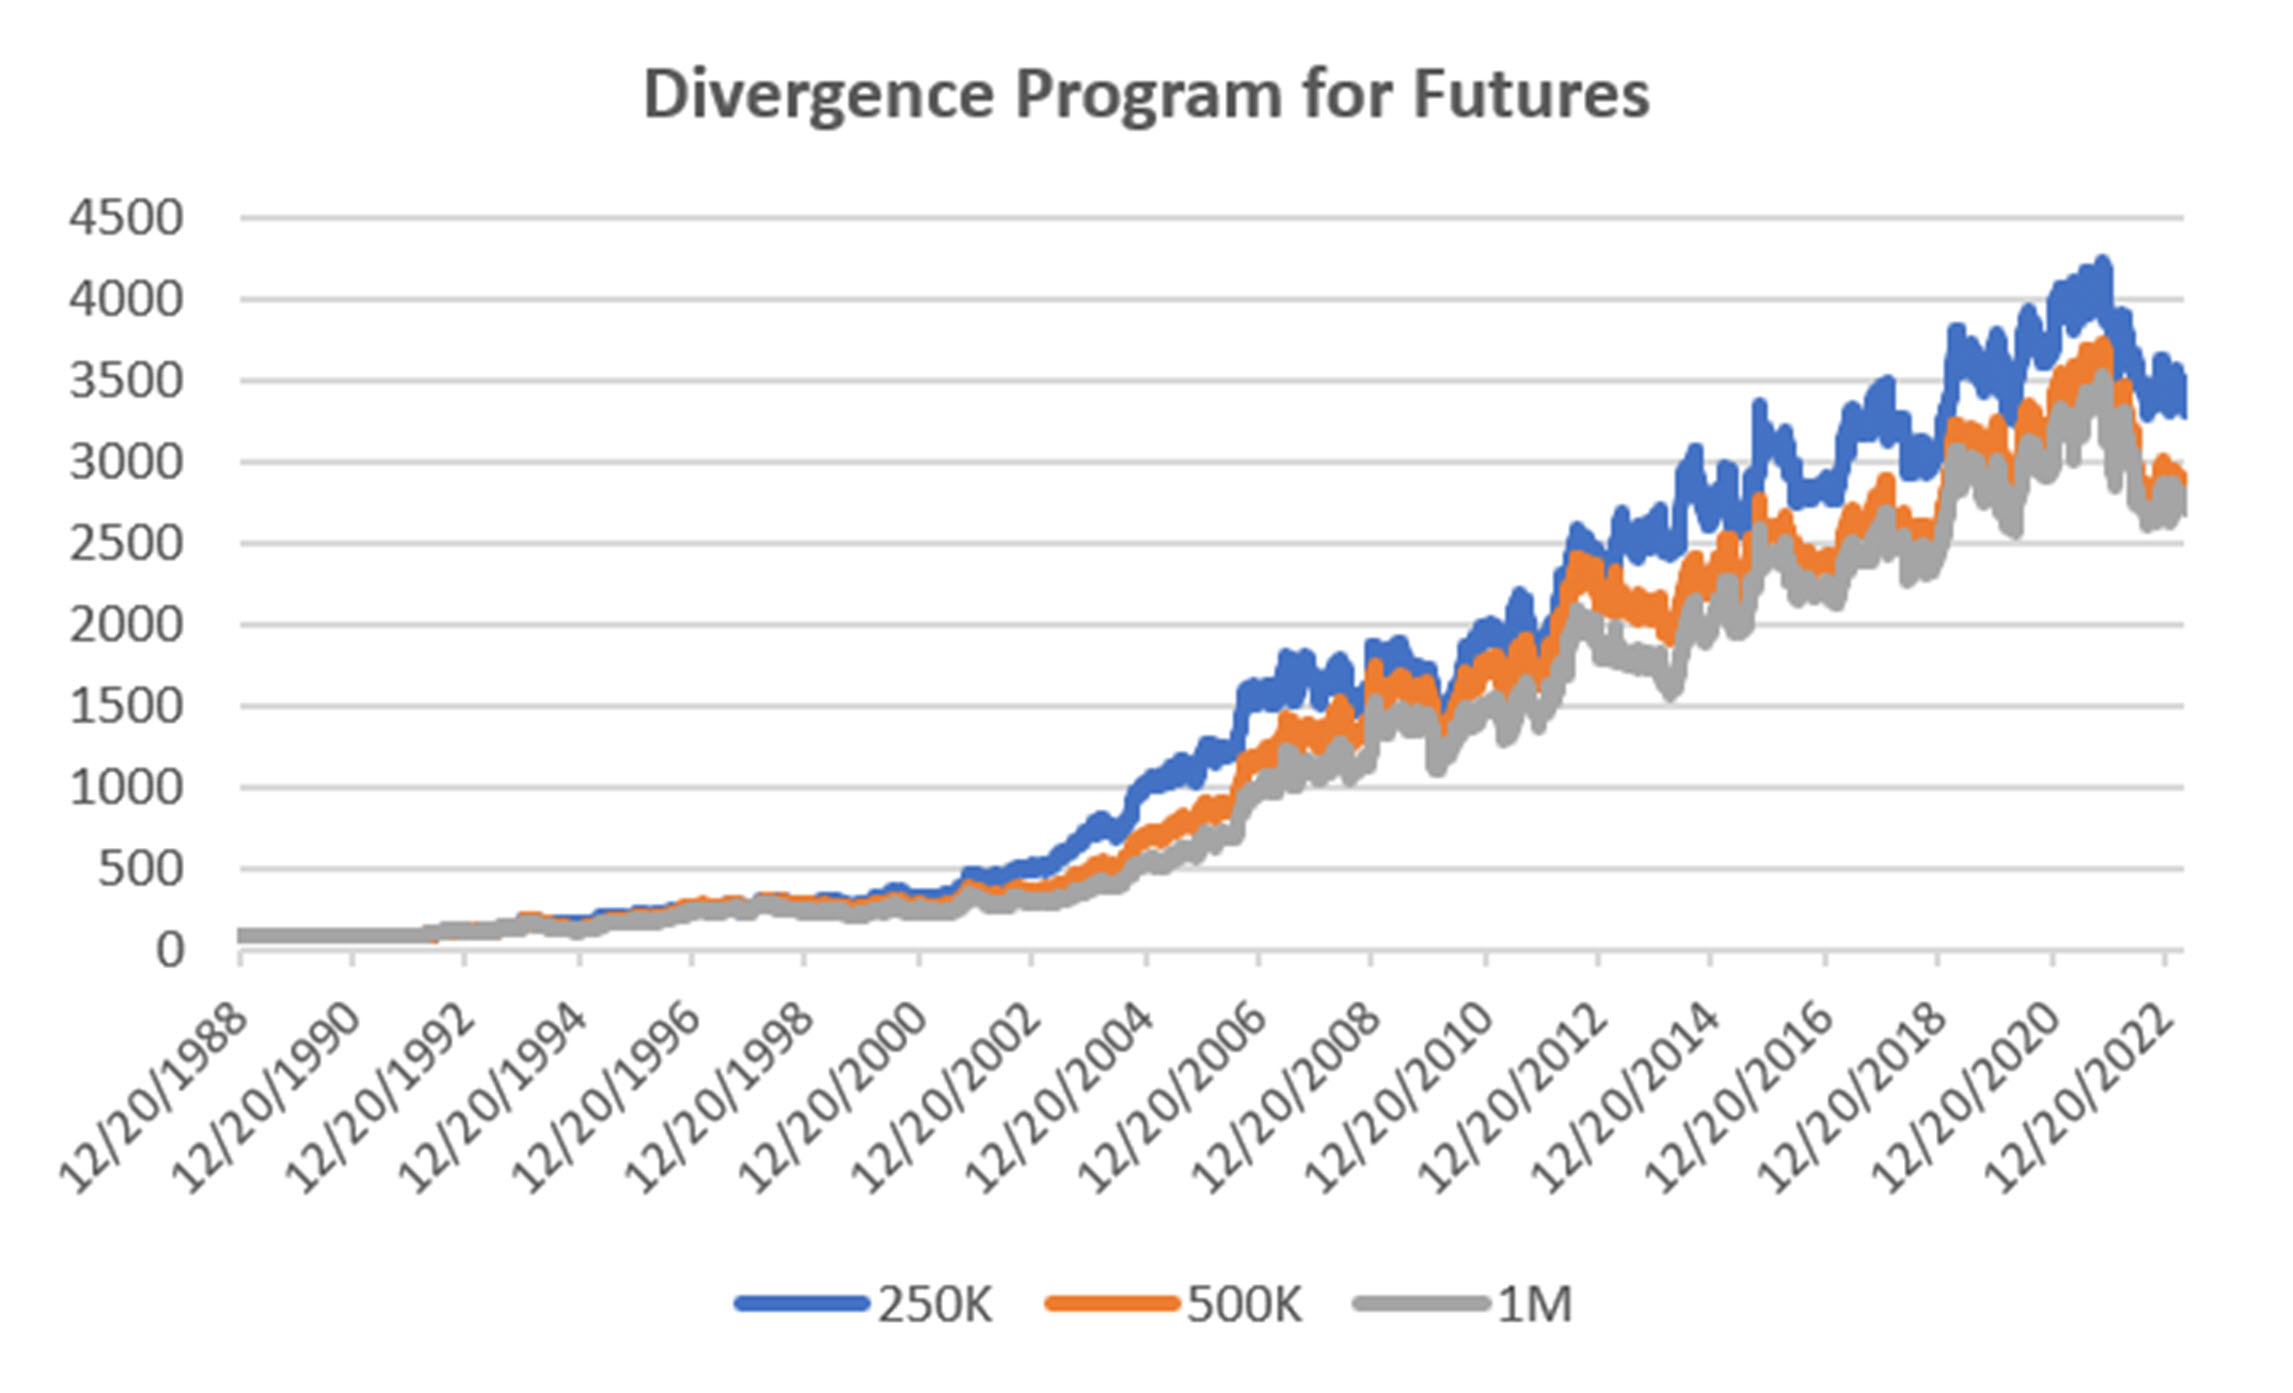
Group DF2: Divergence Portfolio for Futures
Small losses for the Futures Divergence Portfolio, but holding on to gains for the year. It is not clear where the trends are in the major sectors, and this program, as with the Equity Divergence program, needs a trend to produce profits, even though it only captures a small market of that move. A gain next month will show that the overall market sentiment has changed.
Blogs and Recent Publications
Perry’s books are all available on Amazon or through our website, www.kaufmansignals.com.
April 2023
On April 18th, Perry gave a webinar to the Society of Technical Analysts (London) on how to develop and test a successful trading system. Check their website for more details, https://www.technicalanalysts.com..
The April issue of Technical Analysis of Stocks & Commodities published a new article by Perry, “Repatriation,” an interesting trading pattern used by FX traders but adapted for us “normal traders.”
March 2023
Perry was interviewed by Mark Ursell of Ursell of TradeInform on March 3. You can see it or listen to it on UTube https://www.youtube.com/watch?v=9gIlIIzngCk. Or, you can listen to it at
A new article by Perry, “Can Volume Predict Price?” in the March issue of Technical Analysis of Stocks & Commodities. You’ll need to read it to find out!
February 2023
The February 2023 issue of Technical Analysis of Stocks & Commodities published Perry’s article, “Do Small Price Changes Matter?” It tells you whether you should be ignoring those days when prices close up or down by a fraction.
Perry gave a webinar to Eduardo Lopez’ Robotrader students in Spain on Wednesday, February 8, noon (New York).
January 2023
Another year! Technical Analysis of Stocks & Commodities published “Matching the Markets to the Strategy” in the January issue. It is a look at why certain markets do best with specific strategies and why that can materially improve results.
Alejandro de Luis will publish Perry’s article “Living Off Profits,” translated into Spanish, in the January issue of his magazine, Hispatrading. It’s a good way to practice your Spanish!
Seeking Alpha posted Perry’s article, “How To Hedge Your Equity Portfolio,” showing a way to follow the Fed action.
October 2022
An interview with Perry was featured in the October anniversary issue of Technical Analysis of Stocks & Commodities. The interviewer is his wife, Barbara Diamond, giving a different perspective on his career.
September 2022
“The Real Risk of System Trading” can be found in the September issue of Technical Analysis of Stocks & Commodities. It summarizes the many way we can measure risk and suggests ways that will help you.
July 2022
The basis for this month’s Close-Up was posted on Seeking Alpha June 16. This month, Perry posted “3 Ways to Reduce Risk and 2 Ways to Increase Profits.”
June 2022
The July issue of Technical Analysis of Stocks & Commodities has Perry’s latest article, “Is It Too Volatile to Trade?” It is important to understand when the risk is greater than the reward.
Perry posted “How To Tell When the Bear Market Has Ended” on Seeking Alpha. You might find it useful if you are thinking about getting back in.
May 2022
Perry’s webinar on risk, given to the U.K. Society of Technical Analysts, can be seen using the following link: https://vimeo.com/708691362/04c8fb70ea
The presentation for MetaStock is available on Youtube using the link:
The May issue of Technical Analysis of Stocks & Commodities has a new article by Perry, “In-Sample Test Data, Out-of-Sample Data – Does It Really Matter?” It is a different look at testing.
Older Items of Interest
For older articles please scan the websites for Technical Analysis of Stocks & Commodities, Modern Trader, Seeking Alpha, ProActive Advisor Magazine, and Forbes. You will also find recorded presentations given by Mr. Kaufman at BetterSystemTrader.com, TalkingTrading.com, FXCM.com, systemtrade.pl, the website for Alex Gerchik, Michael Covel’s website, TrendFollowing.com, and Talking Trading.com.
In May 2021, Mr. Kaufman gave a 30-minute presentation, “Lagged Trends,” for The Money Show on Tuesday, May 11. You can see it using the following link: https://youtu.be/bh2fA8oBwBk
November 1, 2020, Mr Kaufman taped a session with Andrew Swanscott’s BetterSystemTrader.com.
“The 1st and 2nd Cross” has been very popular with readers. It was published in Technical Analysis of Stocks & Commodities in the March 2020 issue. It is based on an idea of Linda Raschke and captures small but reliable pieces of a trending move. You can find it online.
You will also find back copies of our “Close-Up” reports on our website, www.kaufmansignals.com. You can address any questions to perry@kaufmansignalsdaily.com.
© April 2023, Etna Publishing, LLC. All Rights Reserved.