
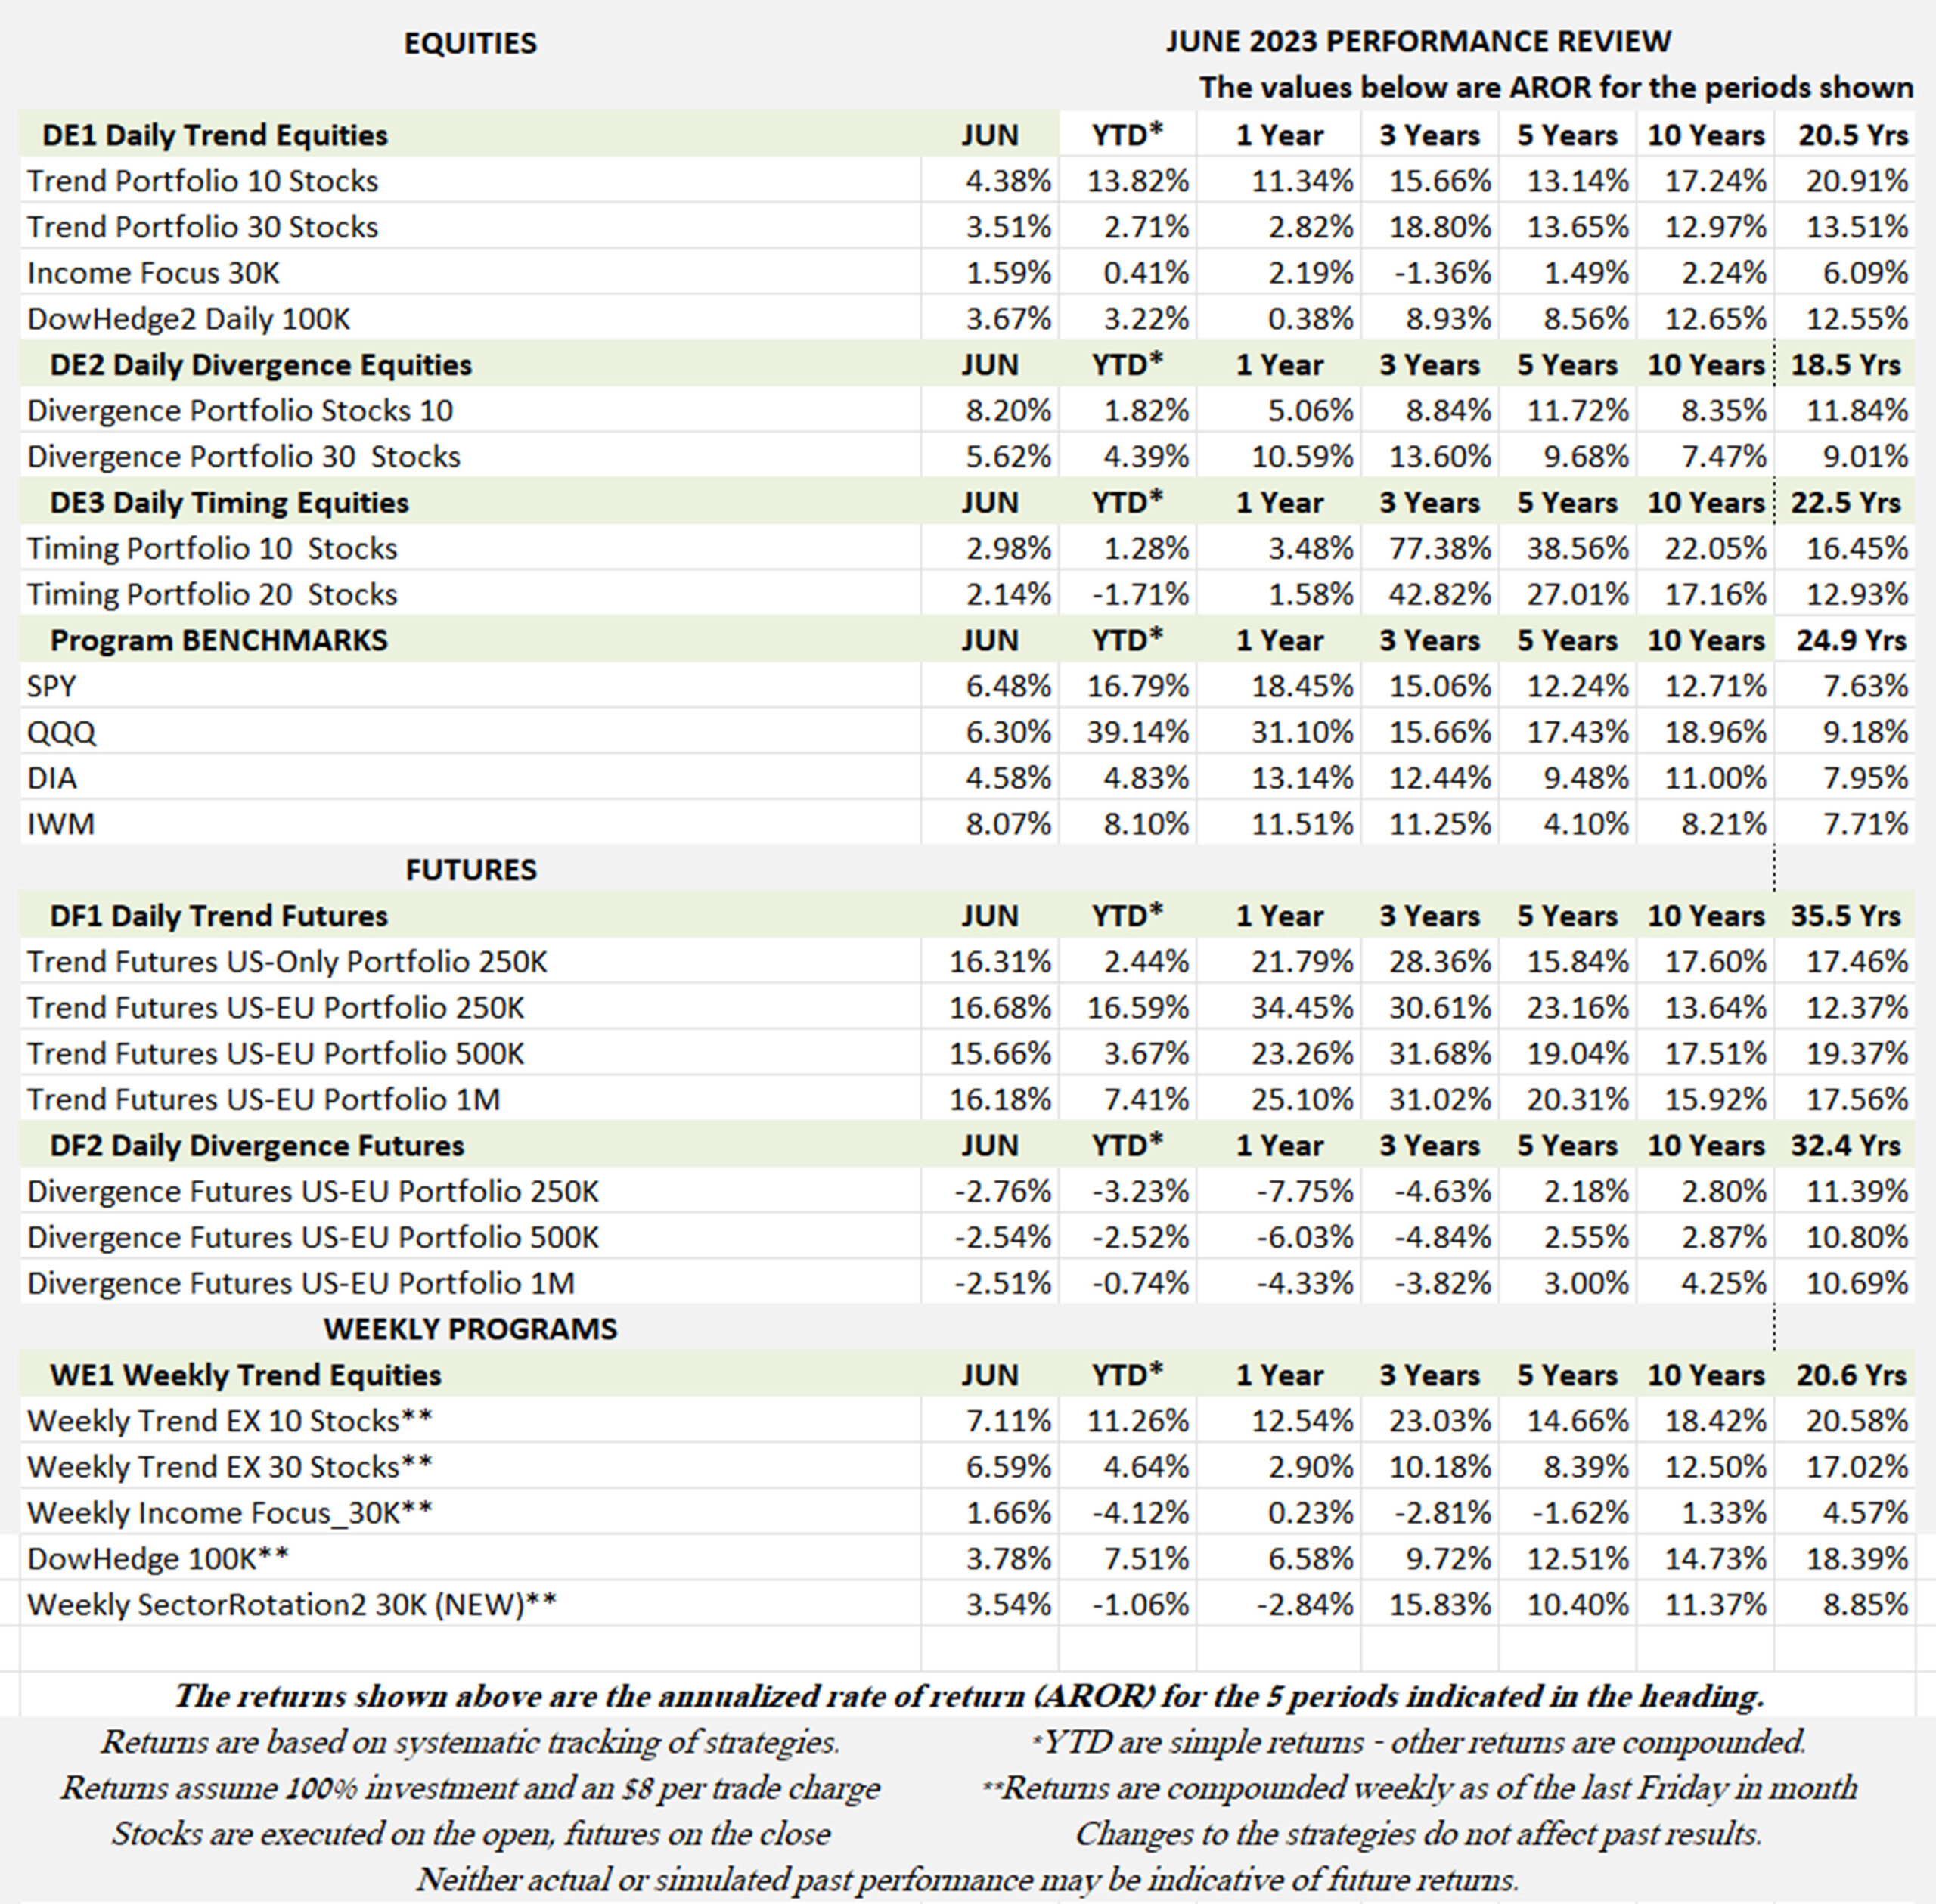
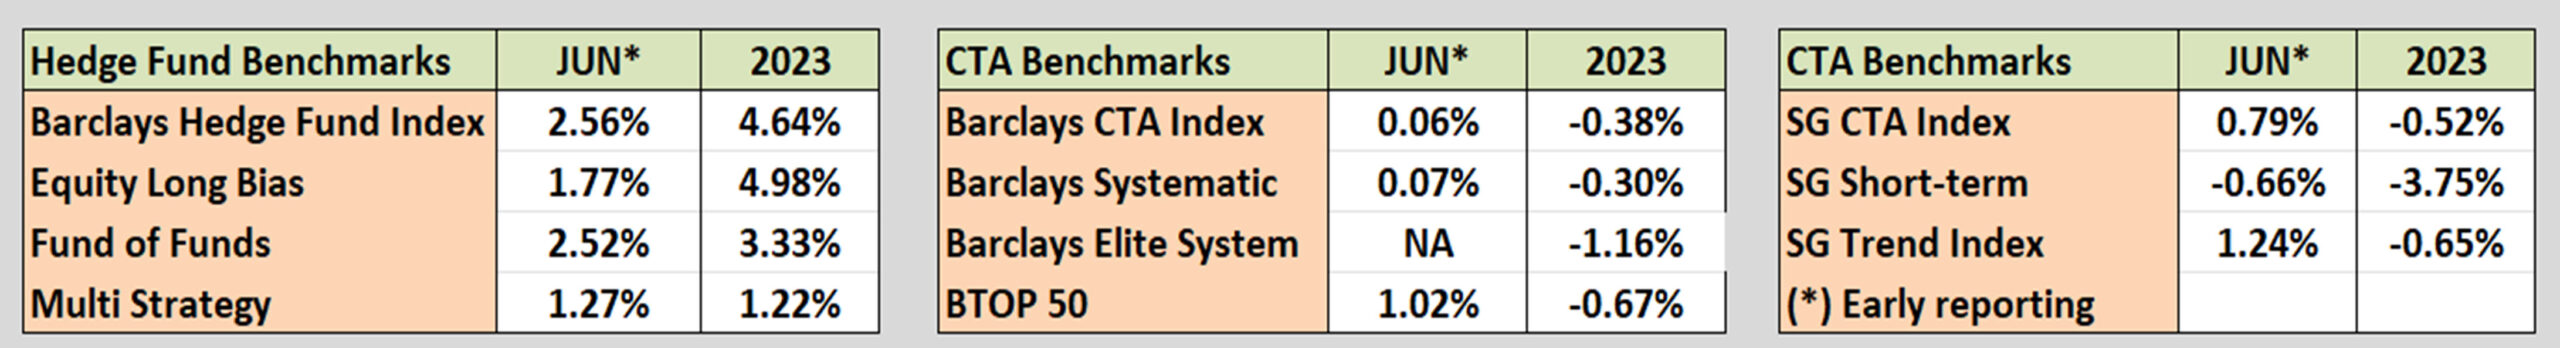
Industry Benchmark Performance
June performance for both equities and futures was surprisingly poor given that the S&P is now better by 16% and Nasdaq by 39% for the year. Granted, the gains seem to be limited to the tech and AI stocks, but the difference is remarkably large. It does show how difficult it can be to anticipate where the profits are to be made.
Kaufman’sMost Popular Books (available on Amazon)
Trading Systems and Methods, 6th Edition. The complete guide to trading systems, with more than 250 programs and spreadsheets. The most important book for a system developer.
Kaufman Constructs Trading Systems. A step-by-step manual on how to develop, test, and trade an algorithmic system.
Learn To Trade. Written for both serious beginners and practiced traders, this book includes chart formations, trends, indicators, trading rules, risk, and portfolio management. You can find it in color on Amazon.
You can also find these books on our website, www.kaufmansignals.com.
Blogs and Recent Publications
Find Mr. Kaufman’s other recent publications and seminars at the end of this report. We post new interviews, seminars, and reference new articles by Mr. Kaufman each month.
June Performance in Brief
June showed a recovery in both equities and futures. Stock selection seems to be the key. Although some of the major brokerage houses want to reduce exposure to AI stocks, they are the ones that are driving the market. Our experience with Amazon, Google, Apple, and Tesla should have taught us that some stocks keep going up, defying analyst predictions. “Overbought” is an odd concept. The stocks will go up until the don’t.
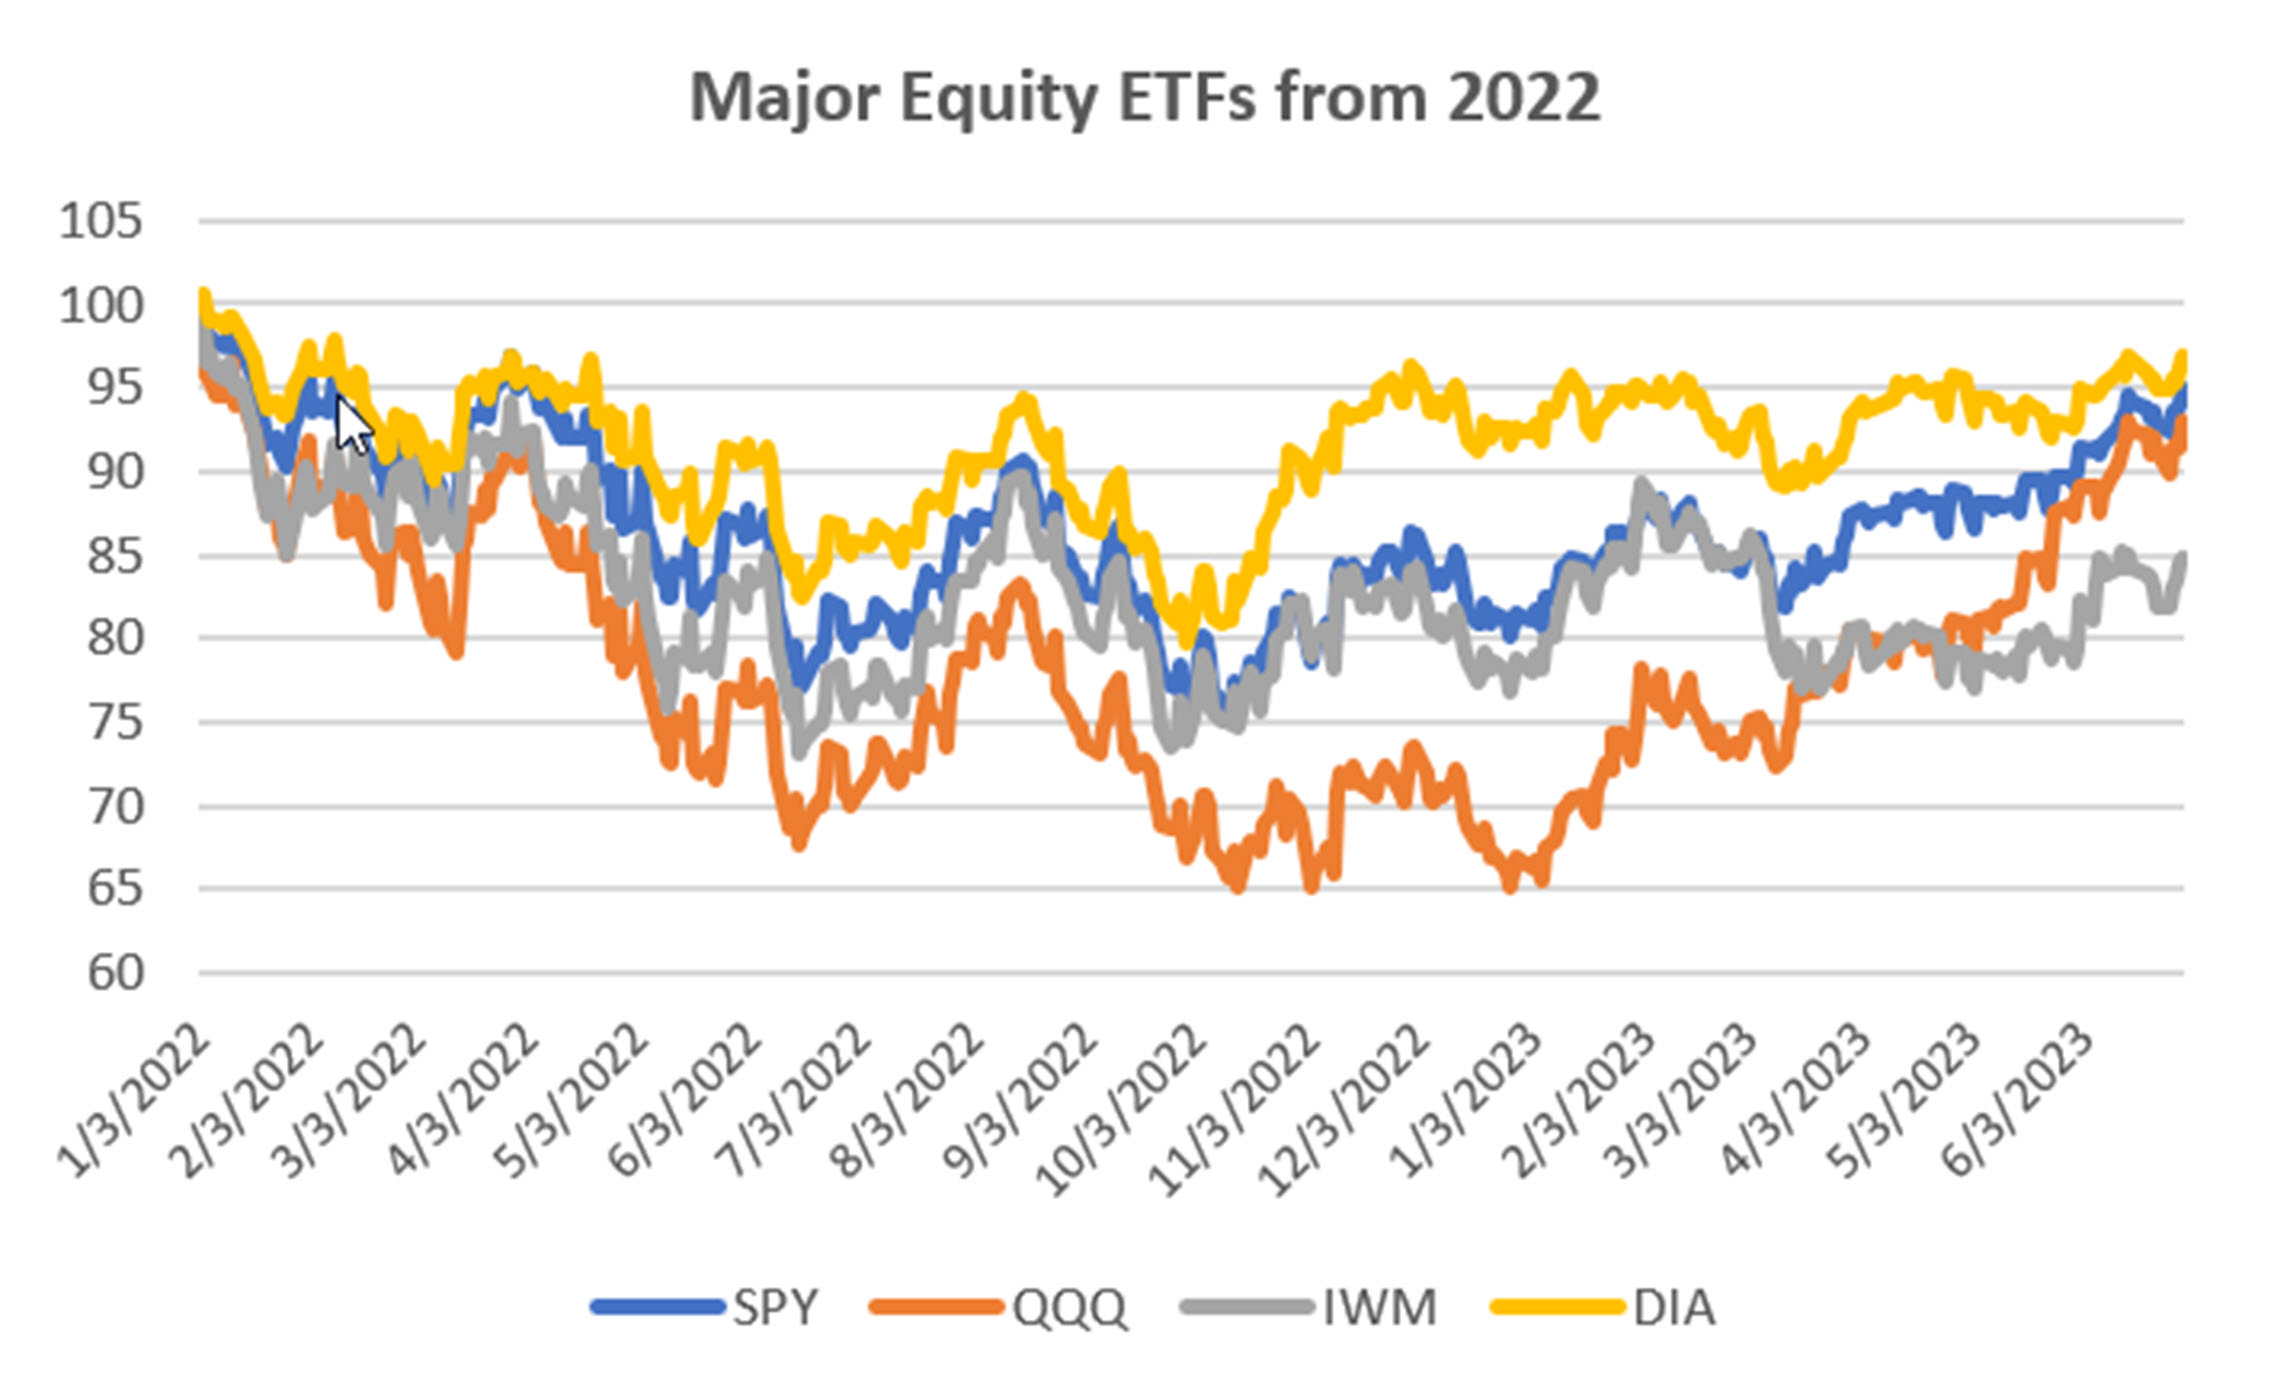
Major Equity ETFs
From going nowhere in May to looking like the beginning of a bull market, equities are a surprise and a dilemma. The Fed keeps announcing that there will be two more rate hikes, but the market thinks it’s all over, that the Fed is just “positioning” to keep the market honest. It’s not working. On Friday there was a report showing that inflation had made a precipitous drop. The market is reacting good news and ignoring bad news.
CLOSE-UP: A Technical Look at AI Stocks
ChatGPT was introduced on November 30, 2022. That’s only eight months ago, yet it is now the center of attention for traders. You cannot read the business news without seeing more companies adapting to it. There are concerns about AI replacing large swaths of jobs, improving medical diagnoses, writing essays for students, and even responding to dating apps.
As a trader, I am interested in whether AI stocks are ready for an investment. Or perhaps, we are already too late.
Grouping AI Stocks
My approach is to look at groups affected by AI technology. I’ve selected some stocks that are representative of these groups. You should know the companies, so I will only use the symbols:
- Chip makers: NVDA, AMD, TSM, AVGO, TXN, QCOM
- Semiconductor ETFs: SMH, SOXX, XSD
- AI Active Users: GOOGL, AAPL, META, MSFT
- Anticipated Users: JPM, SBUX, LLY
The list of users comes from The Economist (June 25, 2023)
State of the Art
I’ve done some exploring using ChatGTP and it’s fascinating. To ease your minds, it will not tell you how to trade or find the best trading system. And I don’t want AI choosing the stocks for my portfolio, but it will find information better and it can present it in a readable form rather than the typical search results that give you a list of websites, mostly advertisements.
Personally, I don’t want another AI Assistant to keep me farther from a live person. Call me old. But that’s what happens because it’s cheaper. I just keep hitting the “O” button to get past it, although it doesn’t always work.
The good news is that it will be a boon to the medical profession, hopefully recognizing problems before they are obvious to the technicians. On the other hand, there are lawsuits about copyright infringement.
A Close Look at the Groupings
Charts of the four groups are below, with the average of each group shown in the last chart. Chart 1 shows the major chip makers. Nvidia (NVDA) has been the leading company with a surge in price during the past month. Most of the other companies show gains as well, but not as impressive.
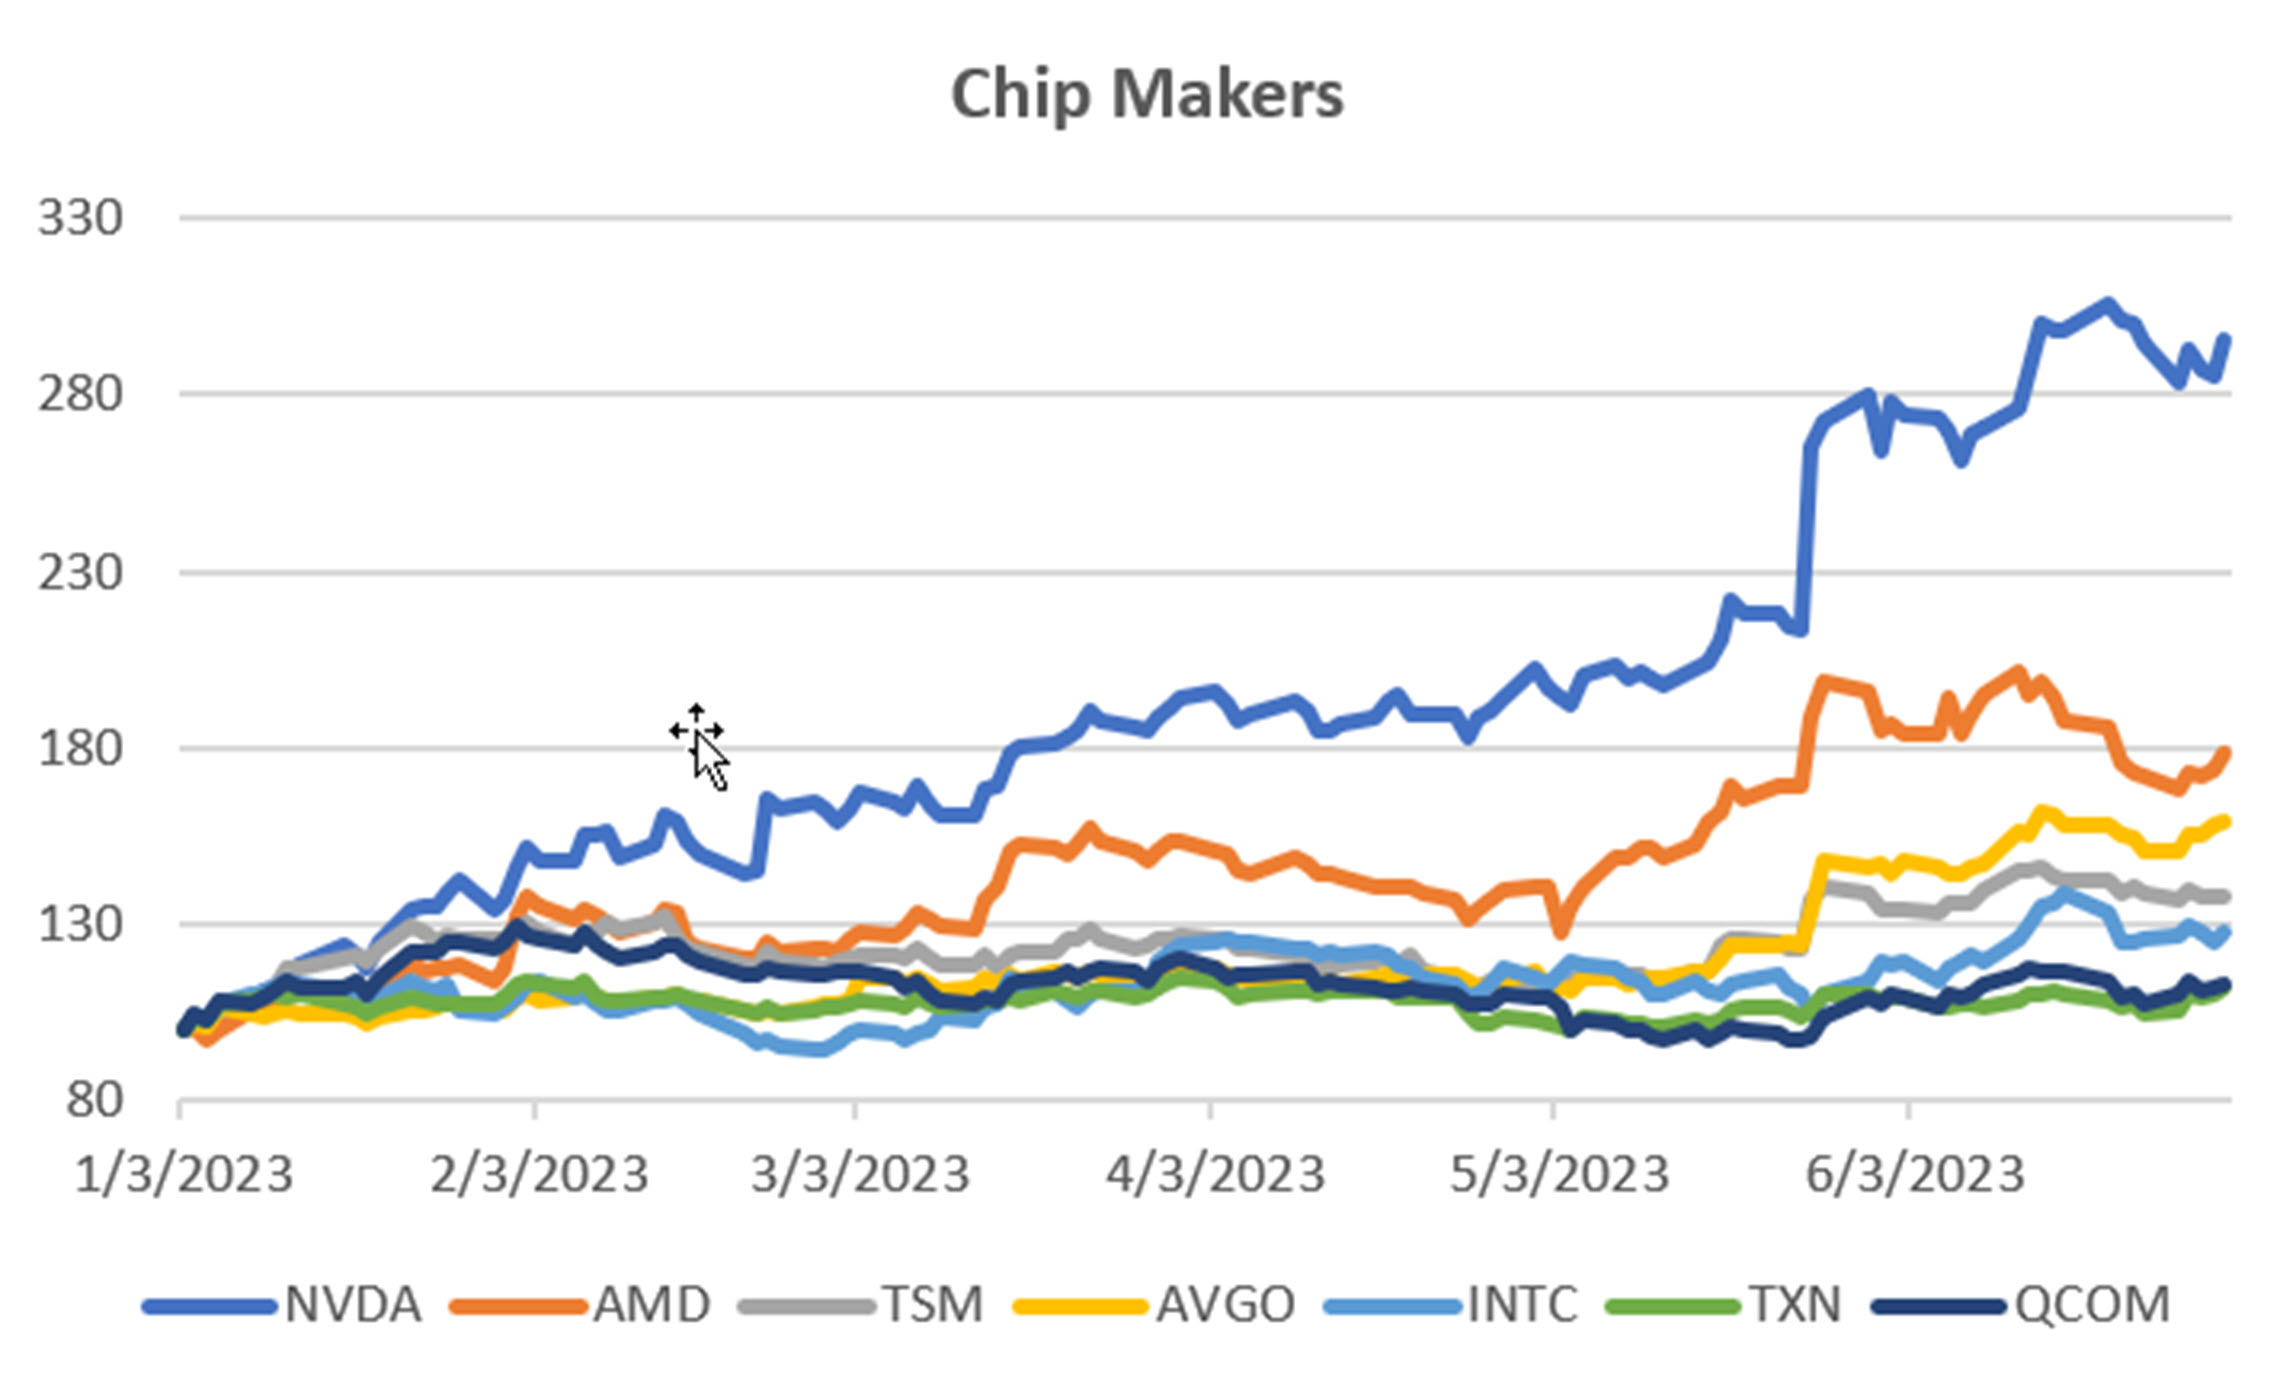
Chart 1. Chip Makers
Chart 2 shows the semiconductor ETFs. While this group contains the stocks in Chart 1, my problem with ETFs is that they include too many stocks, most of which are doing nothing. That dampens the returns and can give a deceiving picture of performance.
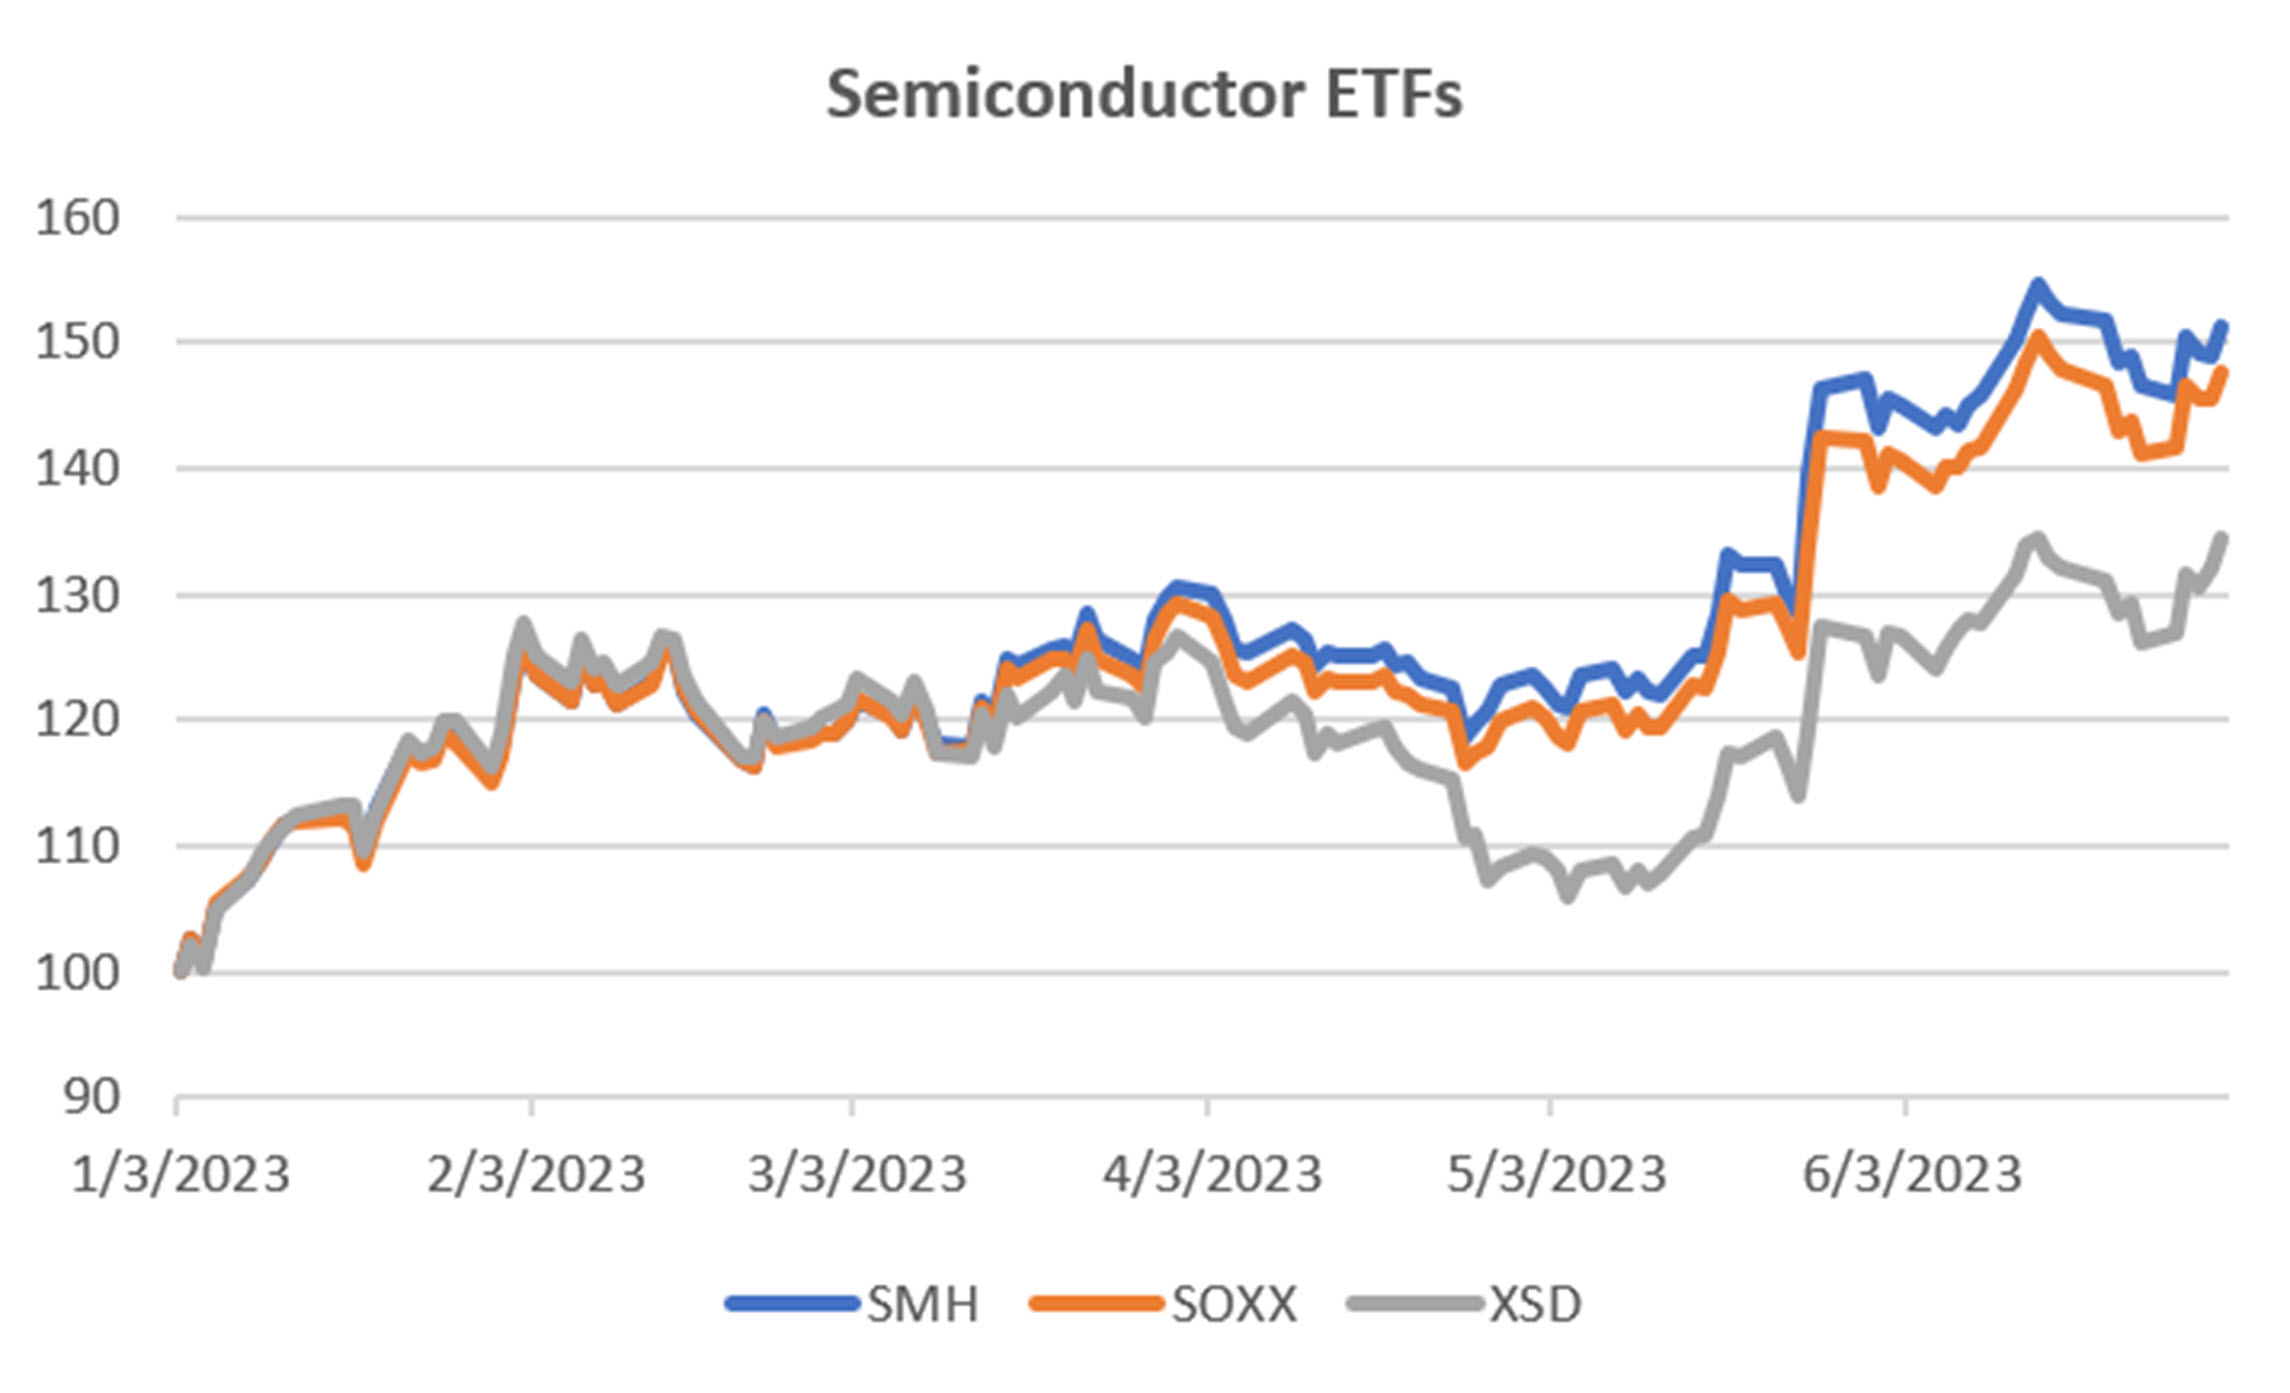
Chart 2. Semiconductor ETFs.
Chart 3 is most interesting. It shows the companies fastest to embrace AI. They are also the largest cap stocks in the S&P. Their performance this year has been remarkably consistent and show a burst of gains last month when they announced using AI.
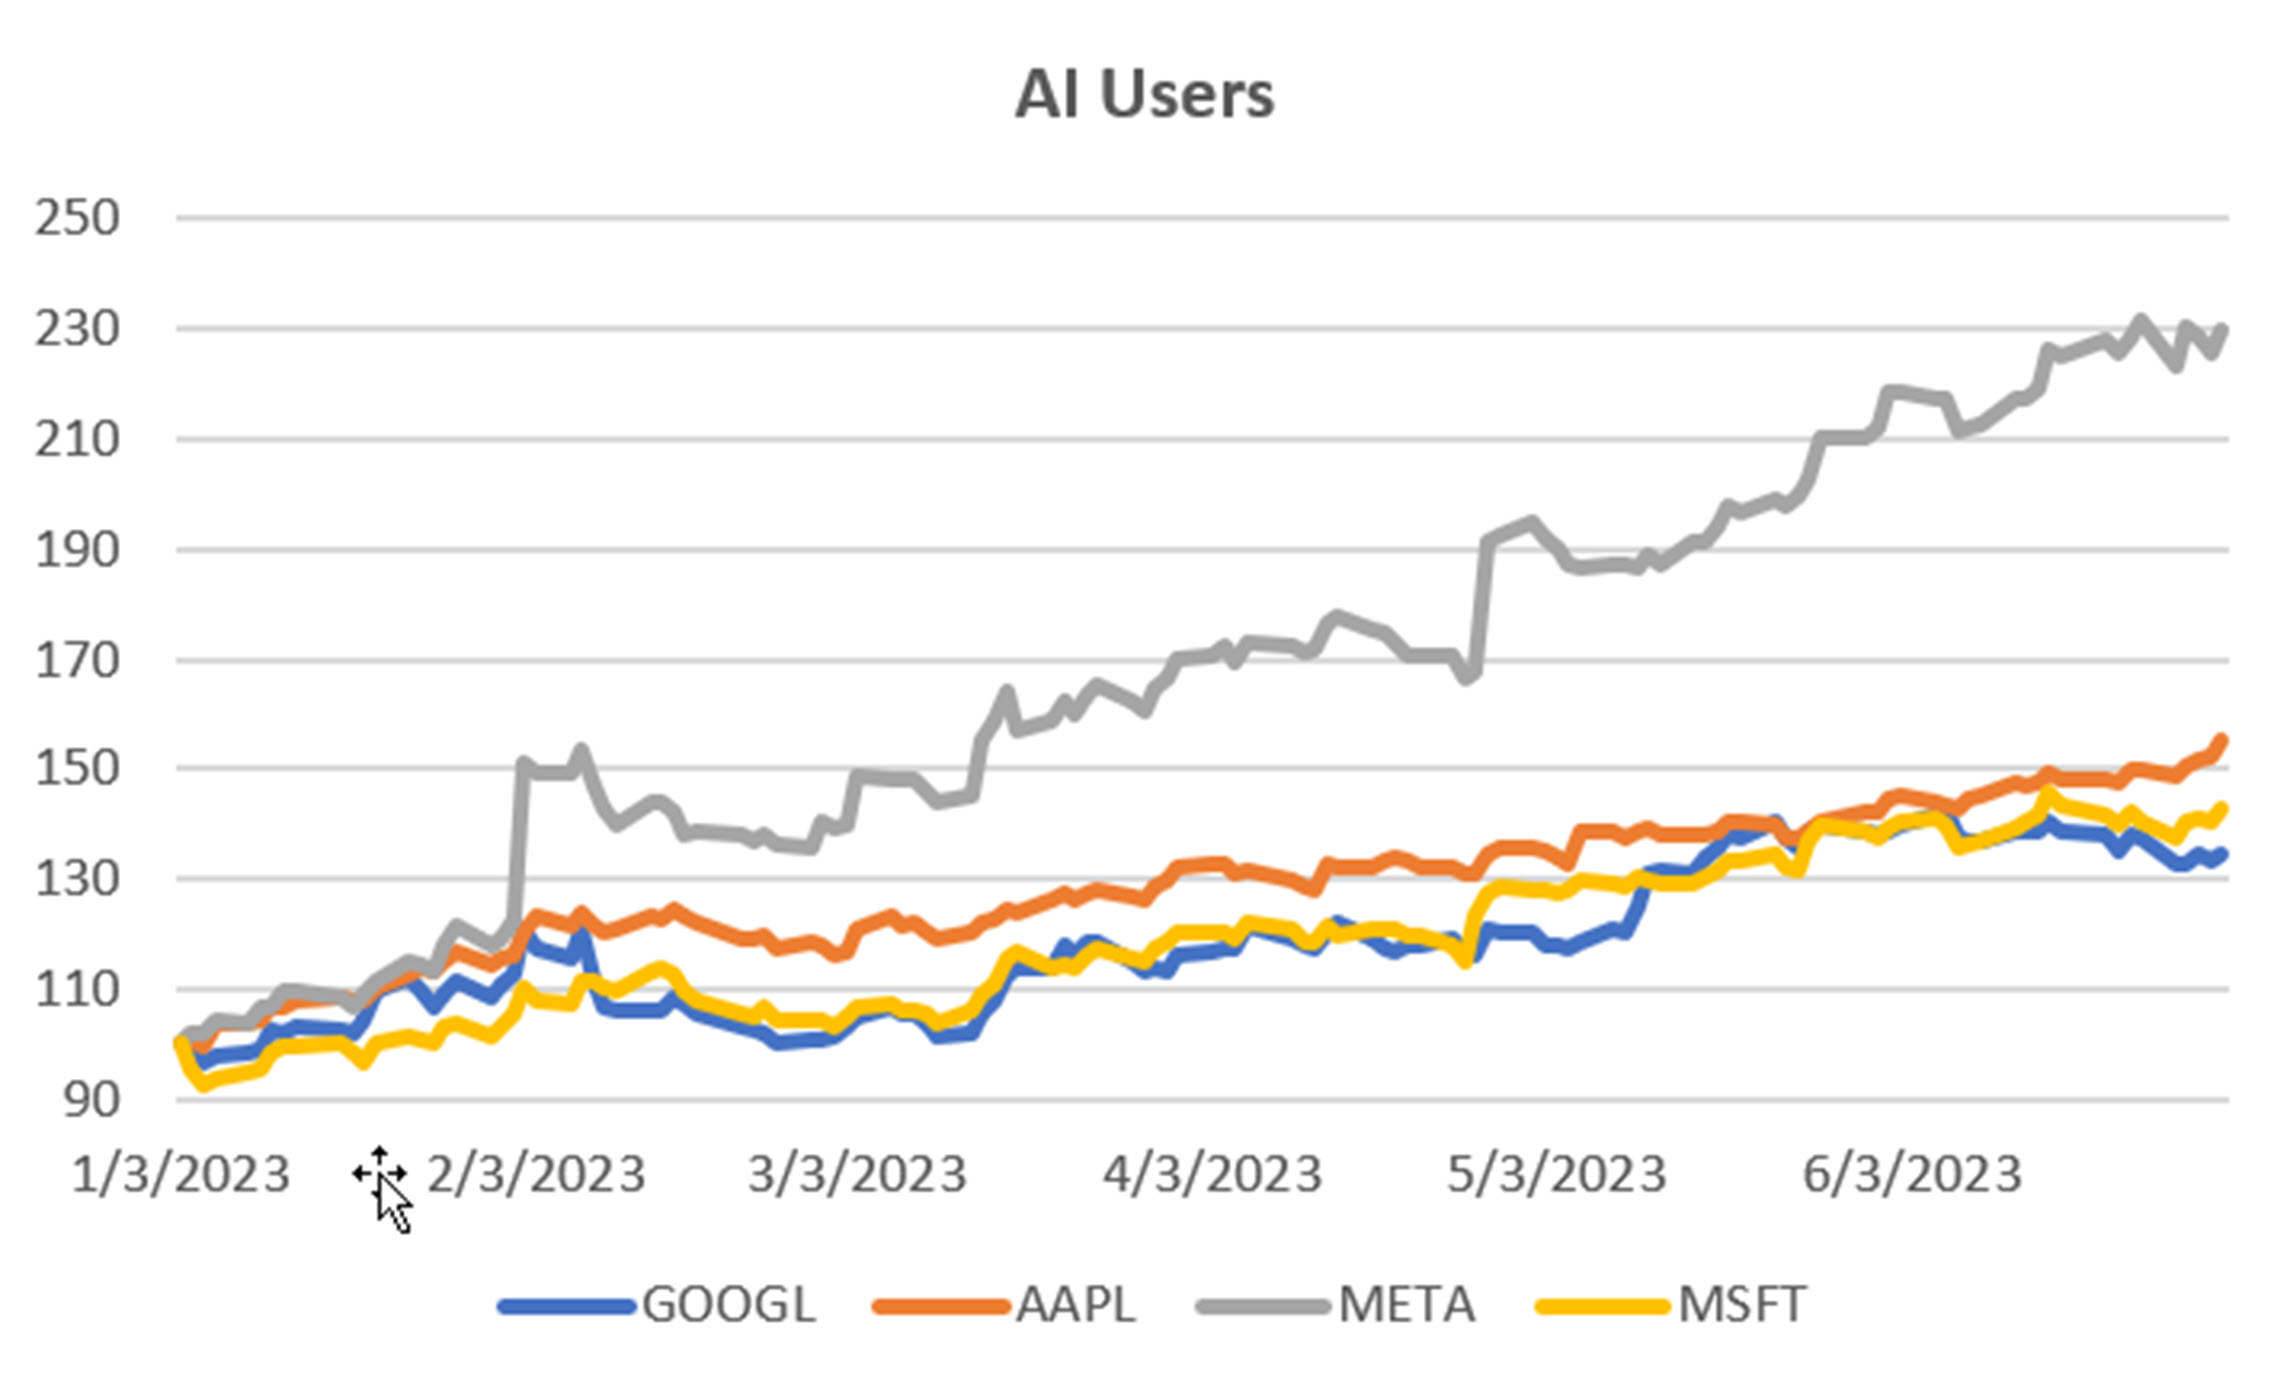
Chart 3. Active AI Users.
Chart 4 are the companies that say they will actively incorporate AI, although they have not yet done so. I chose three that are very different, JP Morgan, Starbucks, and Eli Lilly. Of those, Lilly seems to have gotten the most attention.
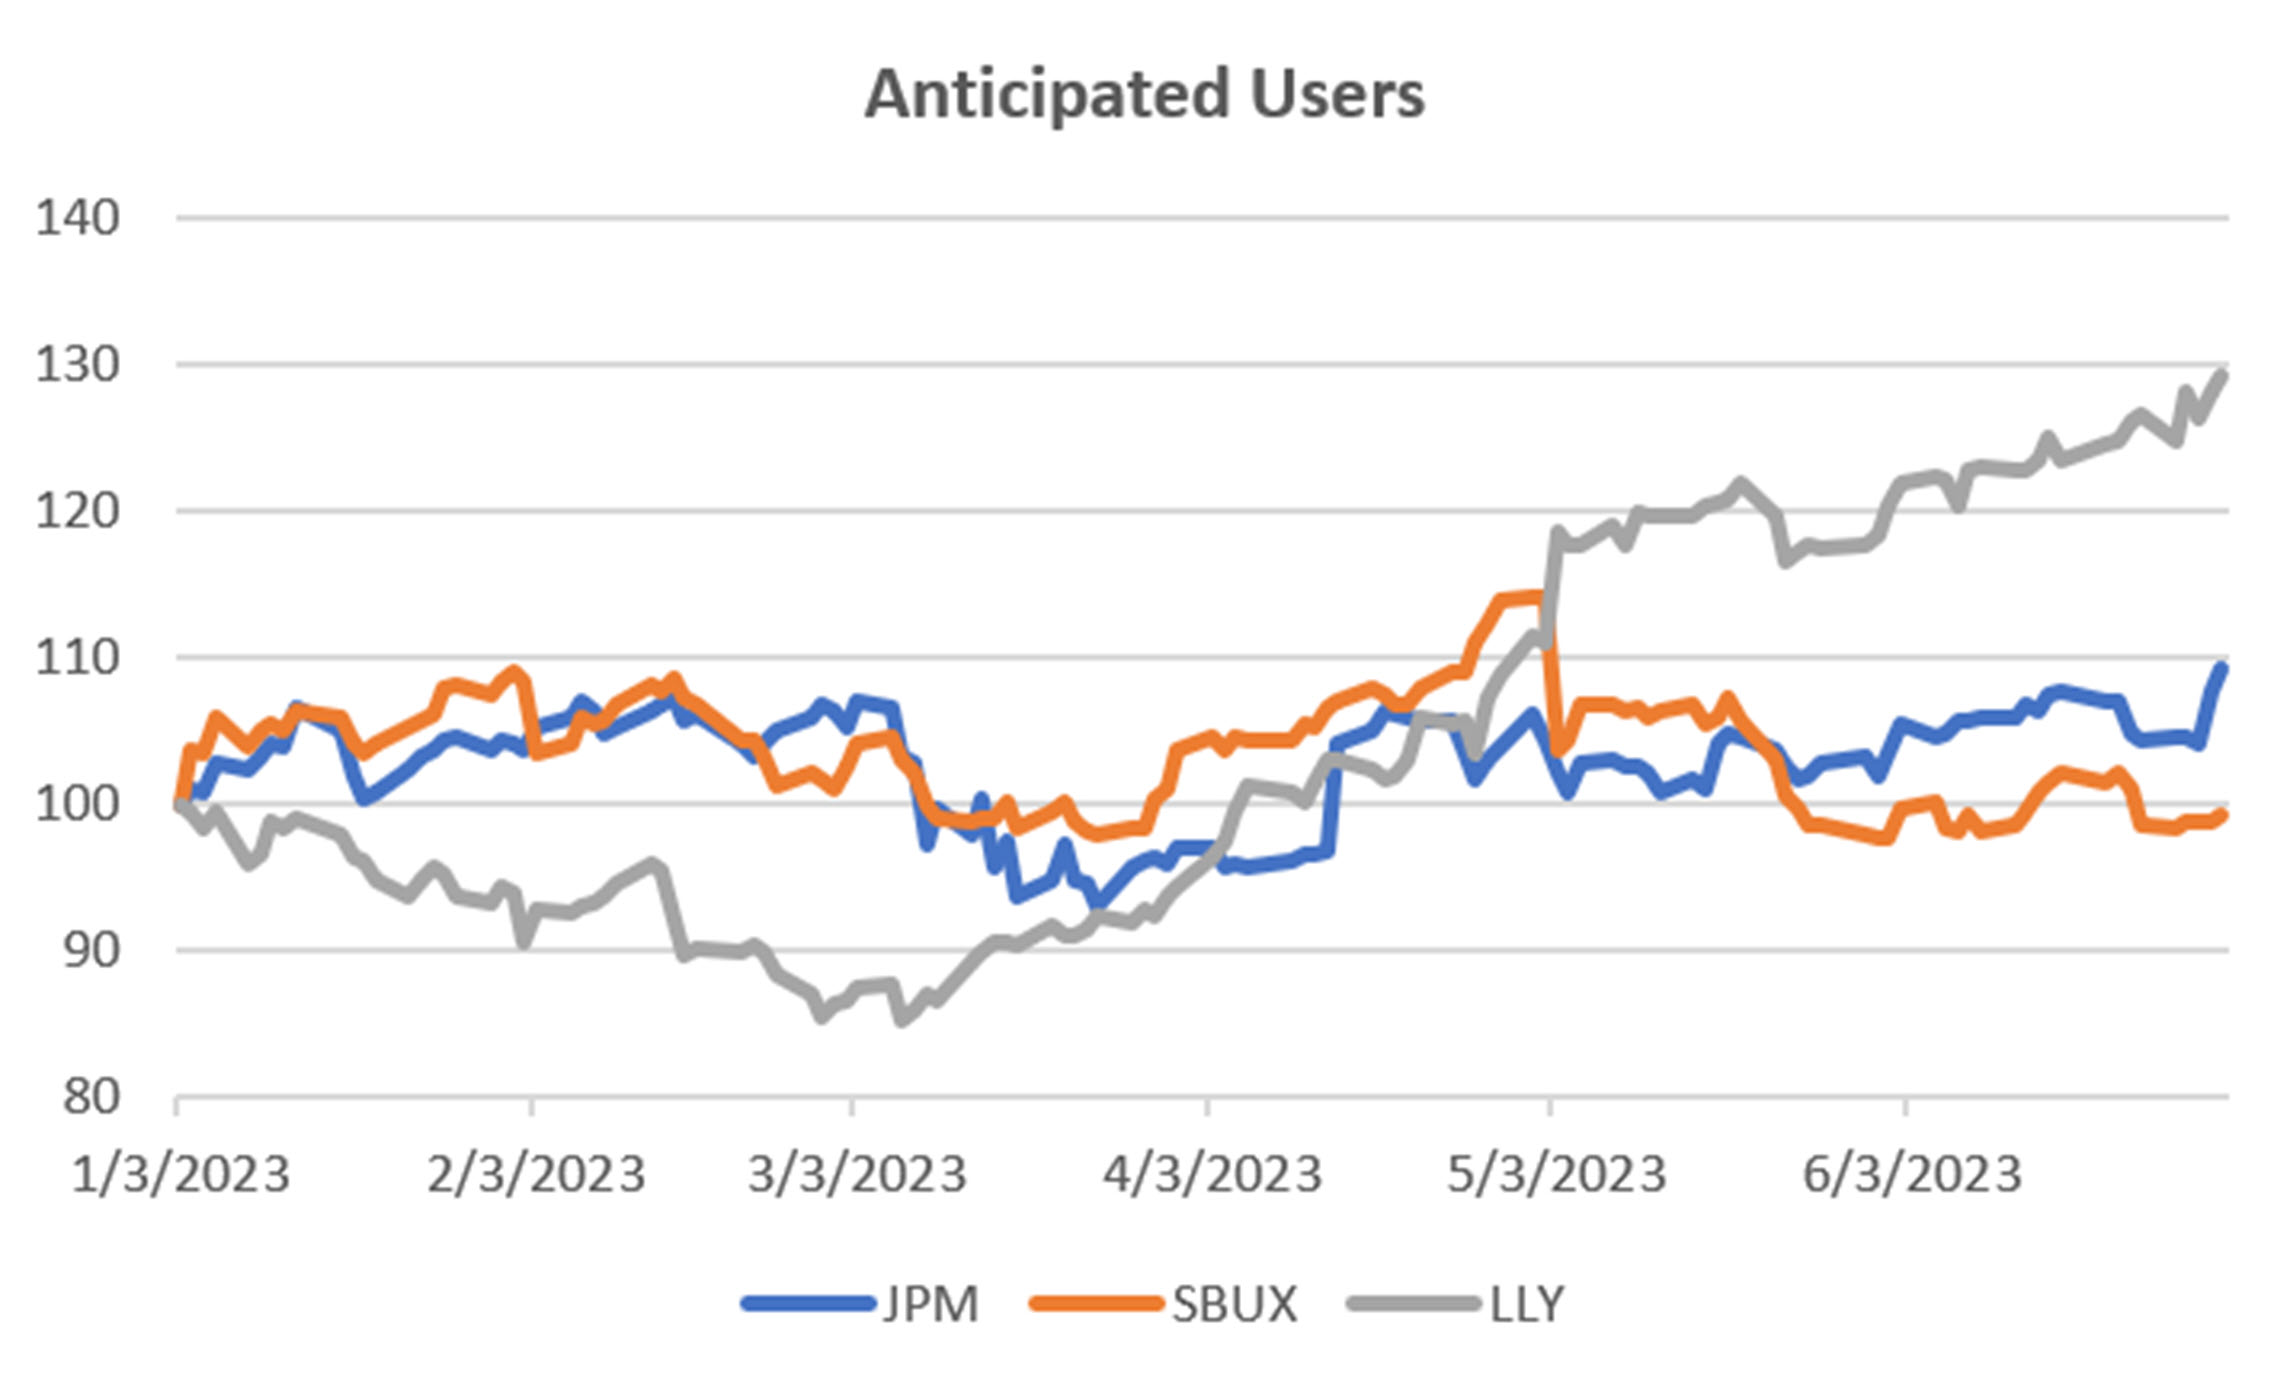
Chart 4. Companies anticipating using AI.
Group Averages
Deciding which groups or individual stocks to trade is not easy. Chart 5 averages the stocks and ETFs in Charts 1-4 to make it easier. We can see that all the groups have benefited from AI publicity, but the AI Users are best with the smoothest returns.
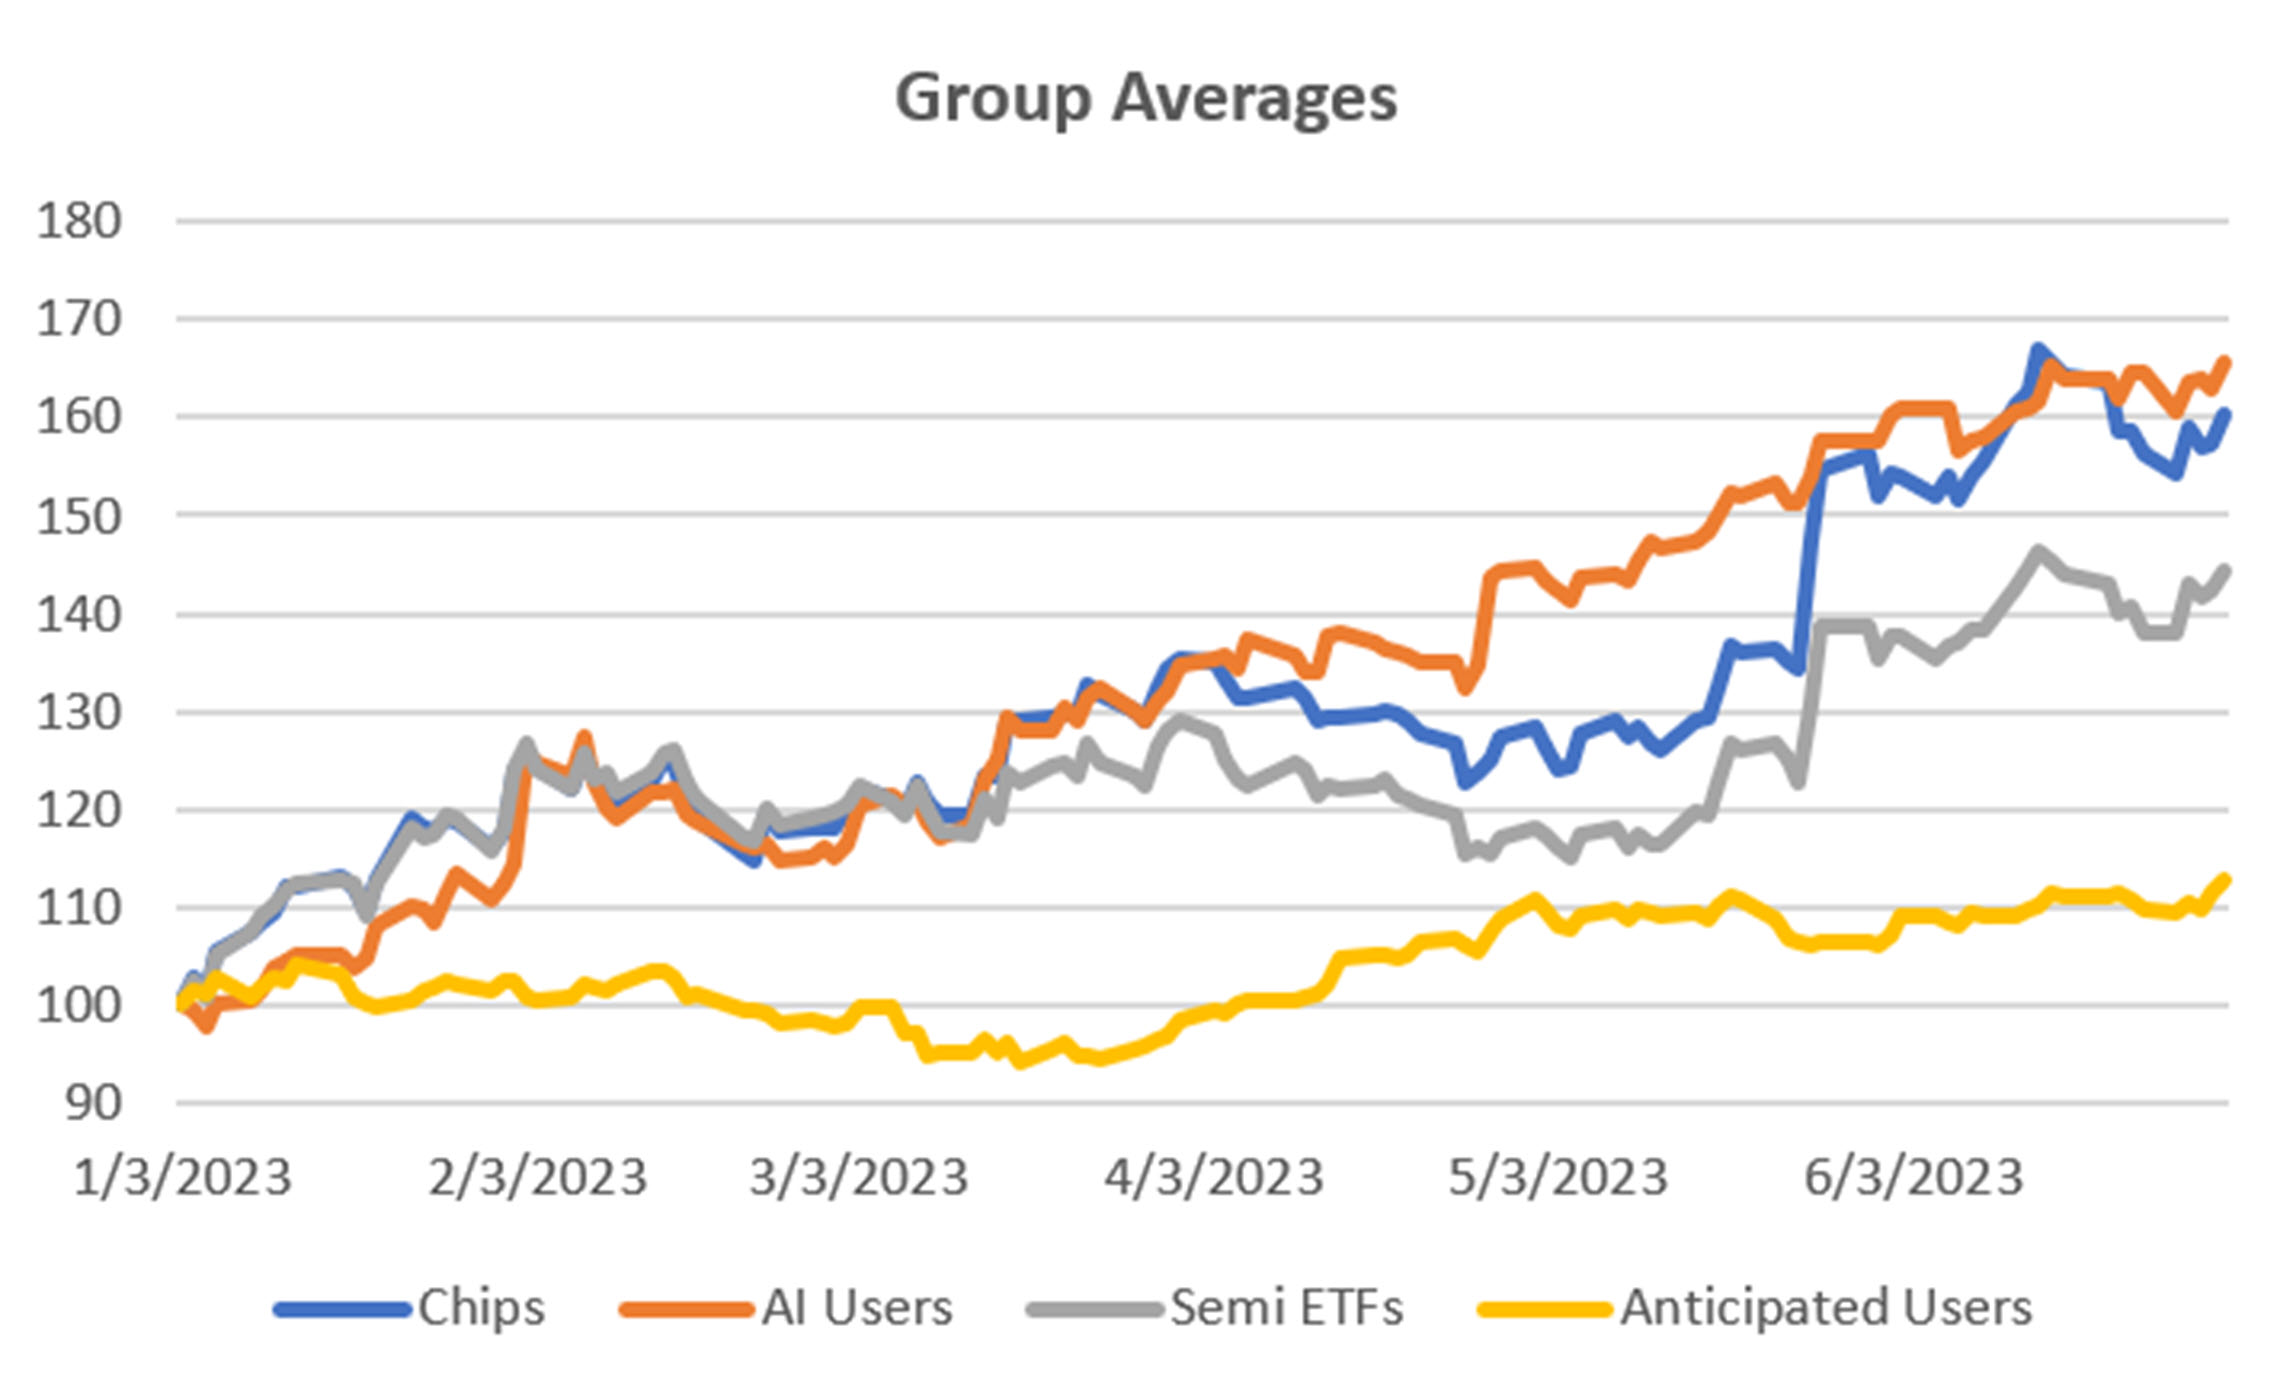
Chart 5. Averages of the four groups.
Trading the AI Price Move
Although I favor long-term trends, this move based on AI has no history. Instead, we want to know a reasonable way to profit without an exceptional amount of risk. The fastest moving average that I would ever use is 20 days. You might want something longer, say 30 or 40 days. The four charts below show the group averages each with a 20-day moving average. The rule that I use is to be long when the average turns up and out when it turns down. I do not enter and exit based on the price crossing the trendline. It’s too noisy and gives too many false signals.
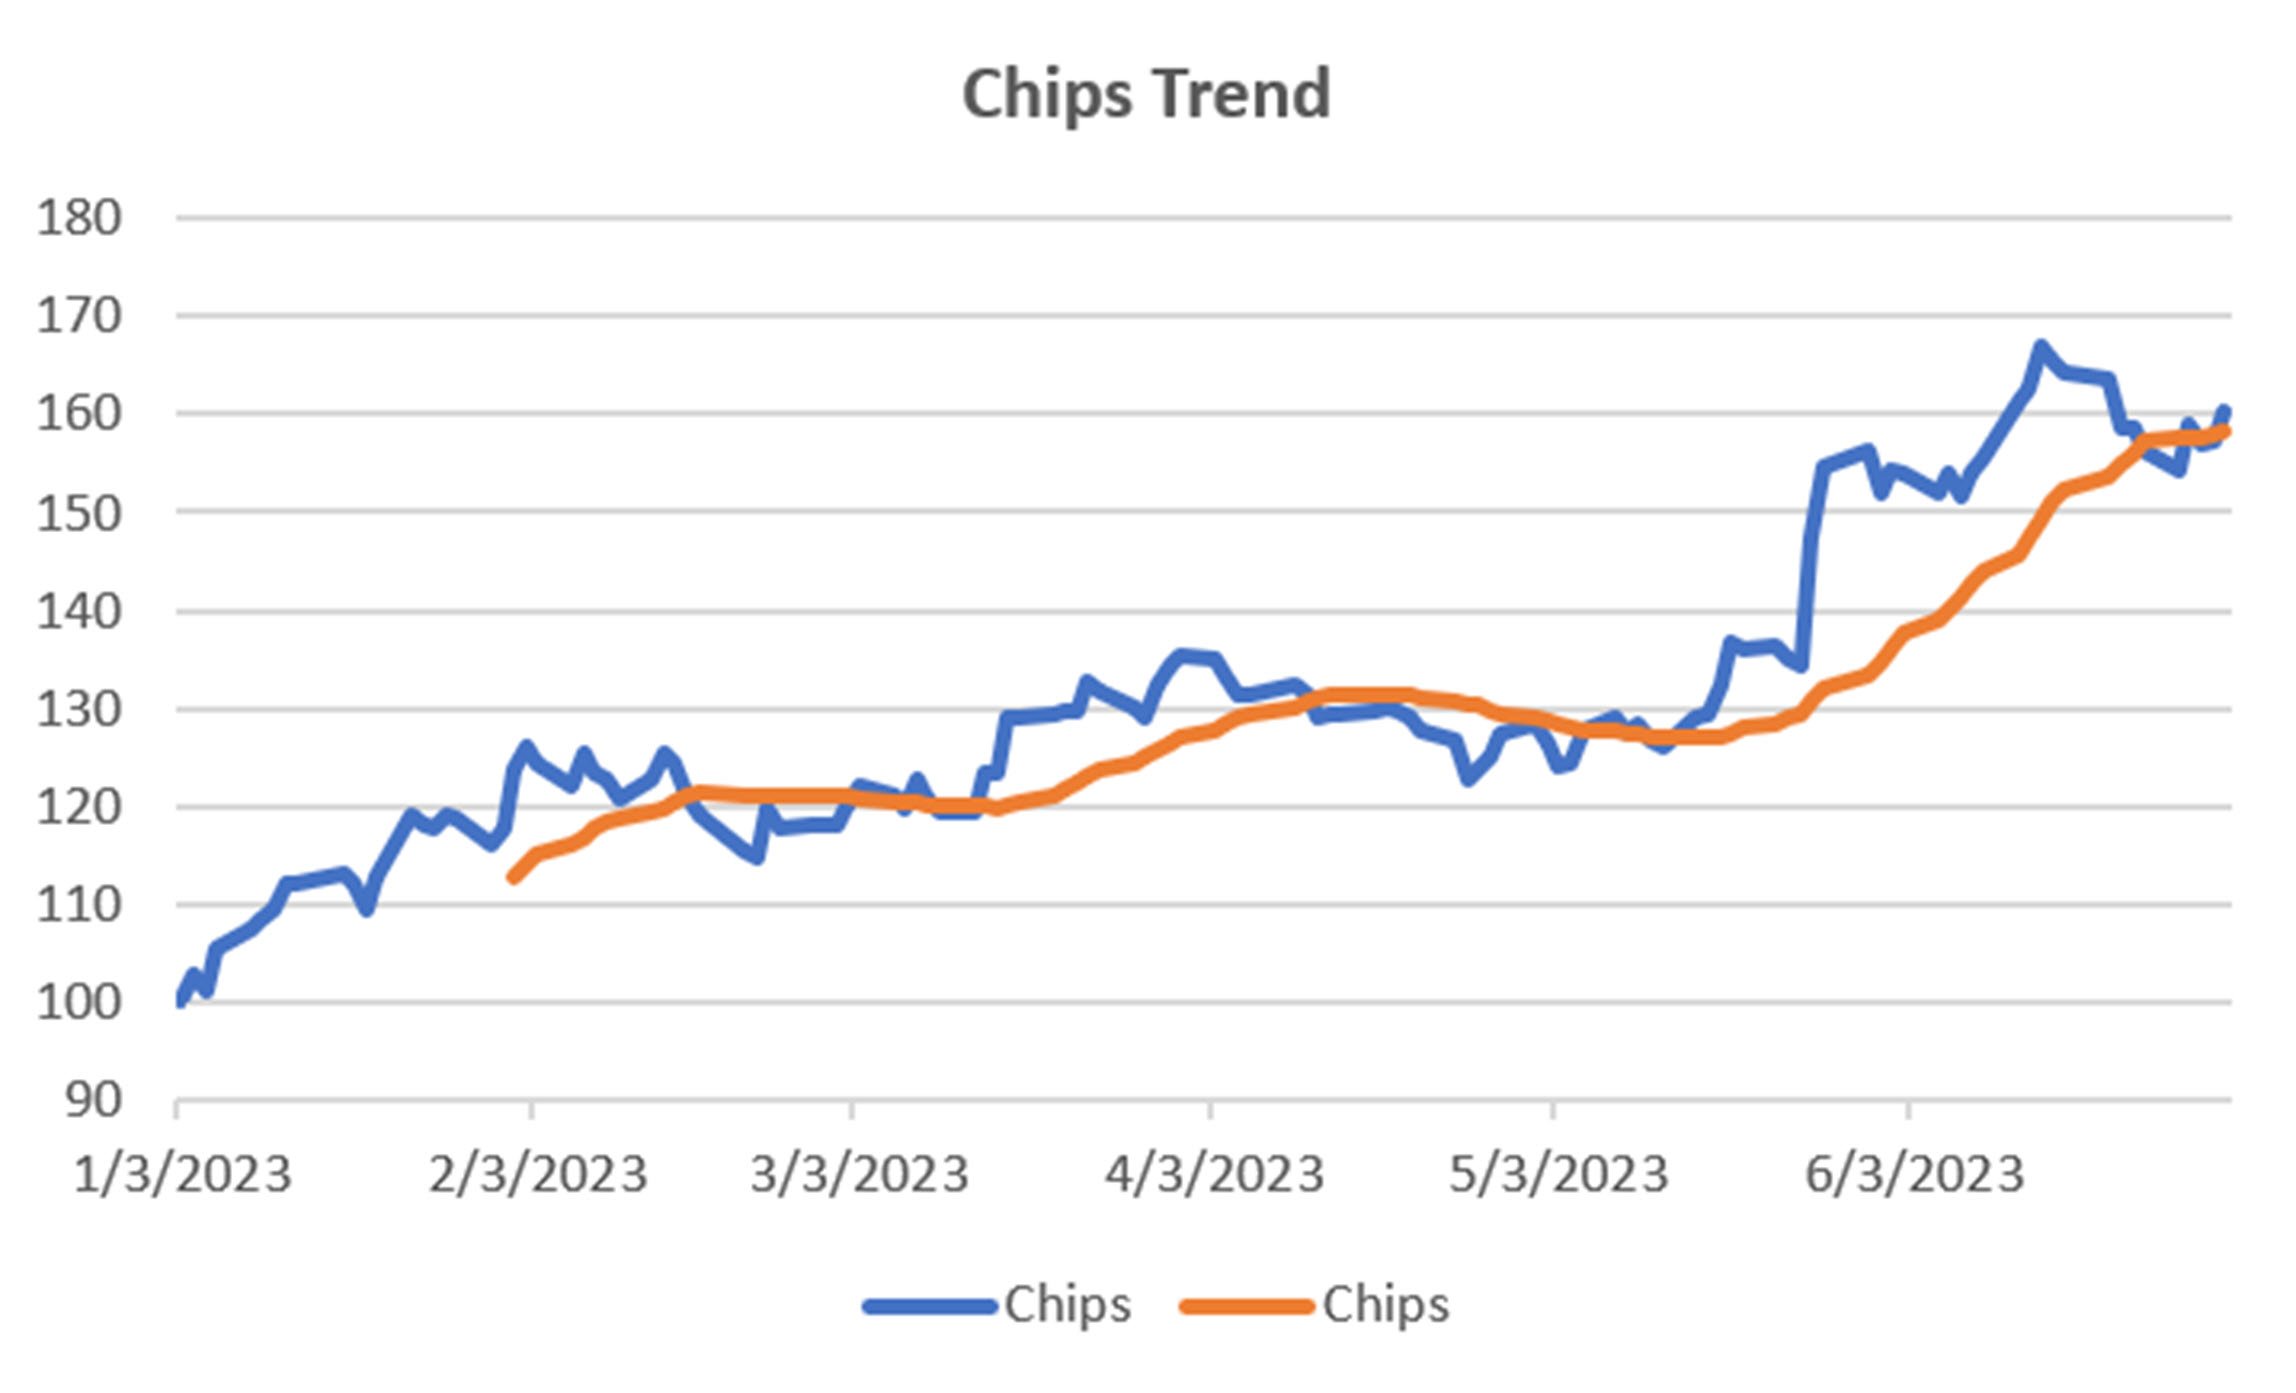
Chart 6. Chip stocks with a 20-day moving average.
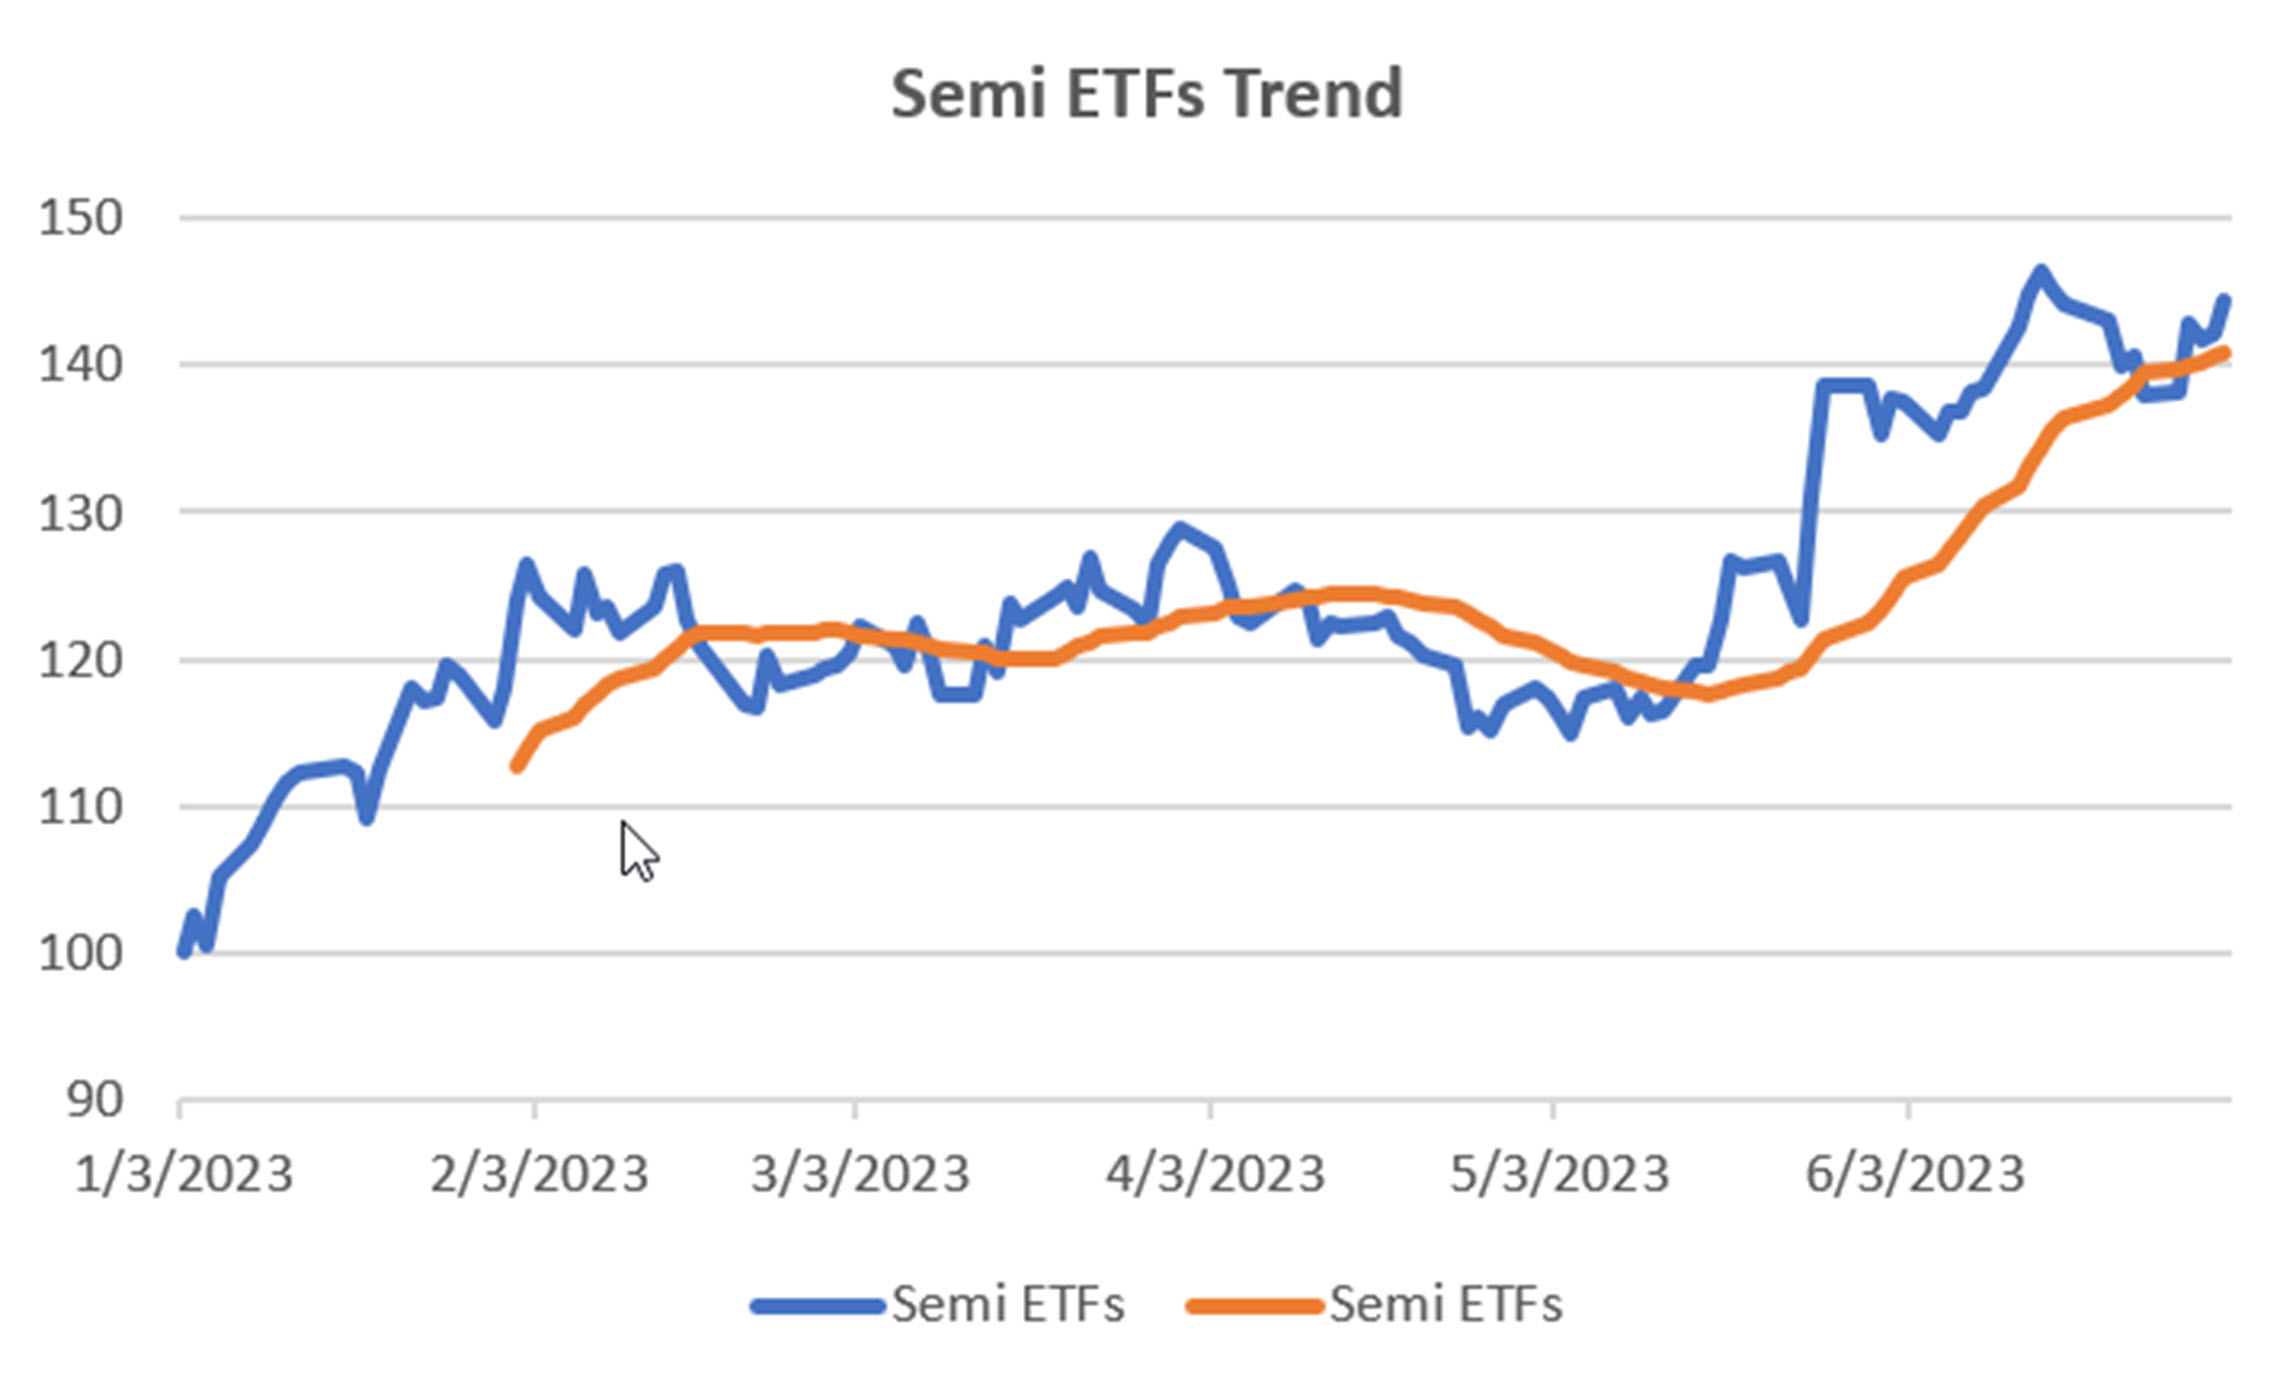
Chart 7. Semiconductor ETFs with a 20-day moving average.
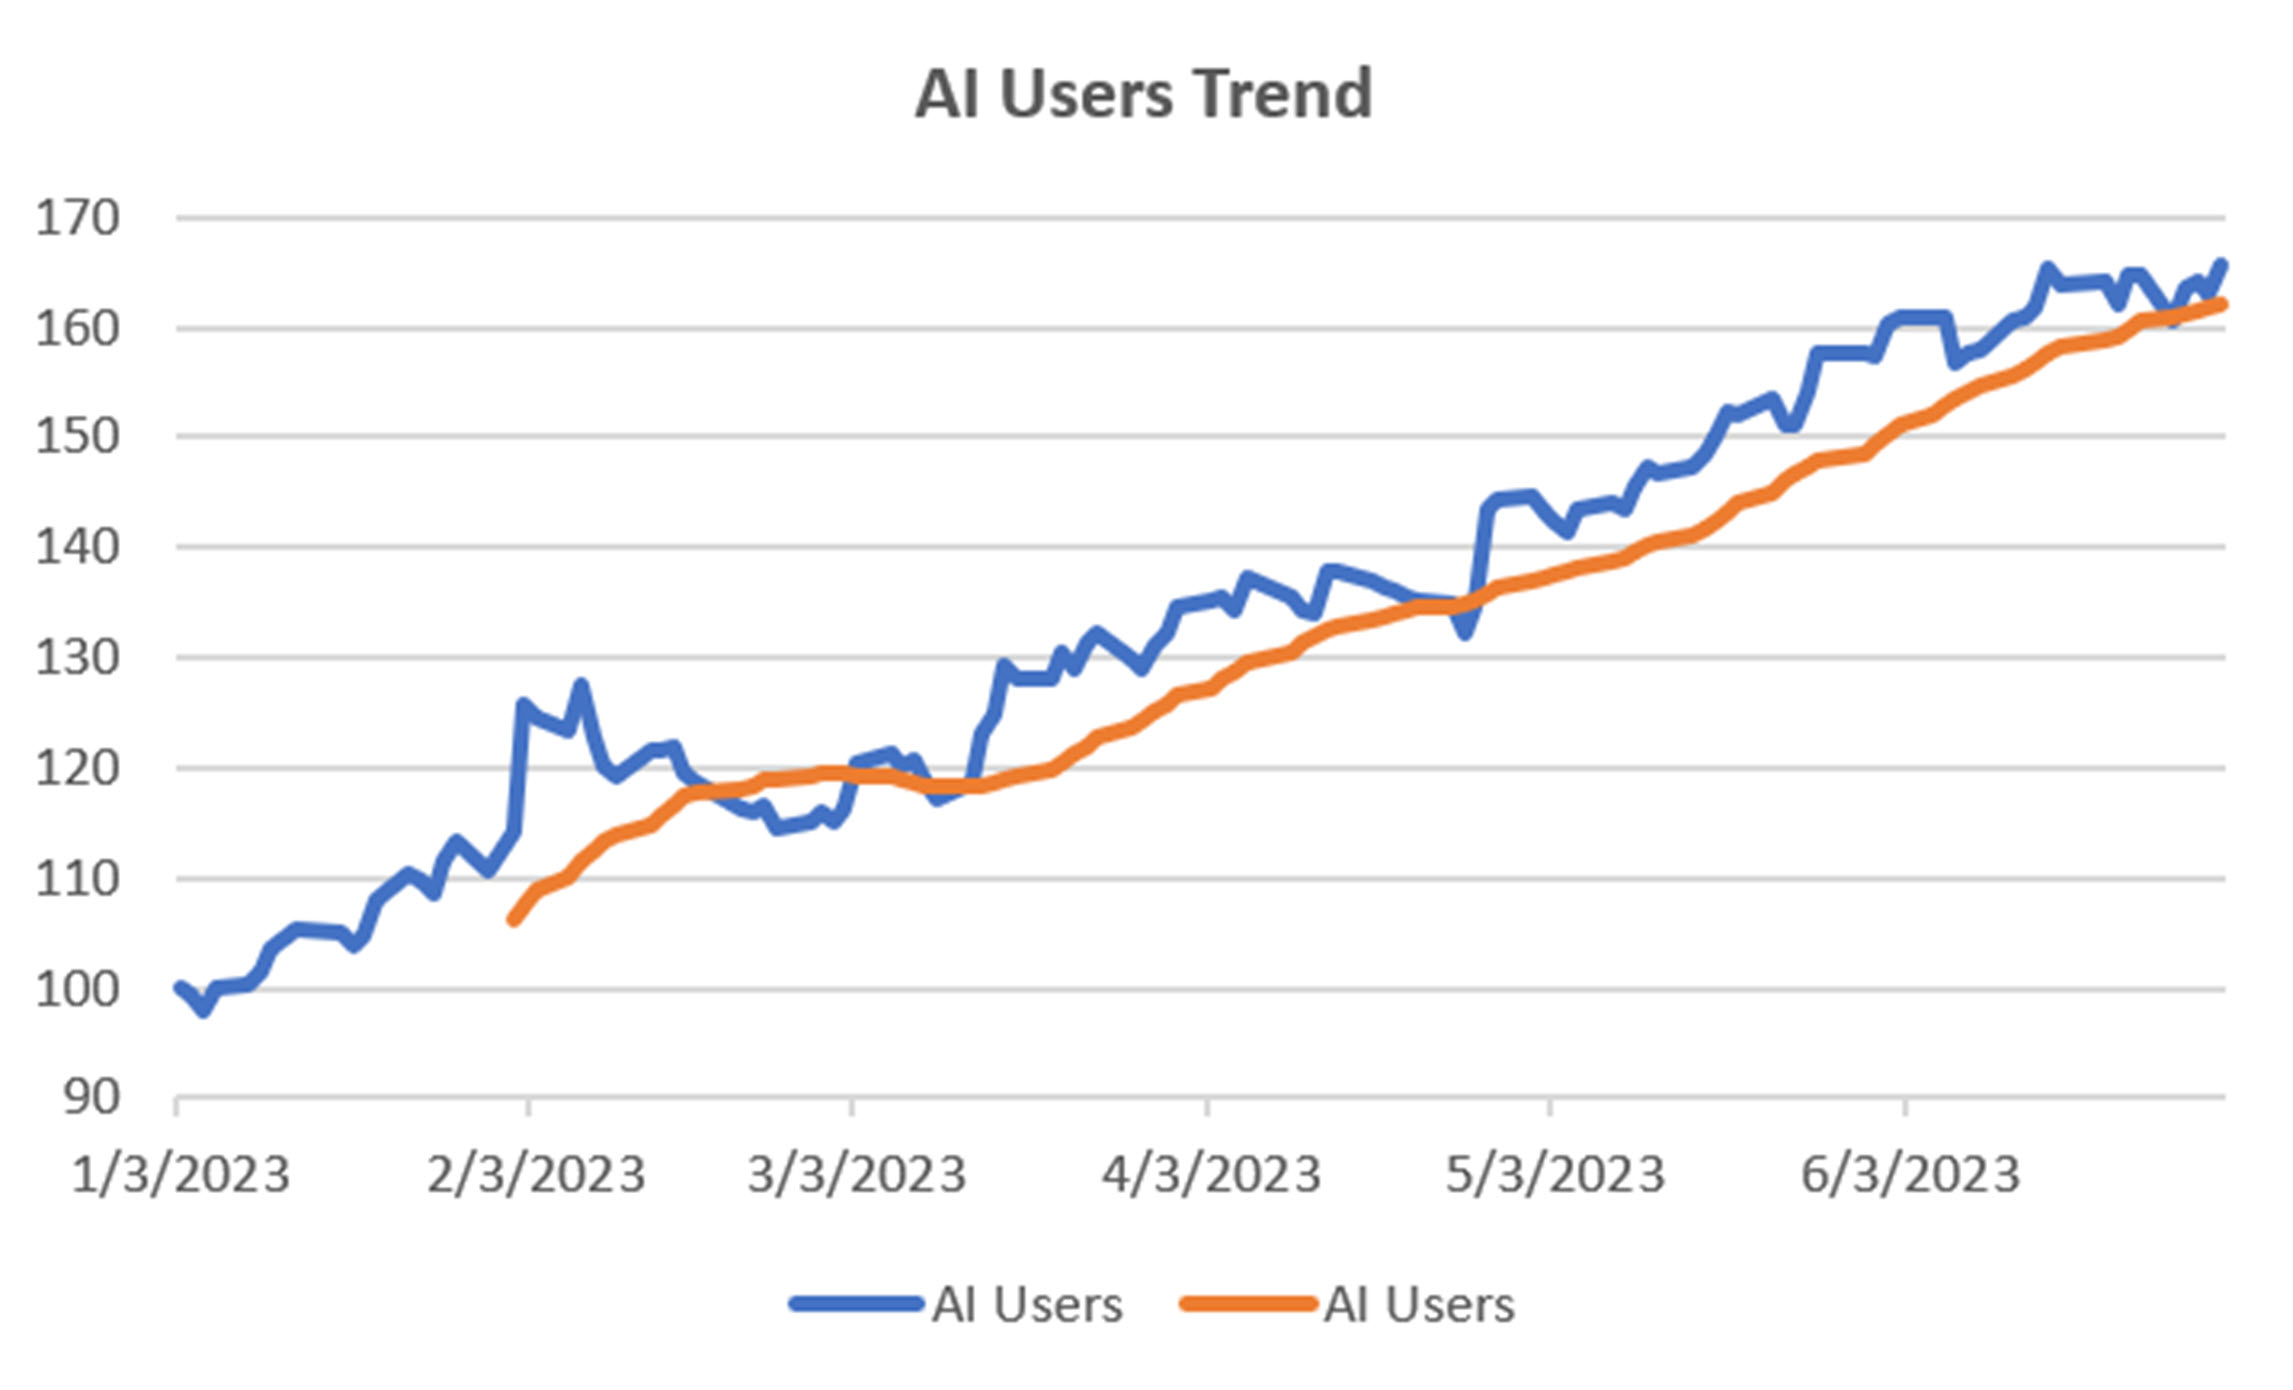
Chart 8. AI Users with a 20-day moving average.
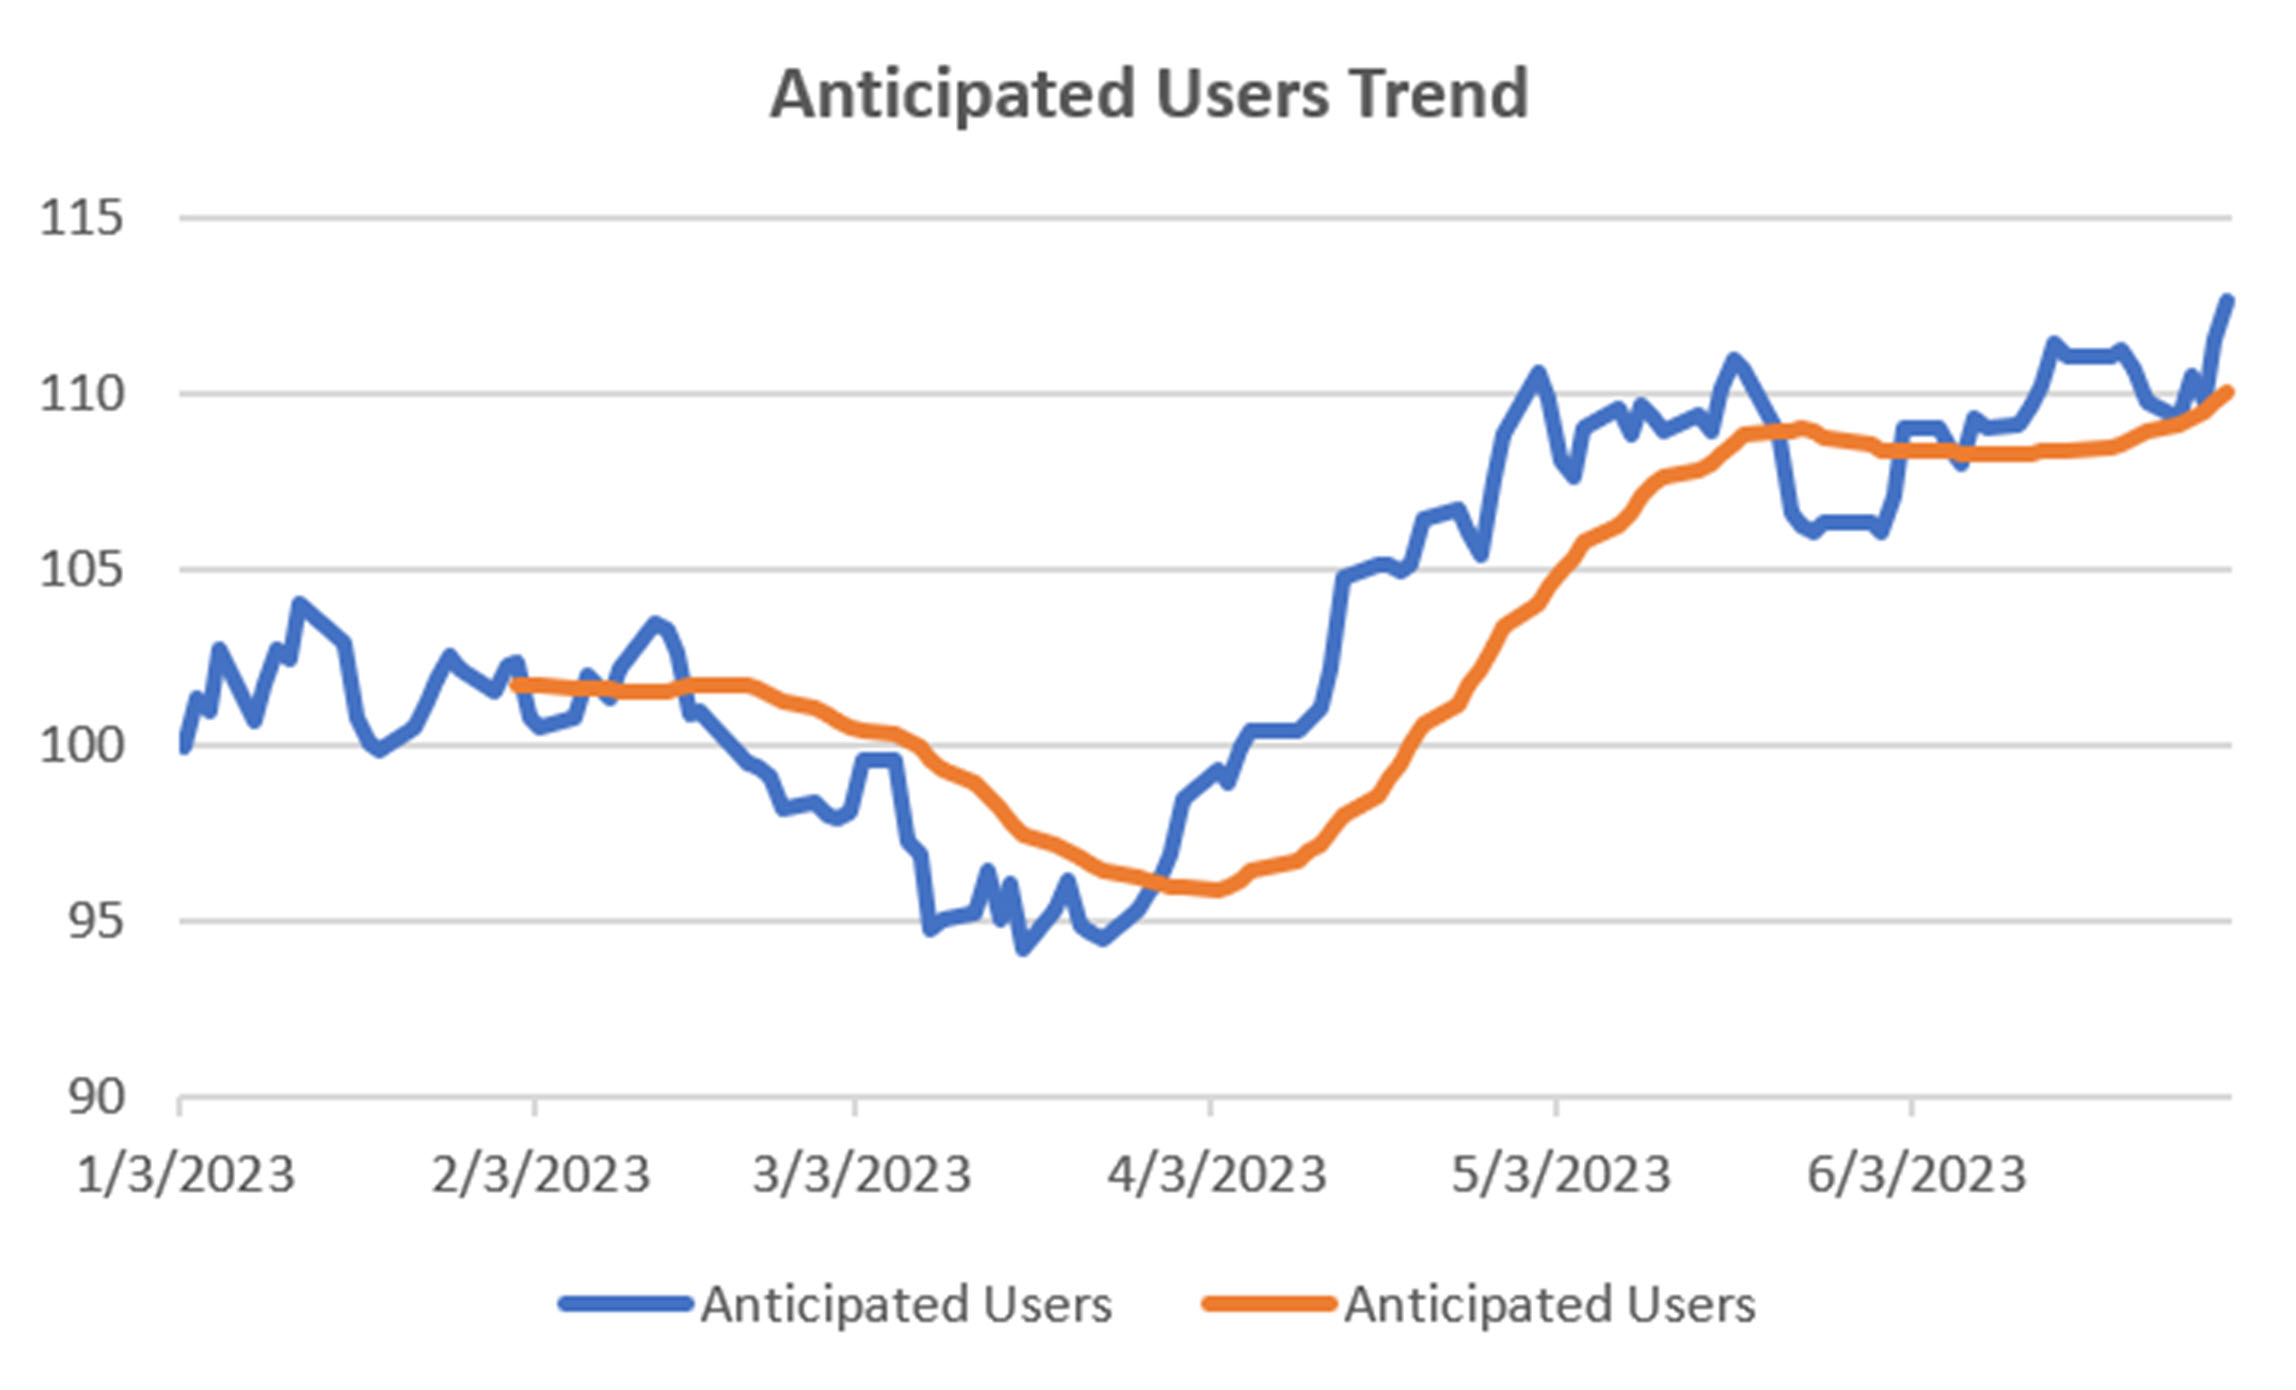
Chart 9. Anticipated Users with a 20-day moving average.
Conclusion
While the conclusion is obvious, it is necessary to go through the steps to get there. The beneficiaries of AI are the big internet users. Returns have been smooth and the 20-day trend is strong. There is some indication that prices are stabilizing, so a slower trendline might be a better choice if you are willing to take a bit more risk in exchange for holding the position. At the moment, it seems to be the right choice.
A Standing Note on Short Sales
Note that the “All Signals” reports show short sales in stocks and ETFs, even though short positions are not executed in the equity portfolios. Our work over the years shows that downturns in the stock market are most often short-lived and it is difficult to capture with a longer-term trend. The upwards bias also works against shorter-term systems unless using futures, which allows leverage. Our decision has been to take only long positions in equities and control the risk by exiting many of the portfolios when there is extreme volatility and/or an indication of a severe downturn.
PORTFOLIO METHODOLOGY IN BRIEF
Both equity and futures programs use the same basic portfolio technology. They all exploit the persistence of performance, that is, they seek those markets with good long-term and short-term returns on the specific system, rank them, then choose the best, subject to liquidity, an existing current signal, with limitations on how many can be chosen from each sector. If there are not enough stocks or futures markets that satisfy all the conditions, then the portfolio holds fewer assets. In general, these portfolios are high beta, showing higher returns and higher risk, but have had a history of consistently outperforming the broad market index in all traditional measures.
PERFORMANCE BY GROUP
NOTE that the charts show below represent performance “tracking,” that is, the oldest results since are simulated but the returns from 2013 are the systematic daily performance added day by day. Any changes to the strategies do not affect the past performance, unless noted. The system assumes 100% investment and stocks are executed on the open, futures on the close of the trading day following the signals. From time to time we make logic changes to the strategies and show how the new model performs.
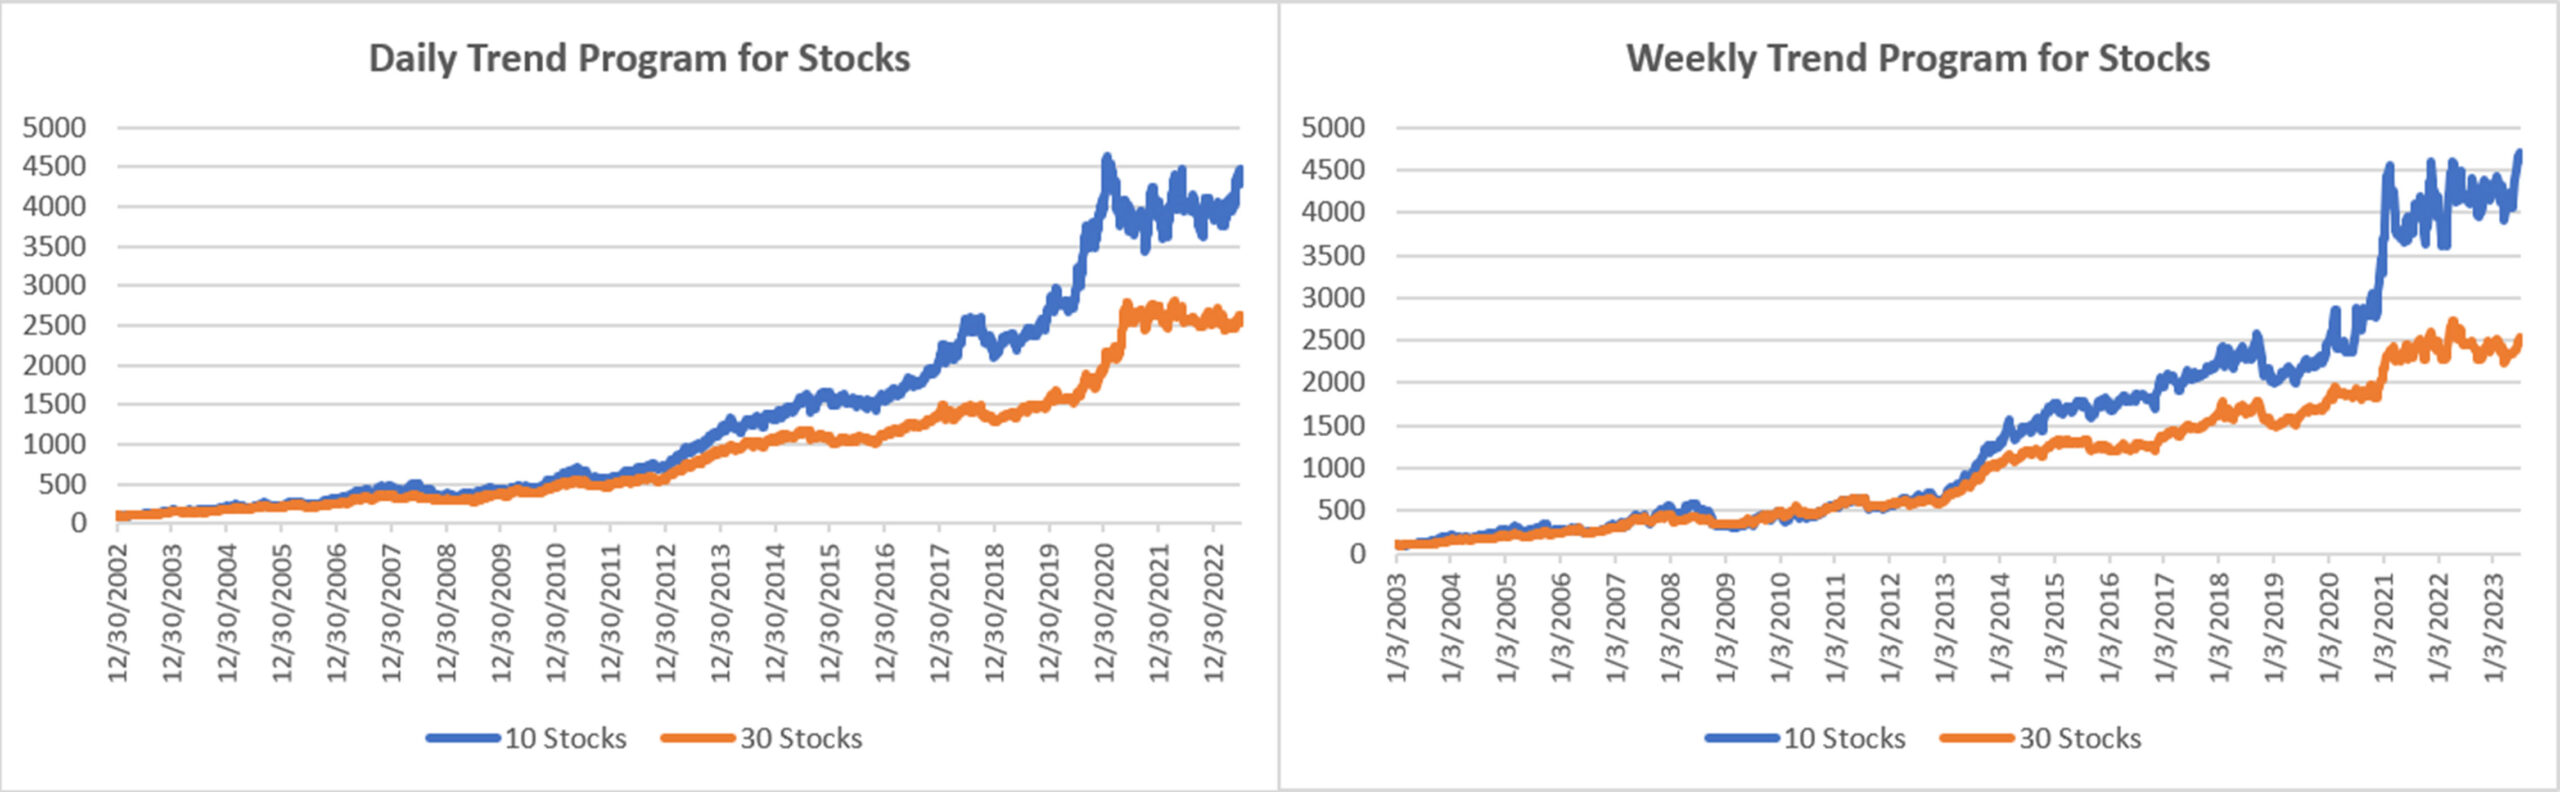
Groups DE1 and WE1: Daily and Weekly Trend Program for Stocks, including Income Focus, and DowHedge, and the new Sector Rotation
The Trend program seeks long-term directional changes in markets and the portfolios choose stocks that have realized profitable performance over many years combined with good short-term returns. It will hold fewer stocks when they do not meet our condition and exit the entire portfolio when there is extreme risk or a significant downturn.
A good month for the Equity Trend Program, both daily and weekly portfolios, now up by 11% and 13% for the year. The Weekly program moved to new all-time highs having more recently edged higher than that daily program while stocks wavered back and forth. In both cases, the smaller 10-stock portfolios are doing better.
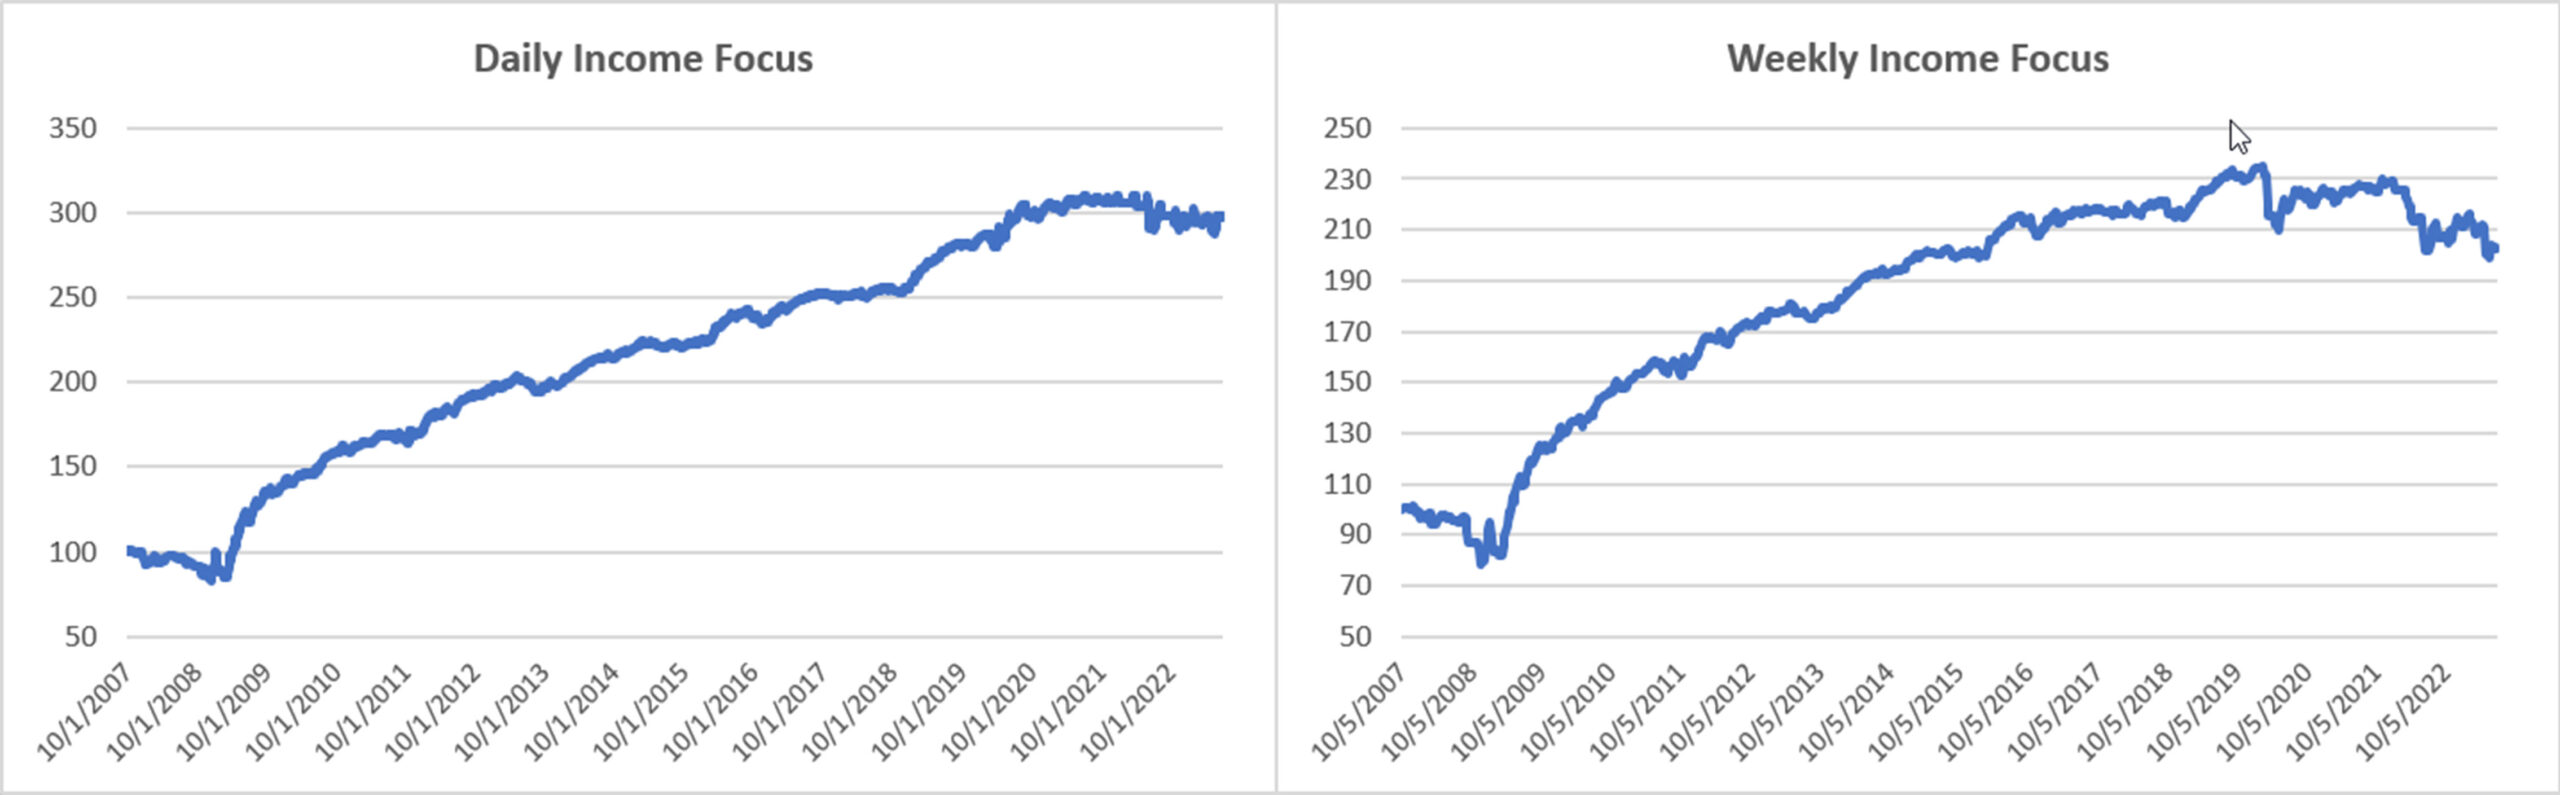
Income Focus and Sector Rotation
Gains in both the Daily and Weekly Income Focus programs may indicate the end of the Fed tightening. The Daily portfolio went positive for the year, but the Weekly has yet to catch up. We expect that will be no problem once the market decides that interest rates have stabilized. The income at the current interest rate could make the recovery fast.
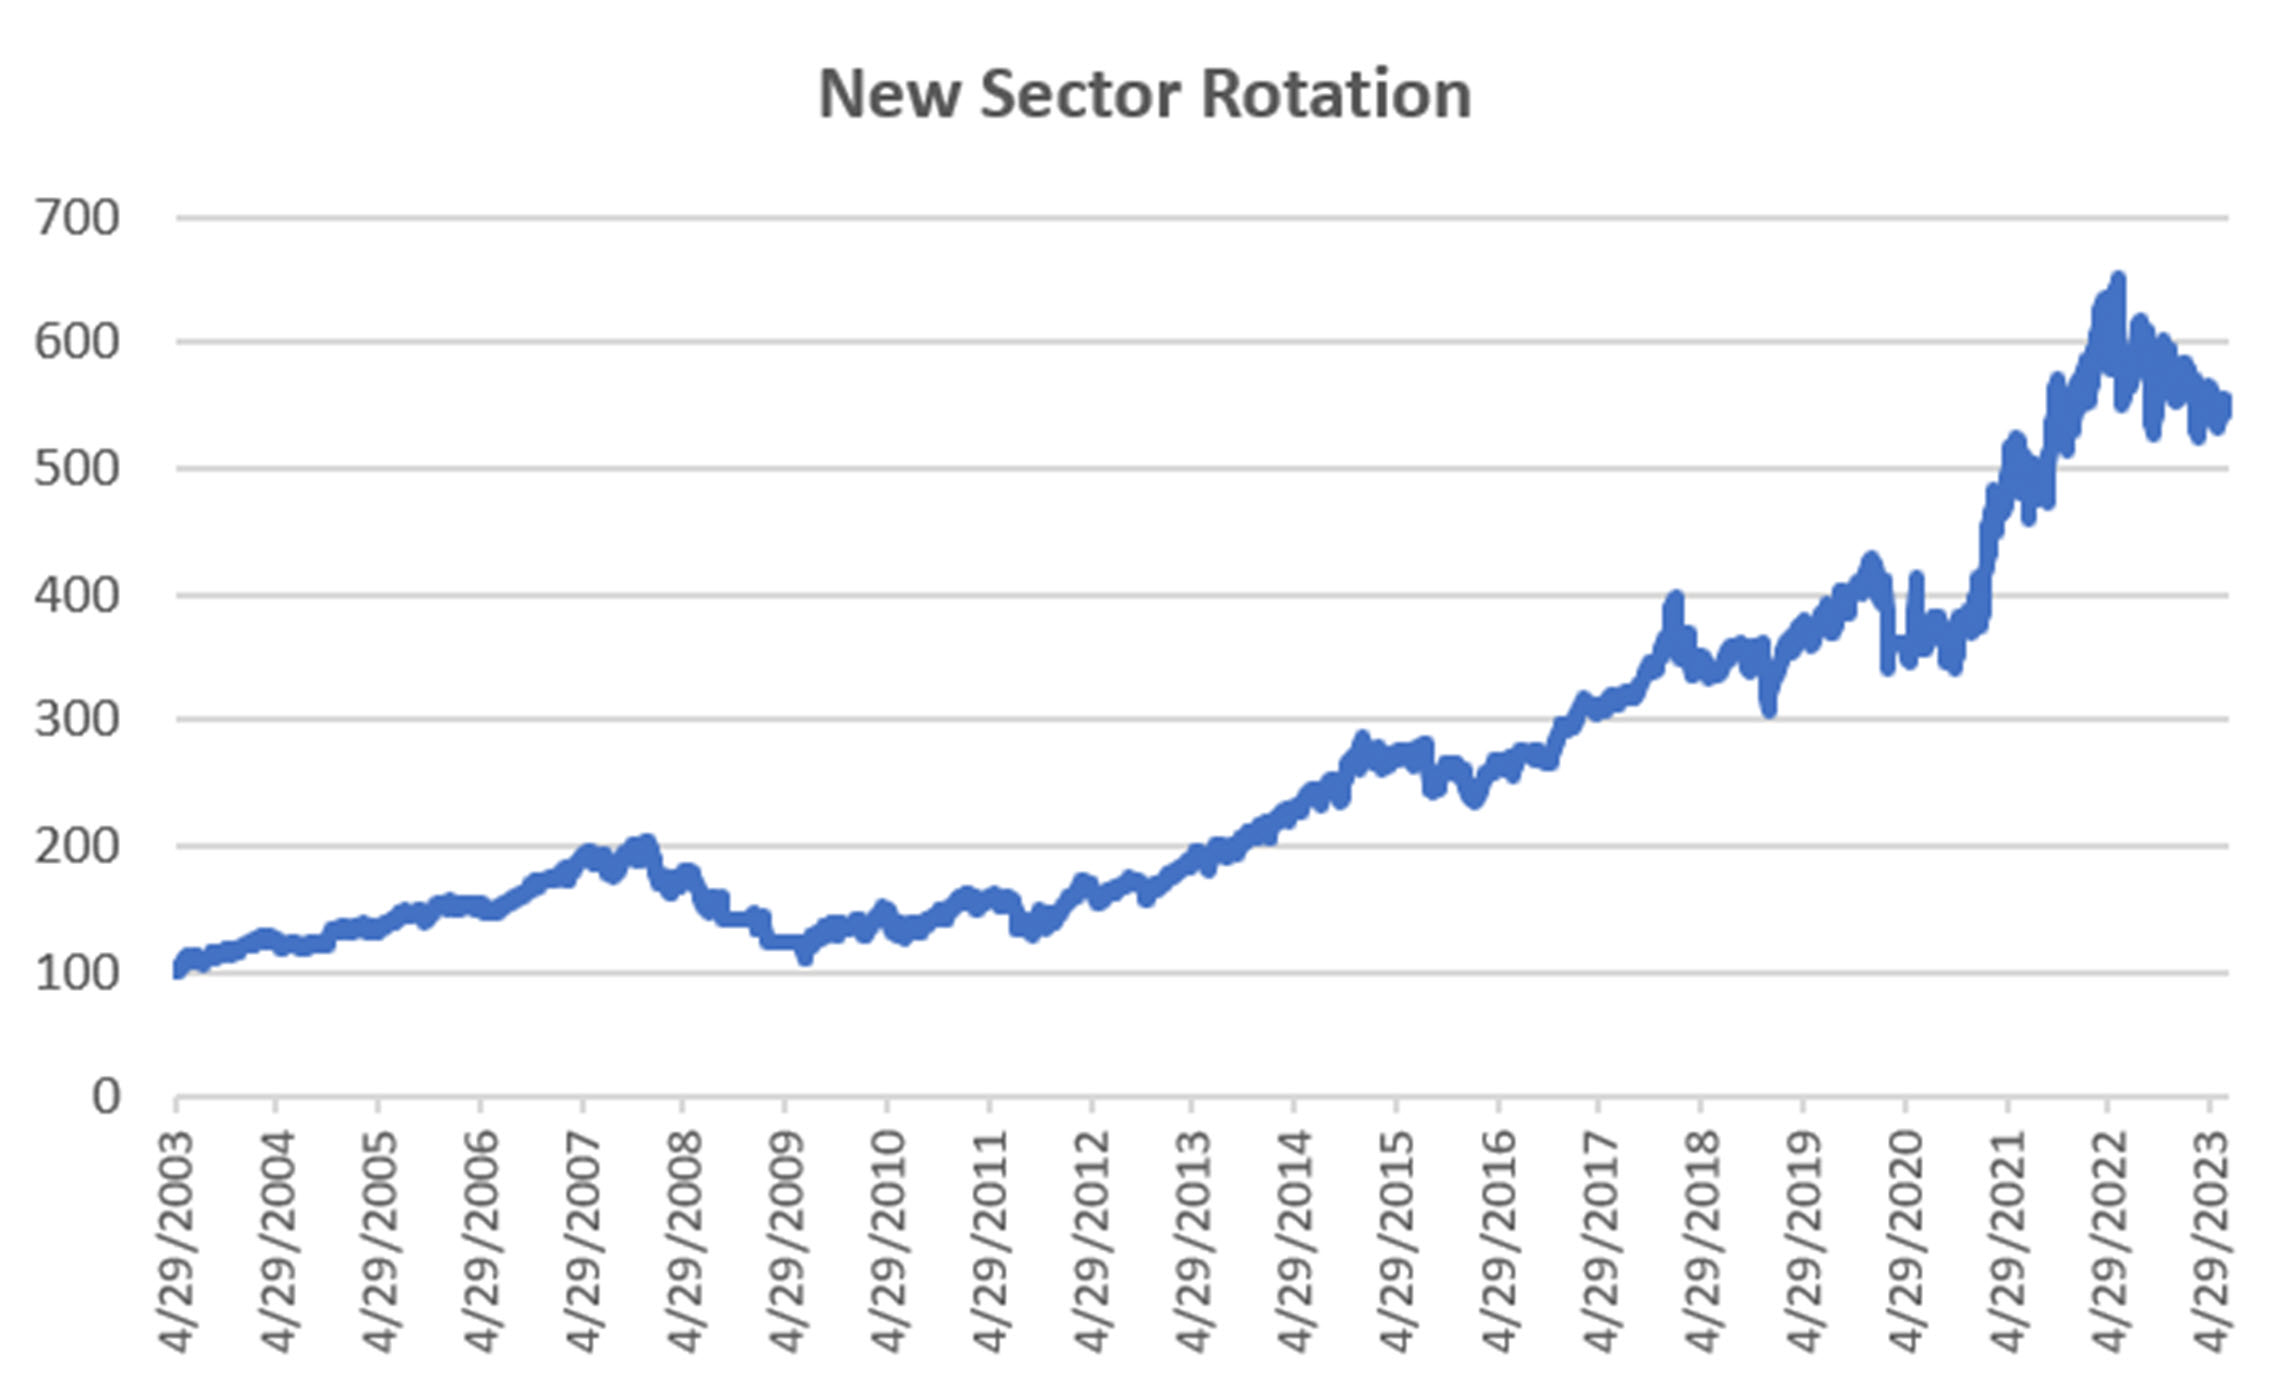
NEW Sector Rotation
The Sector Rotation program gained 3.5% in June, but still posts a 1% loss for the year. It continues to hold that same sectors: Financials (XLF), Staples (XLP), and Utilities (XLU), showing that the other sectors, especially tech, have not yet stabilized. These positions are deemed “safe” and will still generate good returns when the overall market is not driven by a few stocks.
DowHedge Programs
Another case of the Weekly Program outperforming the Daily Program. Both gained more than 3.5% in June but the Weekly DowHedge is higher by 7.5% while the Daily lags at 3.6%. Both are slightly below the returns of DIA, the DOW ETF.

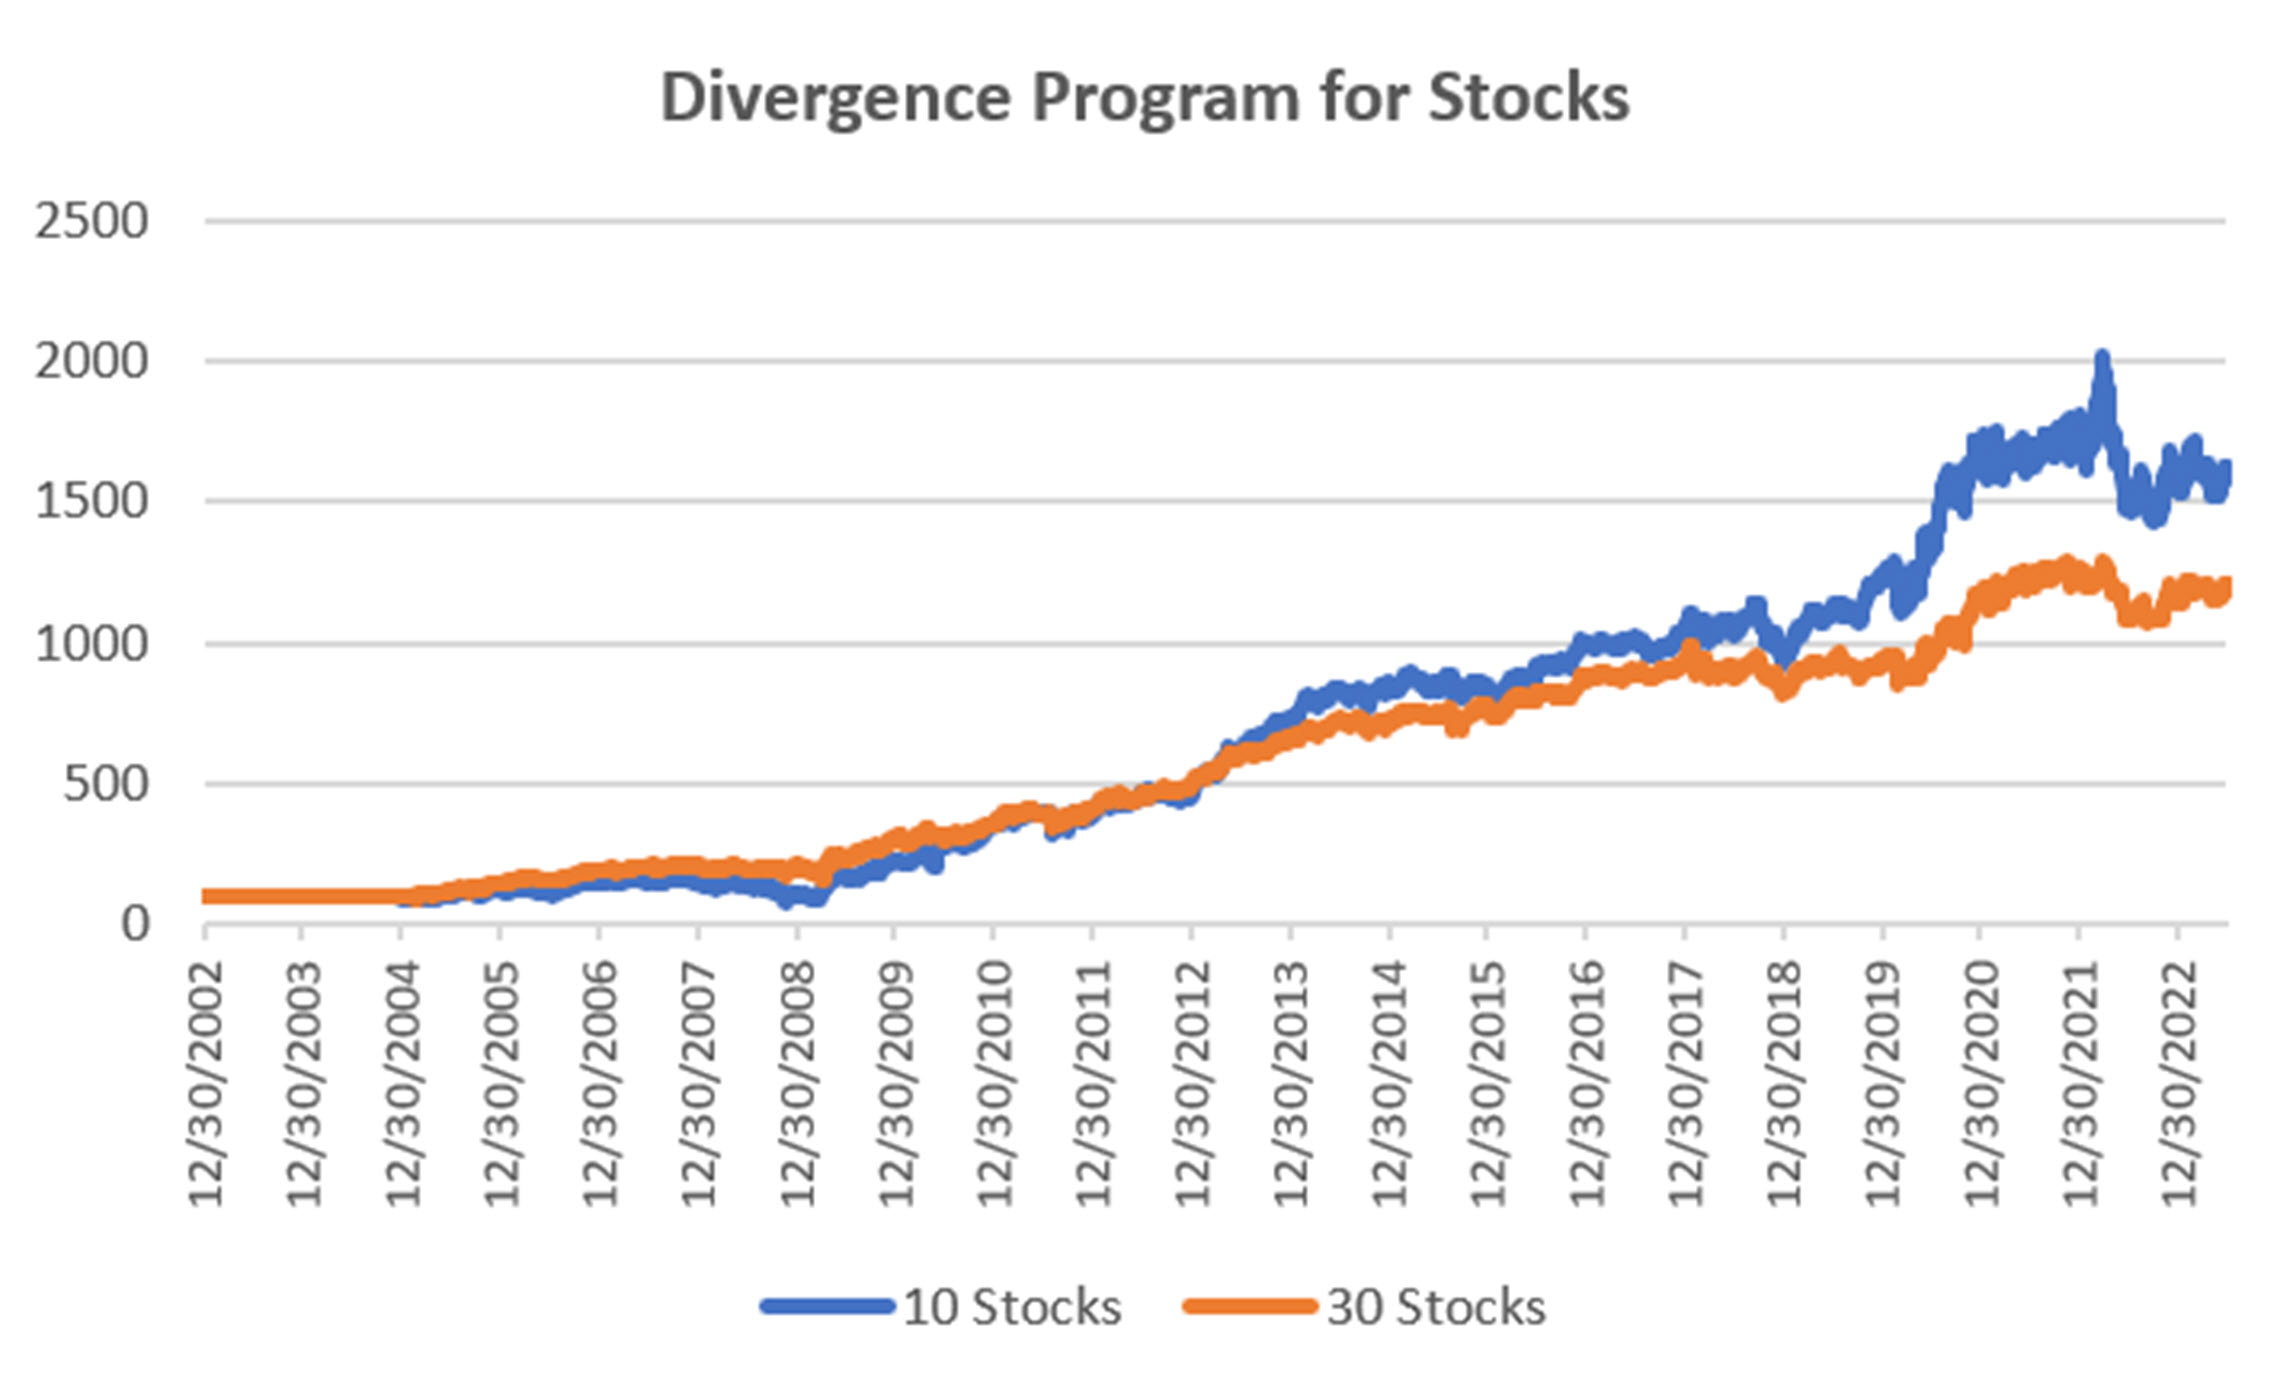
Group DE2: Divergence Program for Stocks
The Divergence program looks for patterns where price and momentum diverge, then takes a position in anticipation of the pattern resolving itself in a predictable direction, often the way prices had moved before the period of uncertainty.
Gains of more than 8% and 5% for the 10-stock and 30-stock Divergence portfolios. Given that this program looks for pauses in an uptrend, it might be telling us that the current move is more of a trend than it appears.
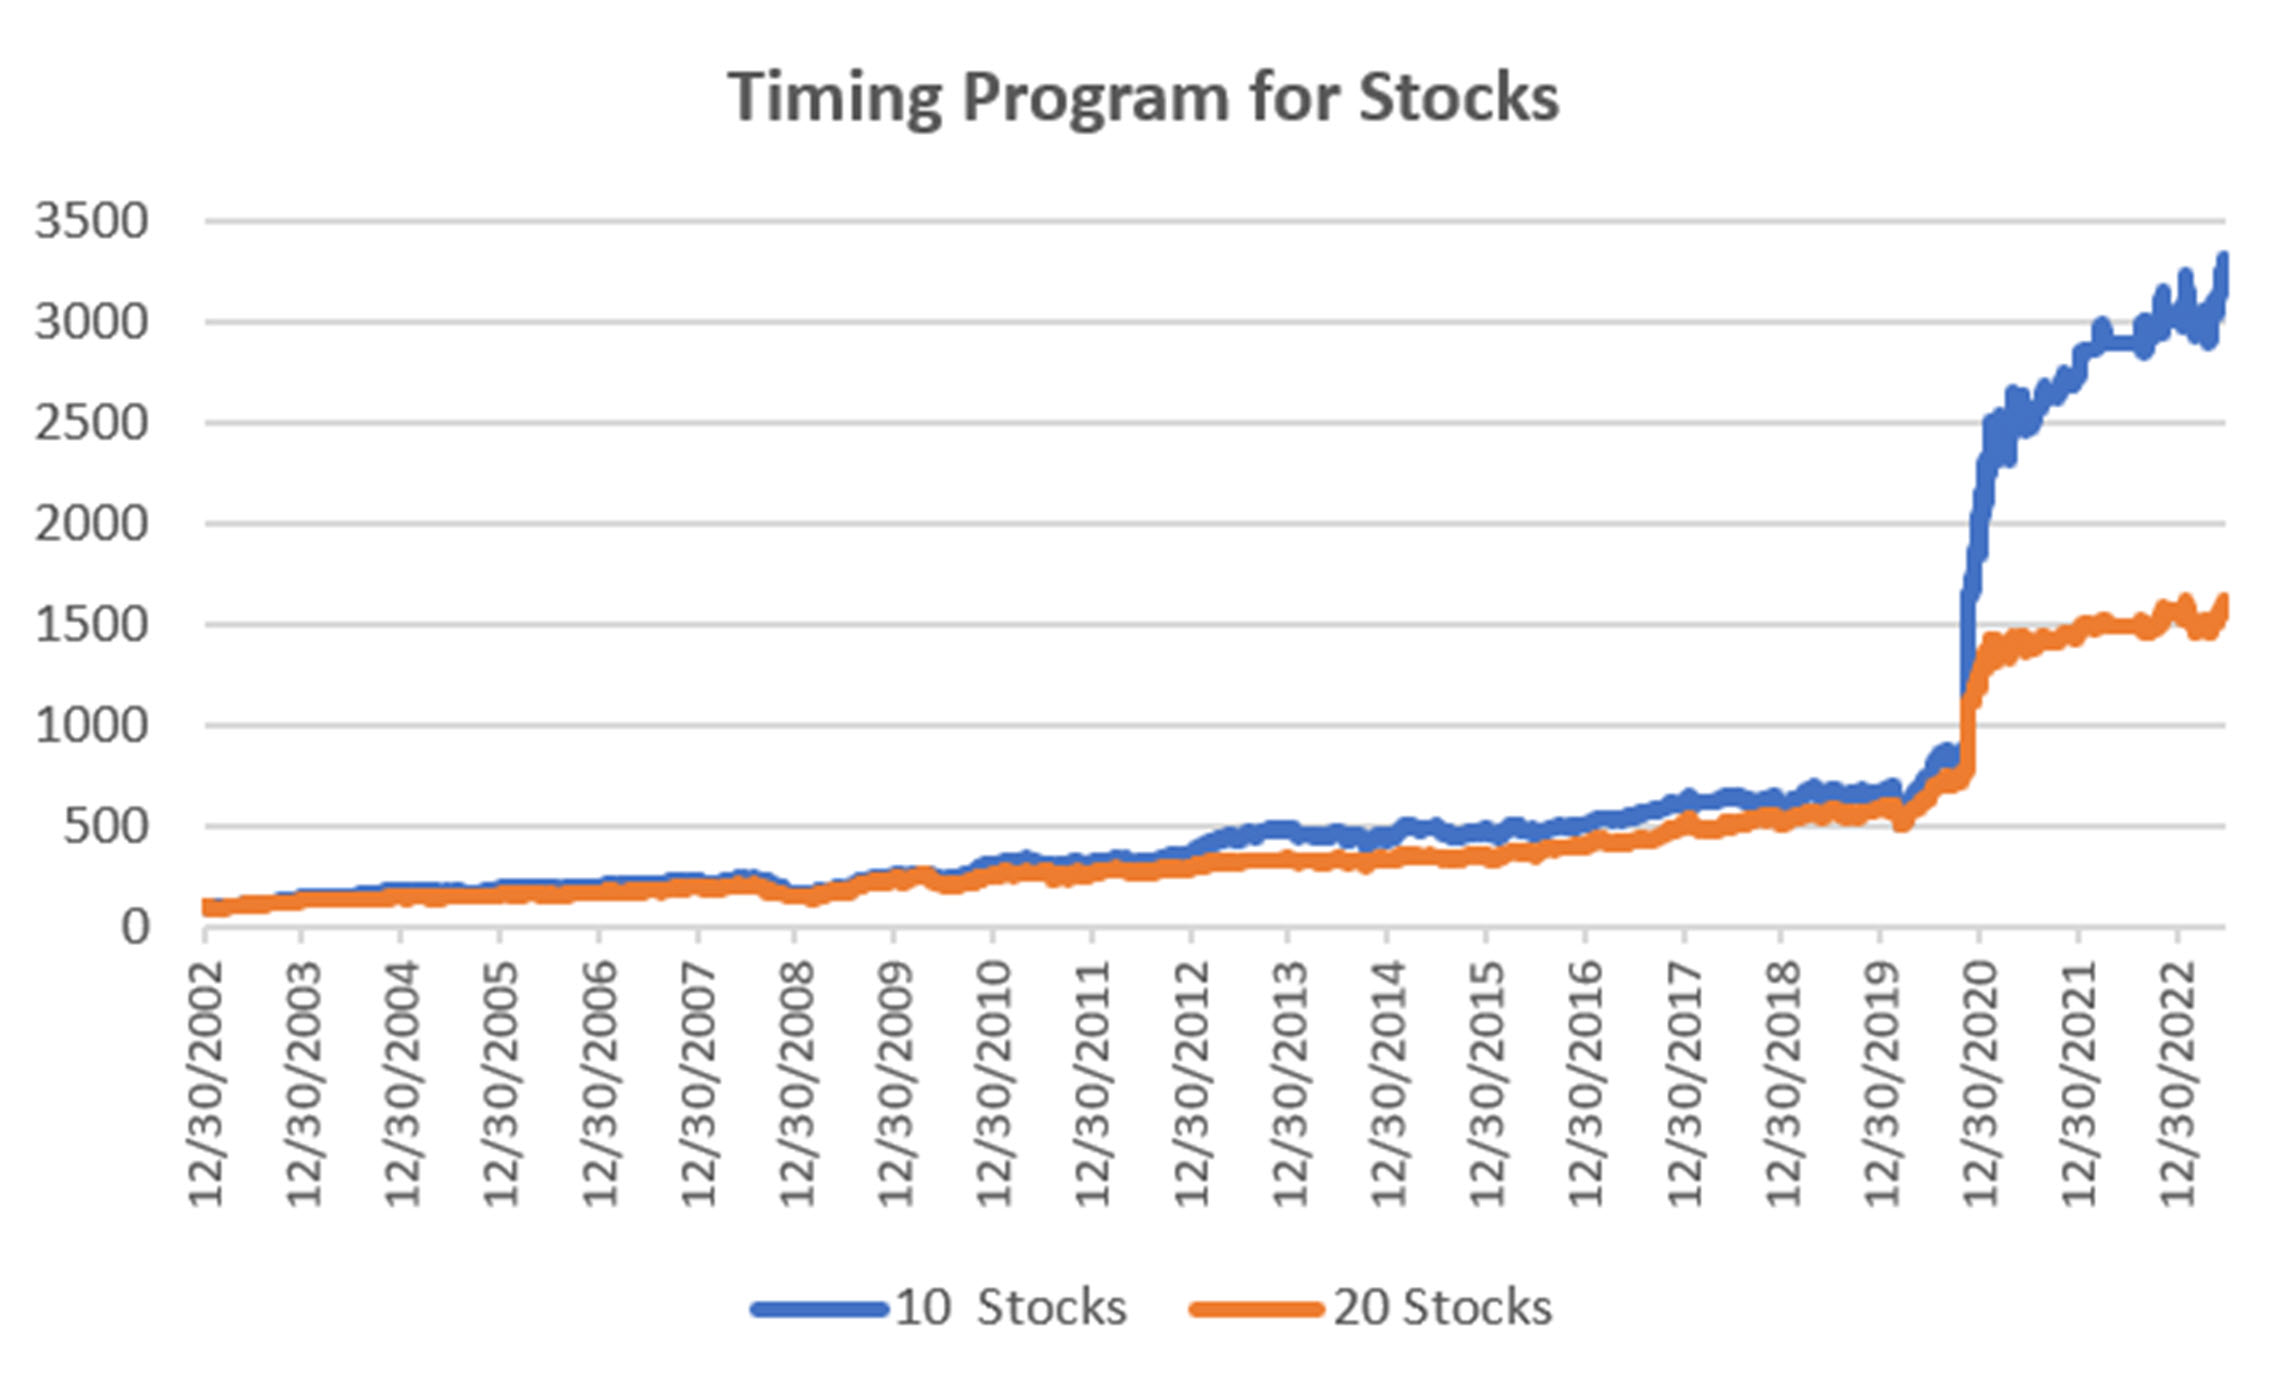
Group DE3: Timing Program for Stocks
The Timing program is a relative-value arbitrage, taking advantage of undervalued stocks relative to its index. It first finds the index that correlates best with a stock, then waits for an oversold indicator within an upwards trend. It exits when the stock price normalizes relative to the index, or the trend turns down. These portfolios are long-only because the upwards bias in stocks and that they are most often used in retirement accounts.
Another gain of 2% to 3% this month brings the Timing program to all-time highs. Because moves have been small in that past few months, the chart makes this recent move look big. Still, this program continues to perform well, holding risk to a minimum and now looking as though it is ready for an upwards move.
Futures Programs
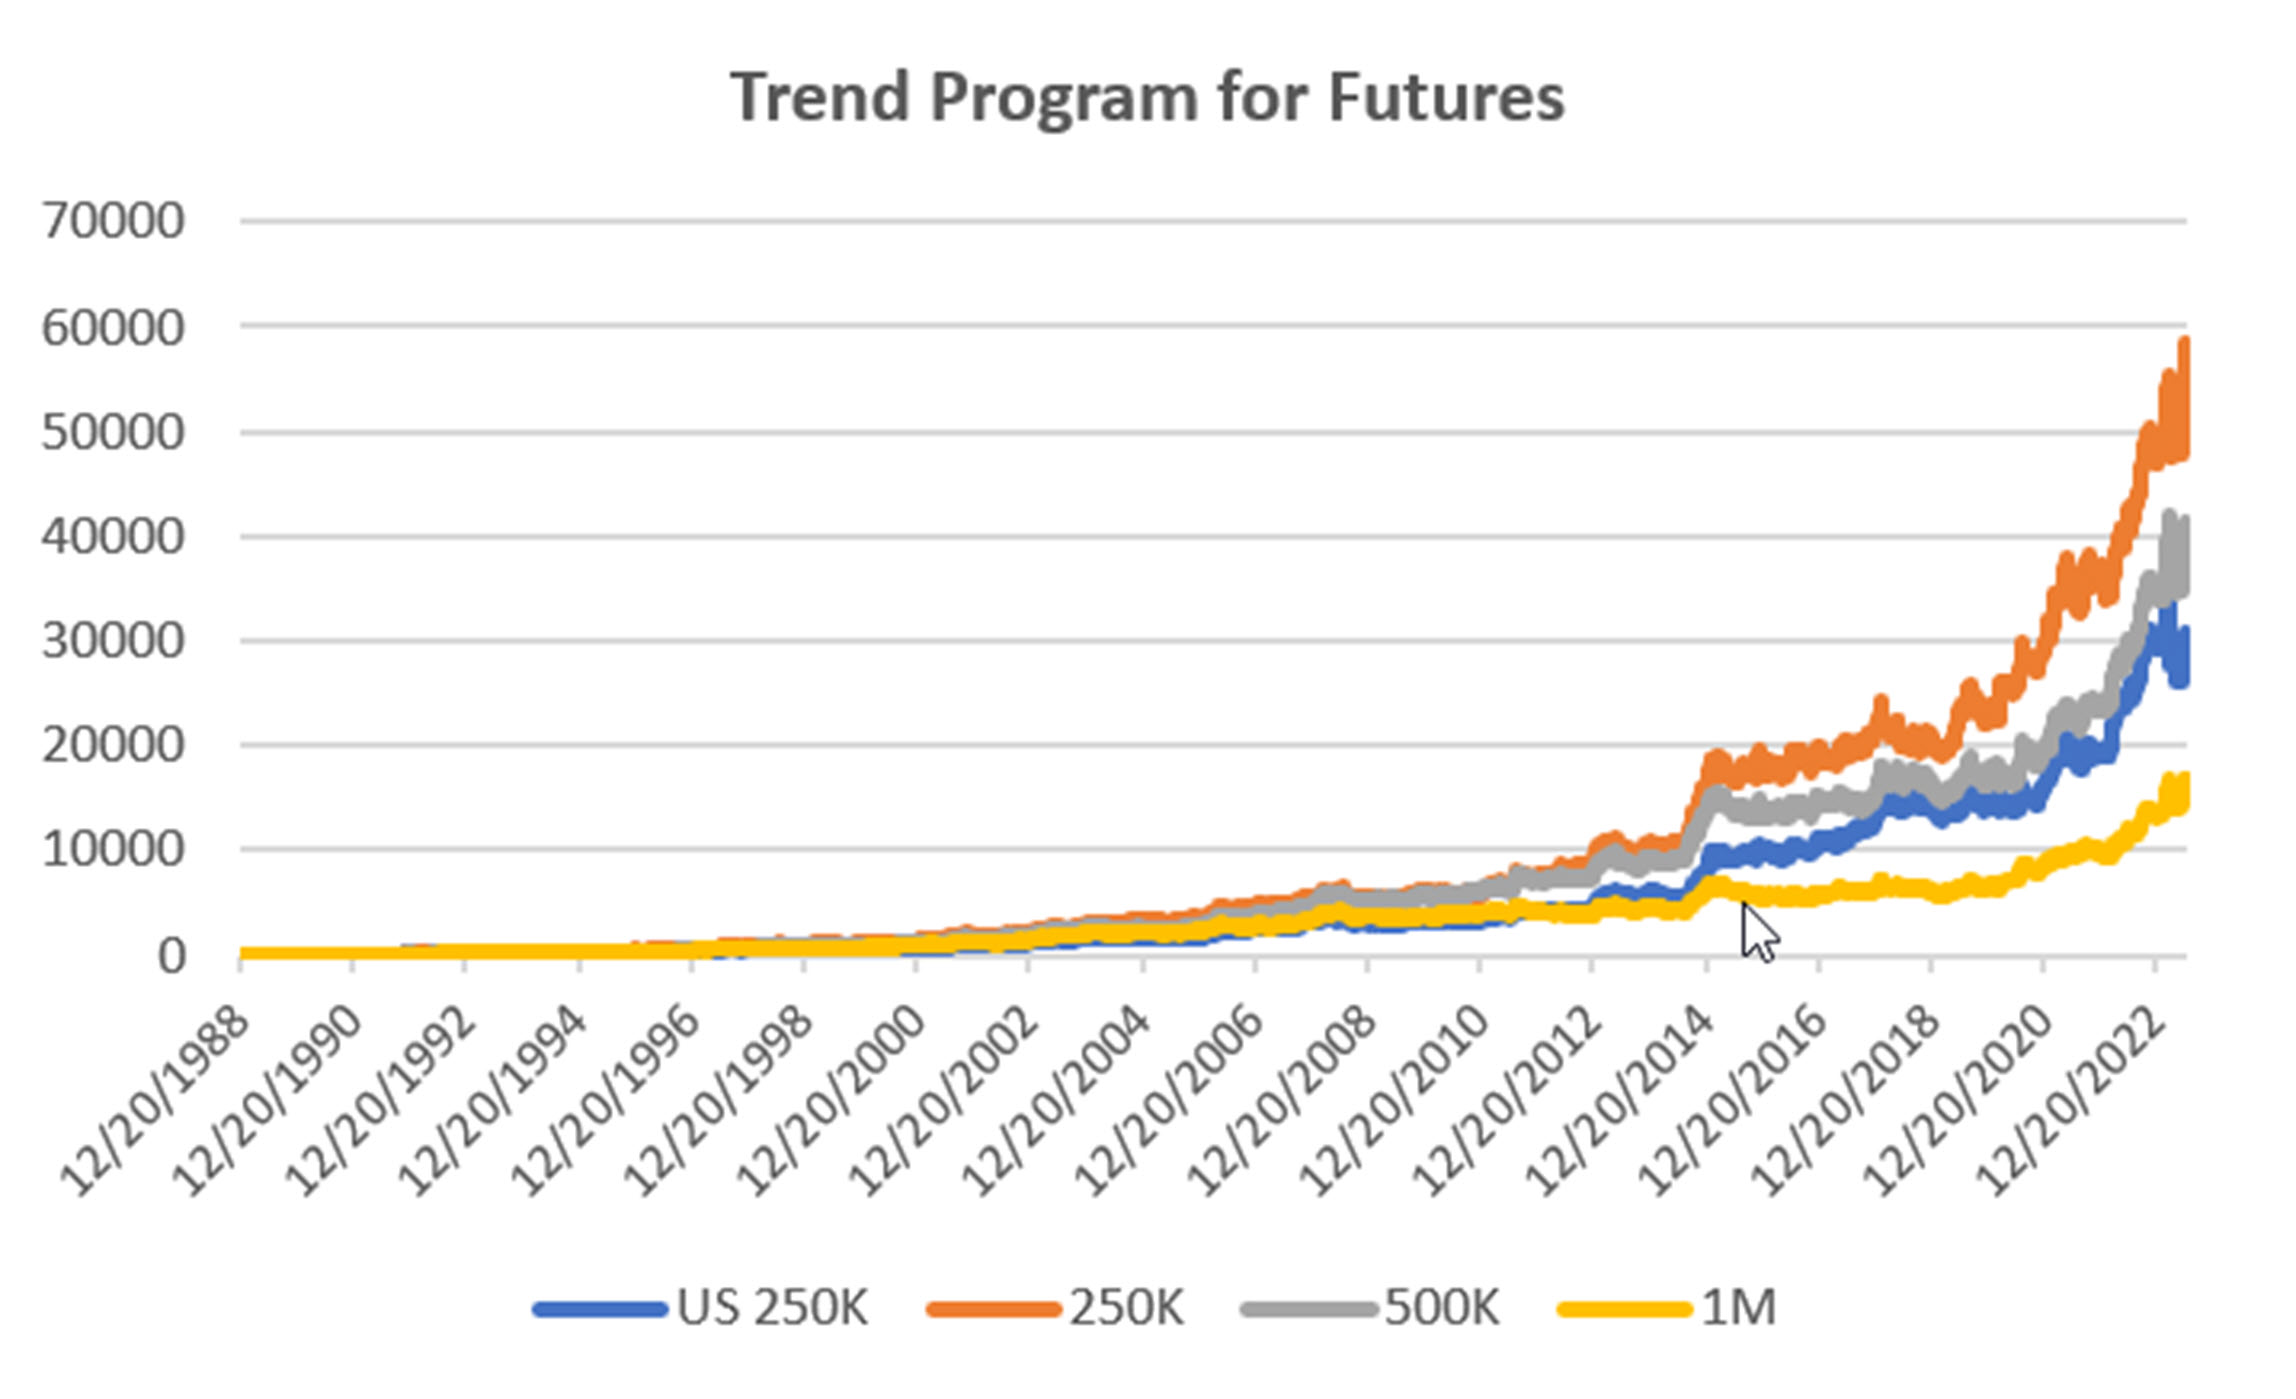
Groups DF1 and WF1: Daily and Weekly Trend Programs for Futures
Futures allow both high leverage and true diversification. The larger portfolios, such as $1million, are diversified into both commodities and world index and interest rate markets, in addition to foreign exchange. Its performance is not expected to track the U.S. stock market and is a hedge in every sense because it is uncorrelated. As the portfolio becomes more diversified its returns are more stable.
The leverage available in futures markets allows us to manage the risk in the portfolio, something not possible to the same degree with stocks. This portfolio targets 14% volatility. Investors interested in lower leverage can simply scale down all positions equally in proportion to their volatility preference. Note that these portfolios do not trade Asian futures, which we believe are more difficult for U.S. investors to execute. The “US 250K” portfolio trades only U.S. futures.
What a difference a month makes! Having taking a big loss in Eurodollars, the futures program gained 16% in all portfolios in June, posting nice gains for the year. The orders did show a lot of adding and reducing position sizes due to extreme volatility, but in the end it worked out. Now we can see if it can capitalize on this in July.
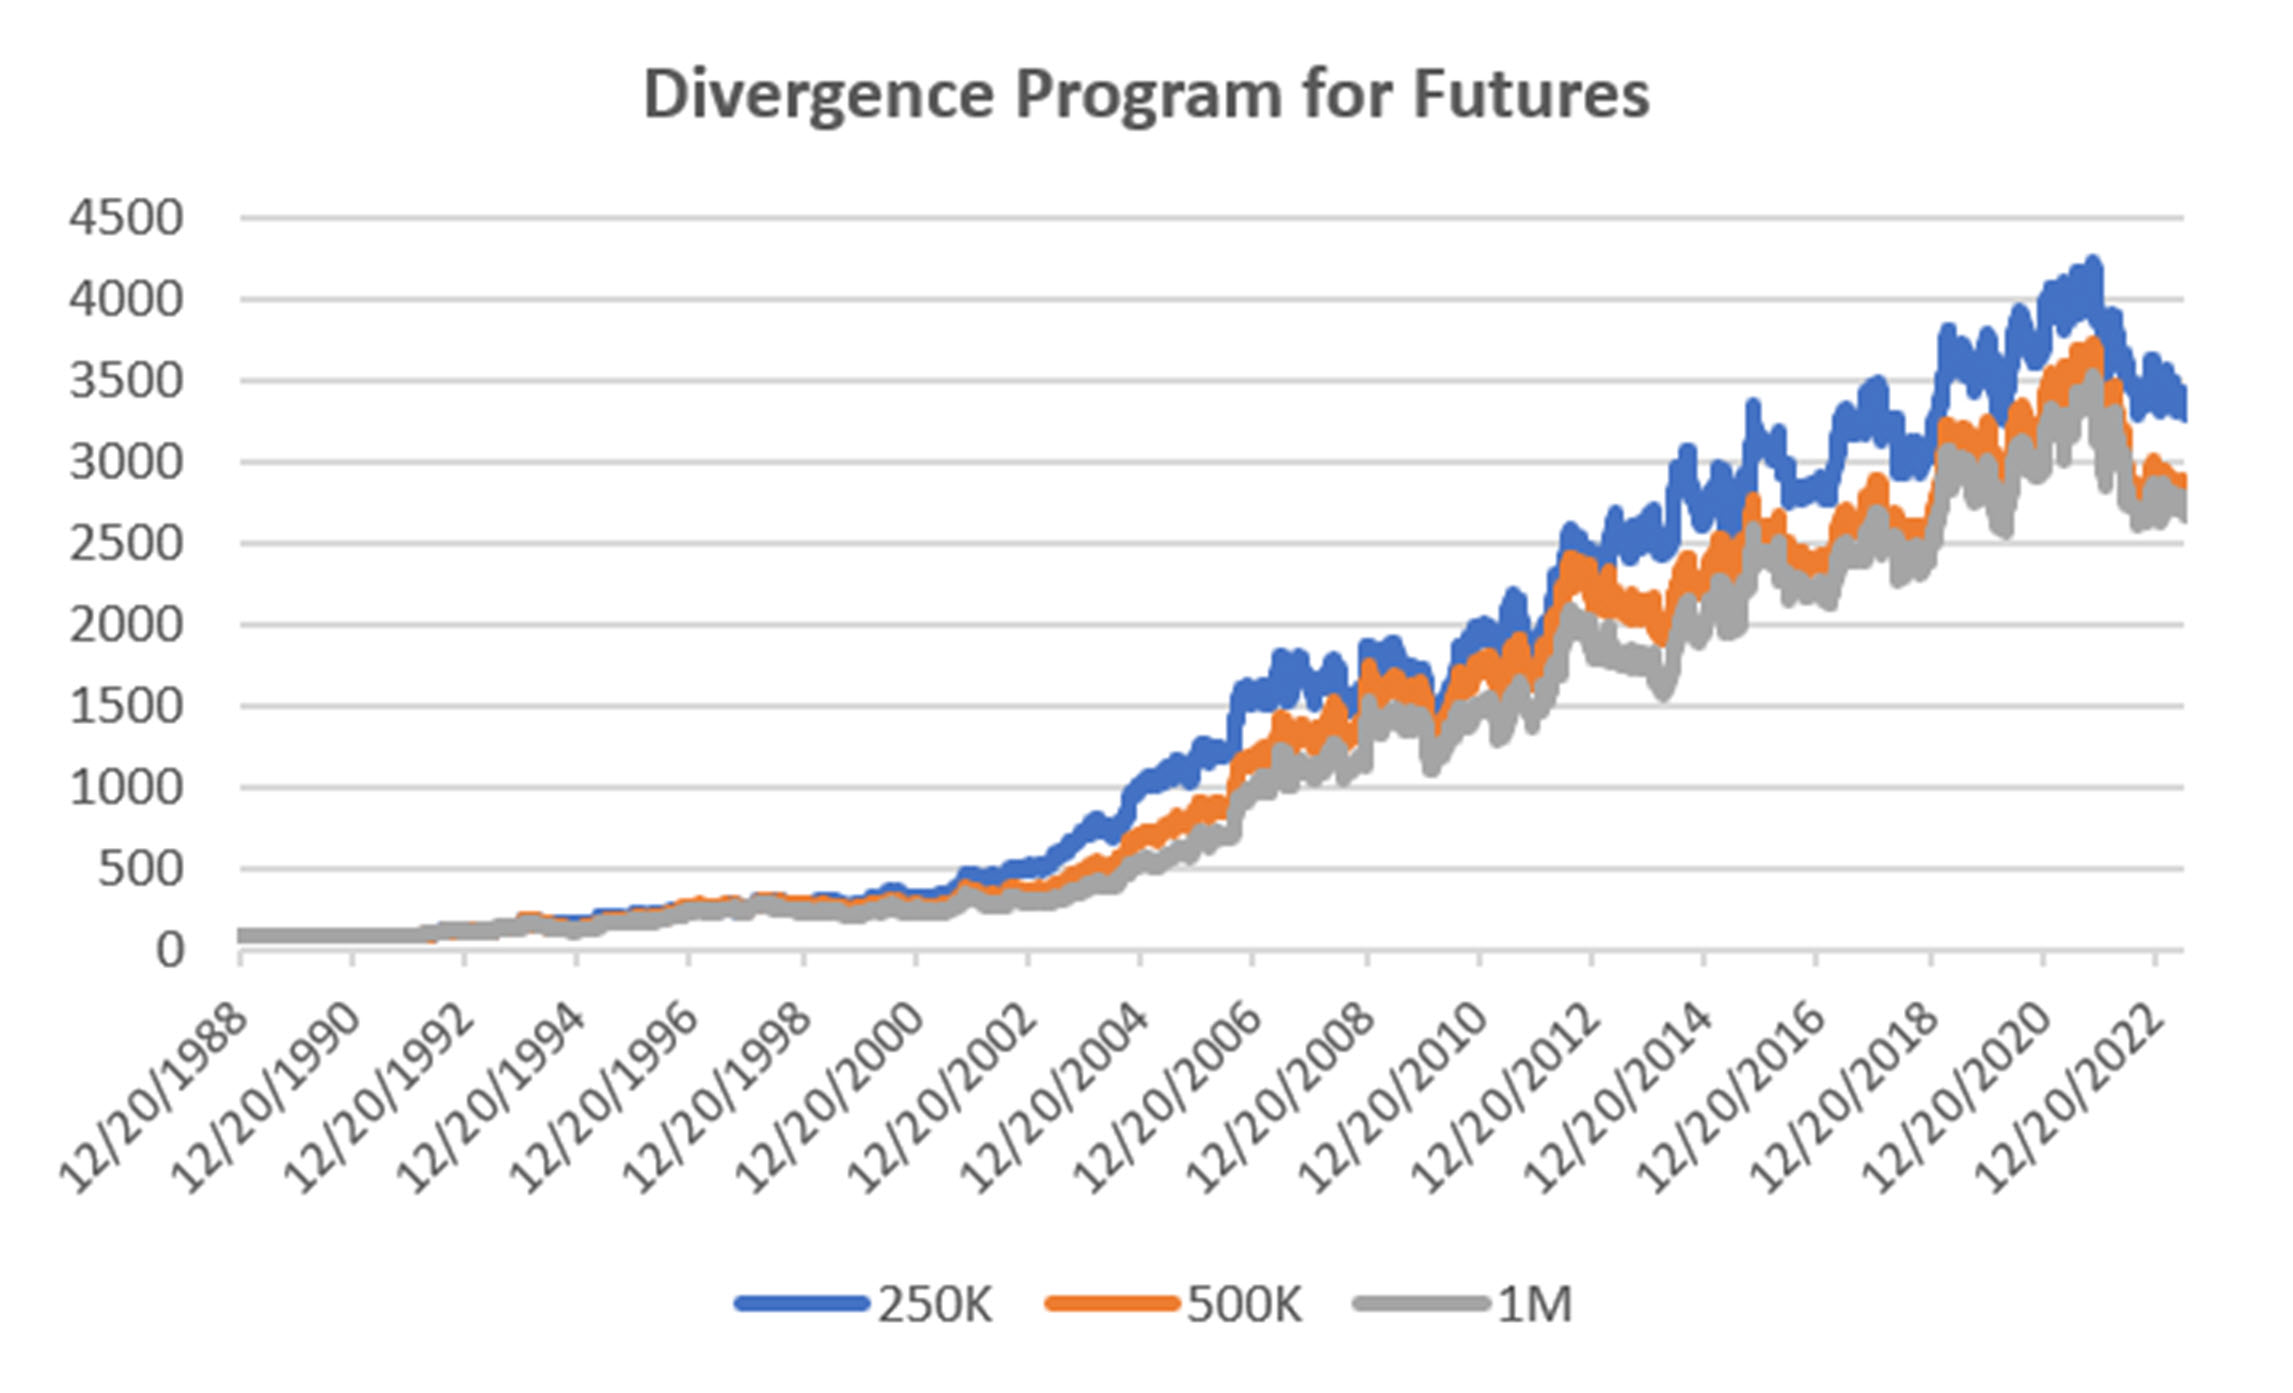
Group DF2: Divergence Portfolio for Futures
The best we can say about this Divergence Program is that it’s holding its own. Losses of about 2% puts the program down by that amount for the year. If we compare it to the Industry performance, it is not far off, but we prefer a better return.
Blogs and Recent Publications
Perry’s books are all available on Amazon or through our website, www.kaufmansignals.com.
June 2023
Another article in Technical Analysis, “Protecting Your Wealth While Making a Profit.” It shows that moving money into different world equity markets can take advantage of momentum in both price and exchange rates.
May 2023
A new post on Seeking Alpha, “Profiting From Green Energy – But Not EVs” on May 31. Shows which stocks are best for investing in energy given the moving targets.
April 2023
On April 18th, Perry gave a webinar to the Society of Technical Analysts (London) on how to develop and test a successful trading system. Check their website for more details, https://www.technicalanalysts.com..
The April issue of Technical Analysis of Stocks & Commodities published a new article by Perry, “Repatriation,” an interesting trading pattern used by FX traders but adapted for us “normal traders.”
March 2023
Perry was interviewed by Mark Ursell of Ursell of TradeInform on March 3. You can see it or listen to it on UTube https://www.youtube.com/watch?v=9gIlIIzngCk. Or, you can listen to it at
A new article by Perry, “Can Volume Predict Price?” in the March issue of Technical Analysis of Stocks & Commodities. You’ll need to read it to find out!
February 2023
The February 2023 issue of Technical Analysis of Stocks & Commodities published Perry’s article, “Do Small Price Changes Matter?” It tells you whether you should be ignoring those days when prices close up or down by a fraction.
Perry gave a webinar to Eduardo Lopez’ Robotrader students in Spain on Wednesday, February 8, noon (New York).
January 2023
Another year! Technical Analysis of Stocks & Commodities published “Matching the Markets to the Strategy” in the January issue. It is a look at why certain markets do best with specific strategies and why that can materially improve results.
Alejandro de Luis will publish Perry’s article “Living Off Profits,” translated into Spanish, in the January issue of his magazine, Hispatrading. It’s a good way to practice your Spanish!
Seeking Alpha posted Perry’s article, “How To Hedge Your Equity Portfolio,” showing a way to follow the Fed action.
October 2022
An interview with Perry was featured in the October anniversary issue of Technical Analysis of Stocks & Commodities. The interviewer is his wife, Barbara Diamond, giving a different perspective on his career.
September 2022
“The Real Risk of System Trading” can be found in the September issue of Technical Analysis of Stocks & Commodities. It summarizes the many way we can measure risk and suggests ways that will help you.
July 2022
The basis for this month’s Close-Up was posted on Seeking Alpha June 16. This month, Perry posted “3 Ways to Reduce Risk and 2 Ways to Increase Profits.”
Older Items of Interest
Perry’s webinar on risk, given to the U.K. Society of Technical Analysts, can be seen using the following link: https://vimeo.com/708691362/04c8fb70ea
For older articles please scan the websites for Technical Analysis of Stocks & Commodities, Modern Trader, Seeking Alpha, ProActive Advisor Magazine, and Forbes. You will also find recorded presentations given by Mr. Kaufman at BetterSystemTrader.com, TalkingTrading.com, FXCM.com, systemtrade.pl, the website for Alex Gerchik, Michael Covel’s website, TrendFollowing.com, and Talking Trading.com.
In May 2021, Mr. Kaufman gave a 30-minute presentation, “Lagged Trends,” for The Money Show on Tuesday, May 11. You can see it using the following link: https://youtu.be/bh2fA8oBwBk
You will also find back copies of our “Close-Up” reports on our website, www.kaufmansignals.com. You can address any questions to perry@kaufmansignalsdaily.com.
© June 2023, Etna Publishing, LLC. All Rights Reserved.