

Industry Benchmark Performance
Funds did well in March, but not as well as the overall stock index. Still, it’s a good start. Futures also did well, in particular the SG portfolios. It’s unusual to see all funds profitable!

Kaufman’sMost Popular Books (available on Amazon)
Trading Systems and Methods, 6th Edition. The complete guide to trading systems, with more than 250 programs and spreadsheets. The most important book for a system developer.
Kaufman Constructs Trading Systems. A step-by-step manual on how to develop, test, and trade an algorithmic system.
Learn To Trade. Written for both serious beginners and practiced traders, this book includes chart formations, trends, indicators, trading rules, risk, and portfolio management. You can find it in color on Amazon.
You can also find these books on our website, www.kaufmansignals.com.
Blogs and Recent Publications
Find Mr. Kaufman’s other recent publications and seminars at the end of this report. We post new interviews, seminars, and reference new articles by Mr. Kaufman each month.
March Performance in Brief
The stock market rally seems to be broadening, despite caution from the Fed. That means it is unlikely that there will be a surge to the upside. Instead, we should see some back and forth gains over the next few months.
Our trend portfolio did well in March, while other strategies were mixed. We are beating the stock index in the smaller portfolios and doing well overall.
Major Equity ETFs
If we didn’t look at the dates at the bottom of the chart, this months Equity ETFs look just like February’s picture. All four ETFs gained between 1% and 3.5%, with the small caps and the S&P gaining the most. The DOW and IWM seem to be tracking each other, an odd situation. Nasdaq (QQQ) leveled off a bit, but then it has been the leader.

CLOSE-UP: Trading the News
(Some personal observations)
Just to be clear, these are my own opinions, having observed the impact from news over a long time.
Let me start by giving you some old quotes:
- “Buy the rumor, sell the news”
- A technical analyst should never look at the news.
- Fake news is cheap to produce. Genuine journalism is expensive.
- When fake news is repeated, it becomes difficult to discern what is real.
- Fake news thrives because few verify what is real.
- Every news article has a bias.
Then there are quotes about investors:
- “The stock market is filled with individuals who know the price of everything, but the value of nothing.” – Philip Fisher.
- “An investment in knowledge pays the best interest.” – Benjamin Franklin.
- “Never invest in a business you cannot understand.” Warren Buffett
- “Price is what you pay. Value is what you get.” Warren Buffett
- “It’s far better to buy a wonderful company at a fair price, than a fair company at a wonderful price.” Warren Buffett
I quote them simply as a good reminder. I’ll use some examples.
Magnificent 7
The news has a way of personalizing stocks. I don’t think they are promoting anything, it’s just their way of capturing your attention. Figure 1 is a chart of the “Magnificent 7” stocks since 2019. They are Apple (AAPL), Amazon (AMZN), Google (GOOGL), Meta (META), Microsoft (MSFT), and Tesla (TSLA). If you remember, two months ago I suggested that Tesla was not a good buy. It may have reached bottom now, but there is still a lot of competition that continues to surface. Don’t expect much.
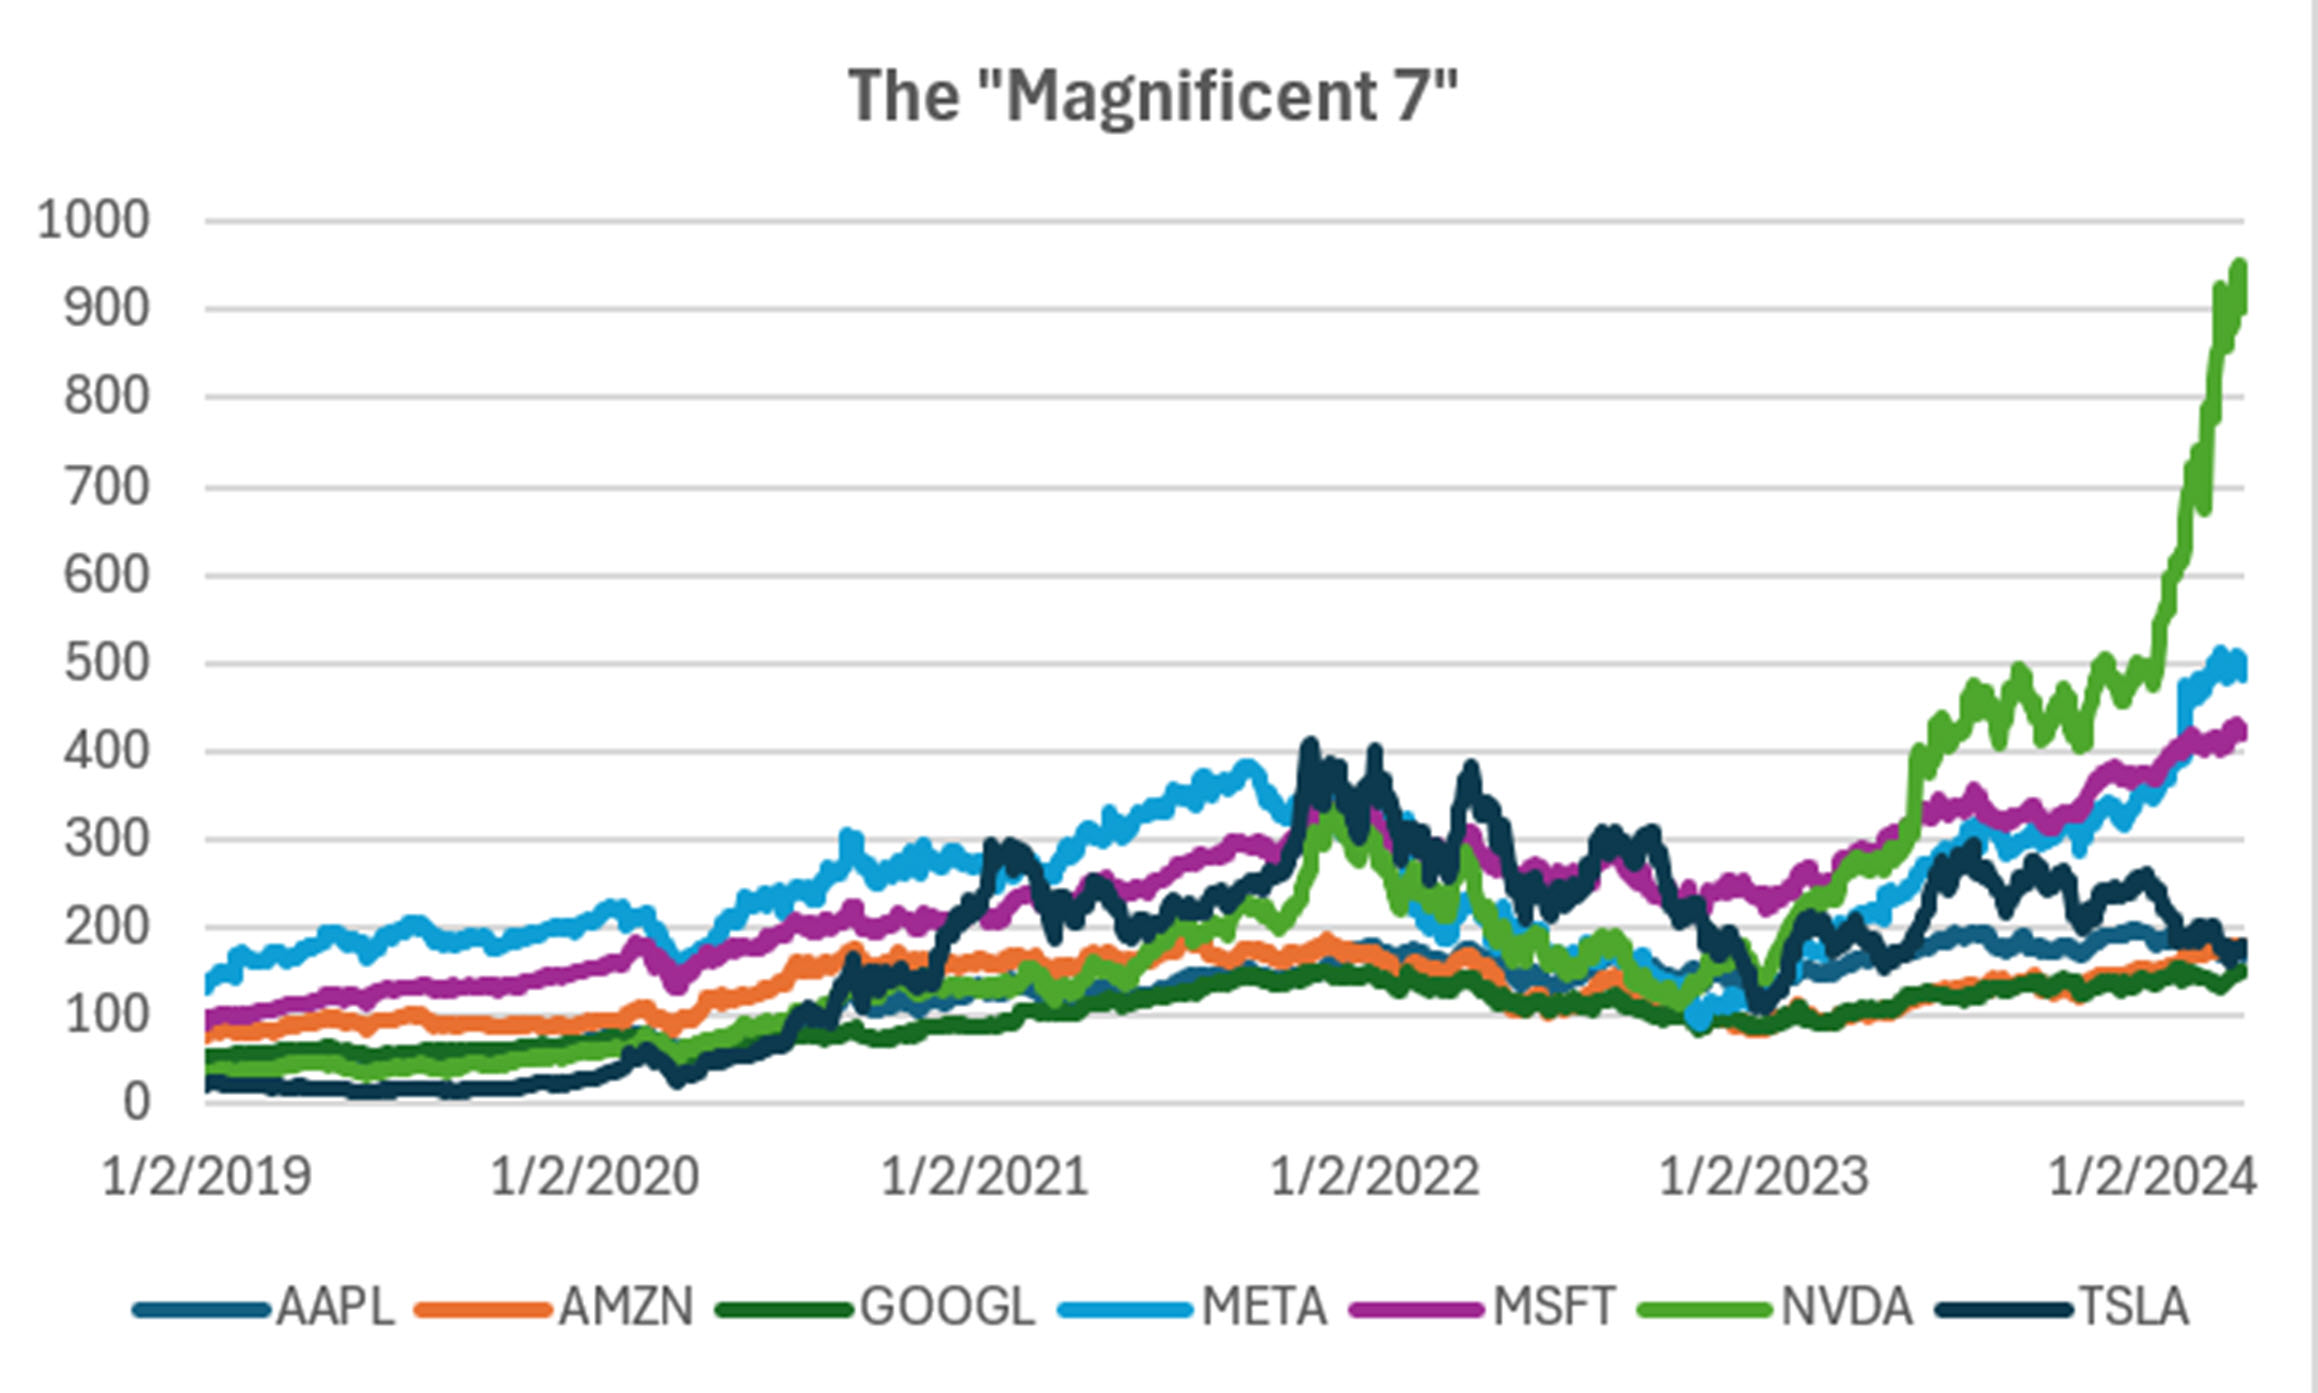
Figure 1. Prices of the “Magnificent 7” since 2019.
The seven stocks seem to be related to the surge in artificial intelligence (AI). While they are not semiconductor stocks, they are the users of AI. How have they performed? Table 1 shows returns, risk, and the information ratio (payout) from 2019. I thought five years was about right for evaluating these stocks.
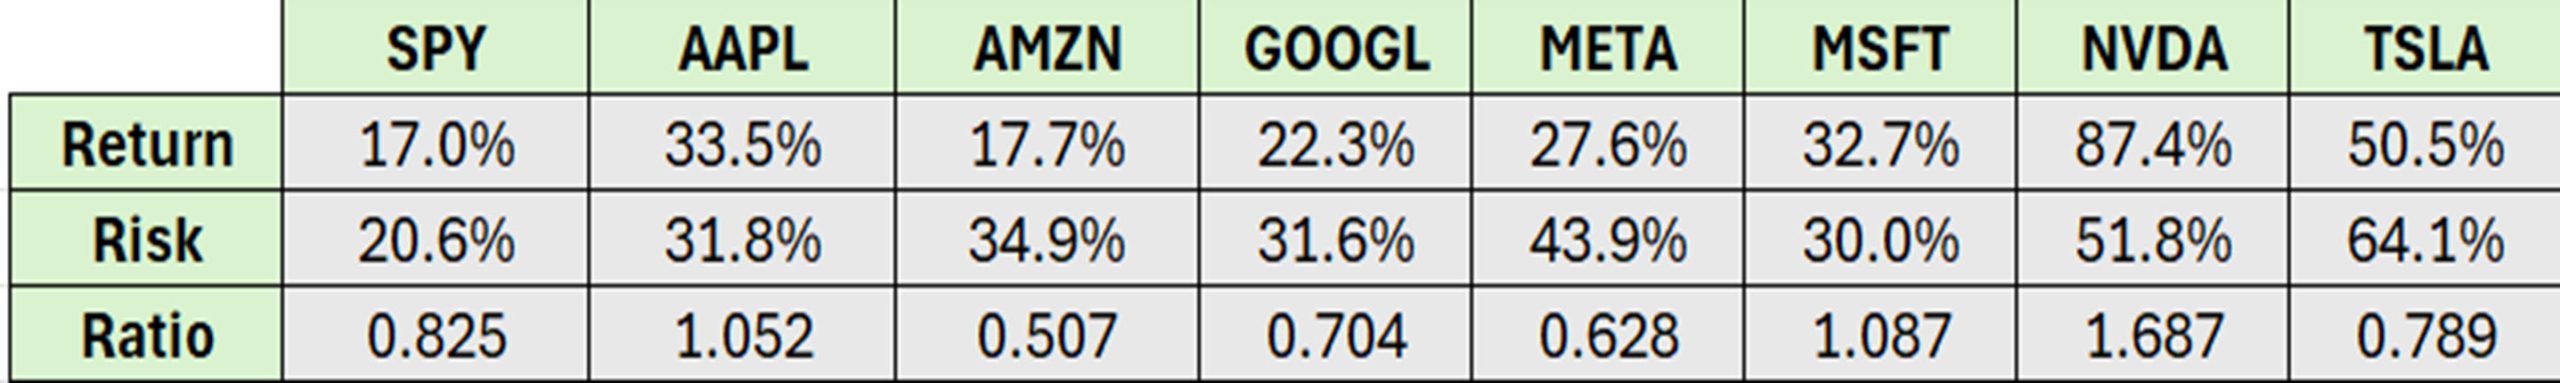
Table 1. Statistics for the Magnificent 7 from 2019.
I’ve added the S&P ETF, SPY, for comparison. It shows the lowest return but not the lowest risk. Only three of the stocks show a payout (return divided by risk) better than the S&P. If you’re going for return, all except AMZN show incredible returns, but also very high risk.
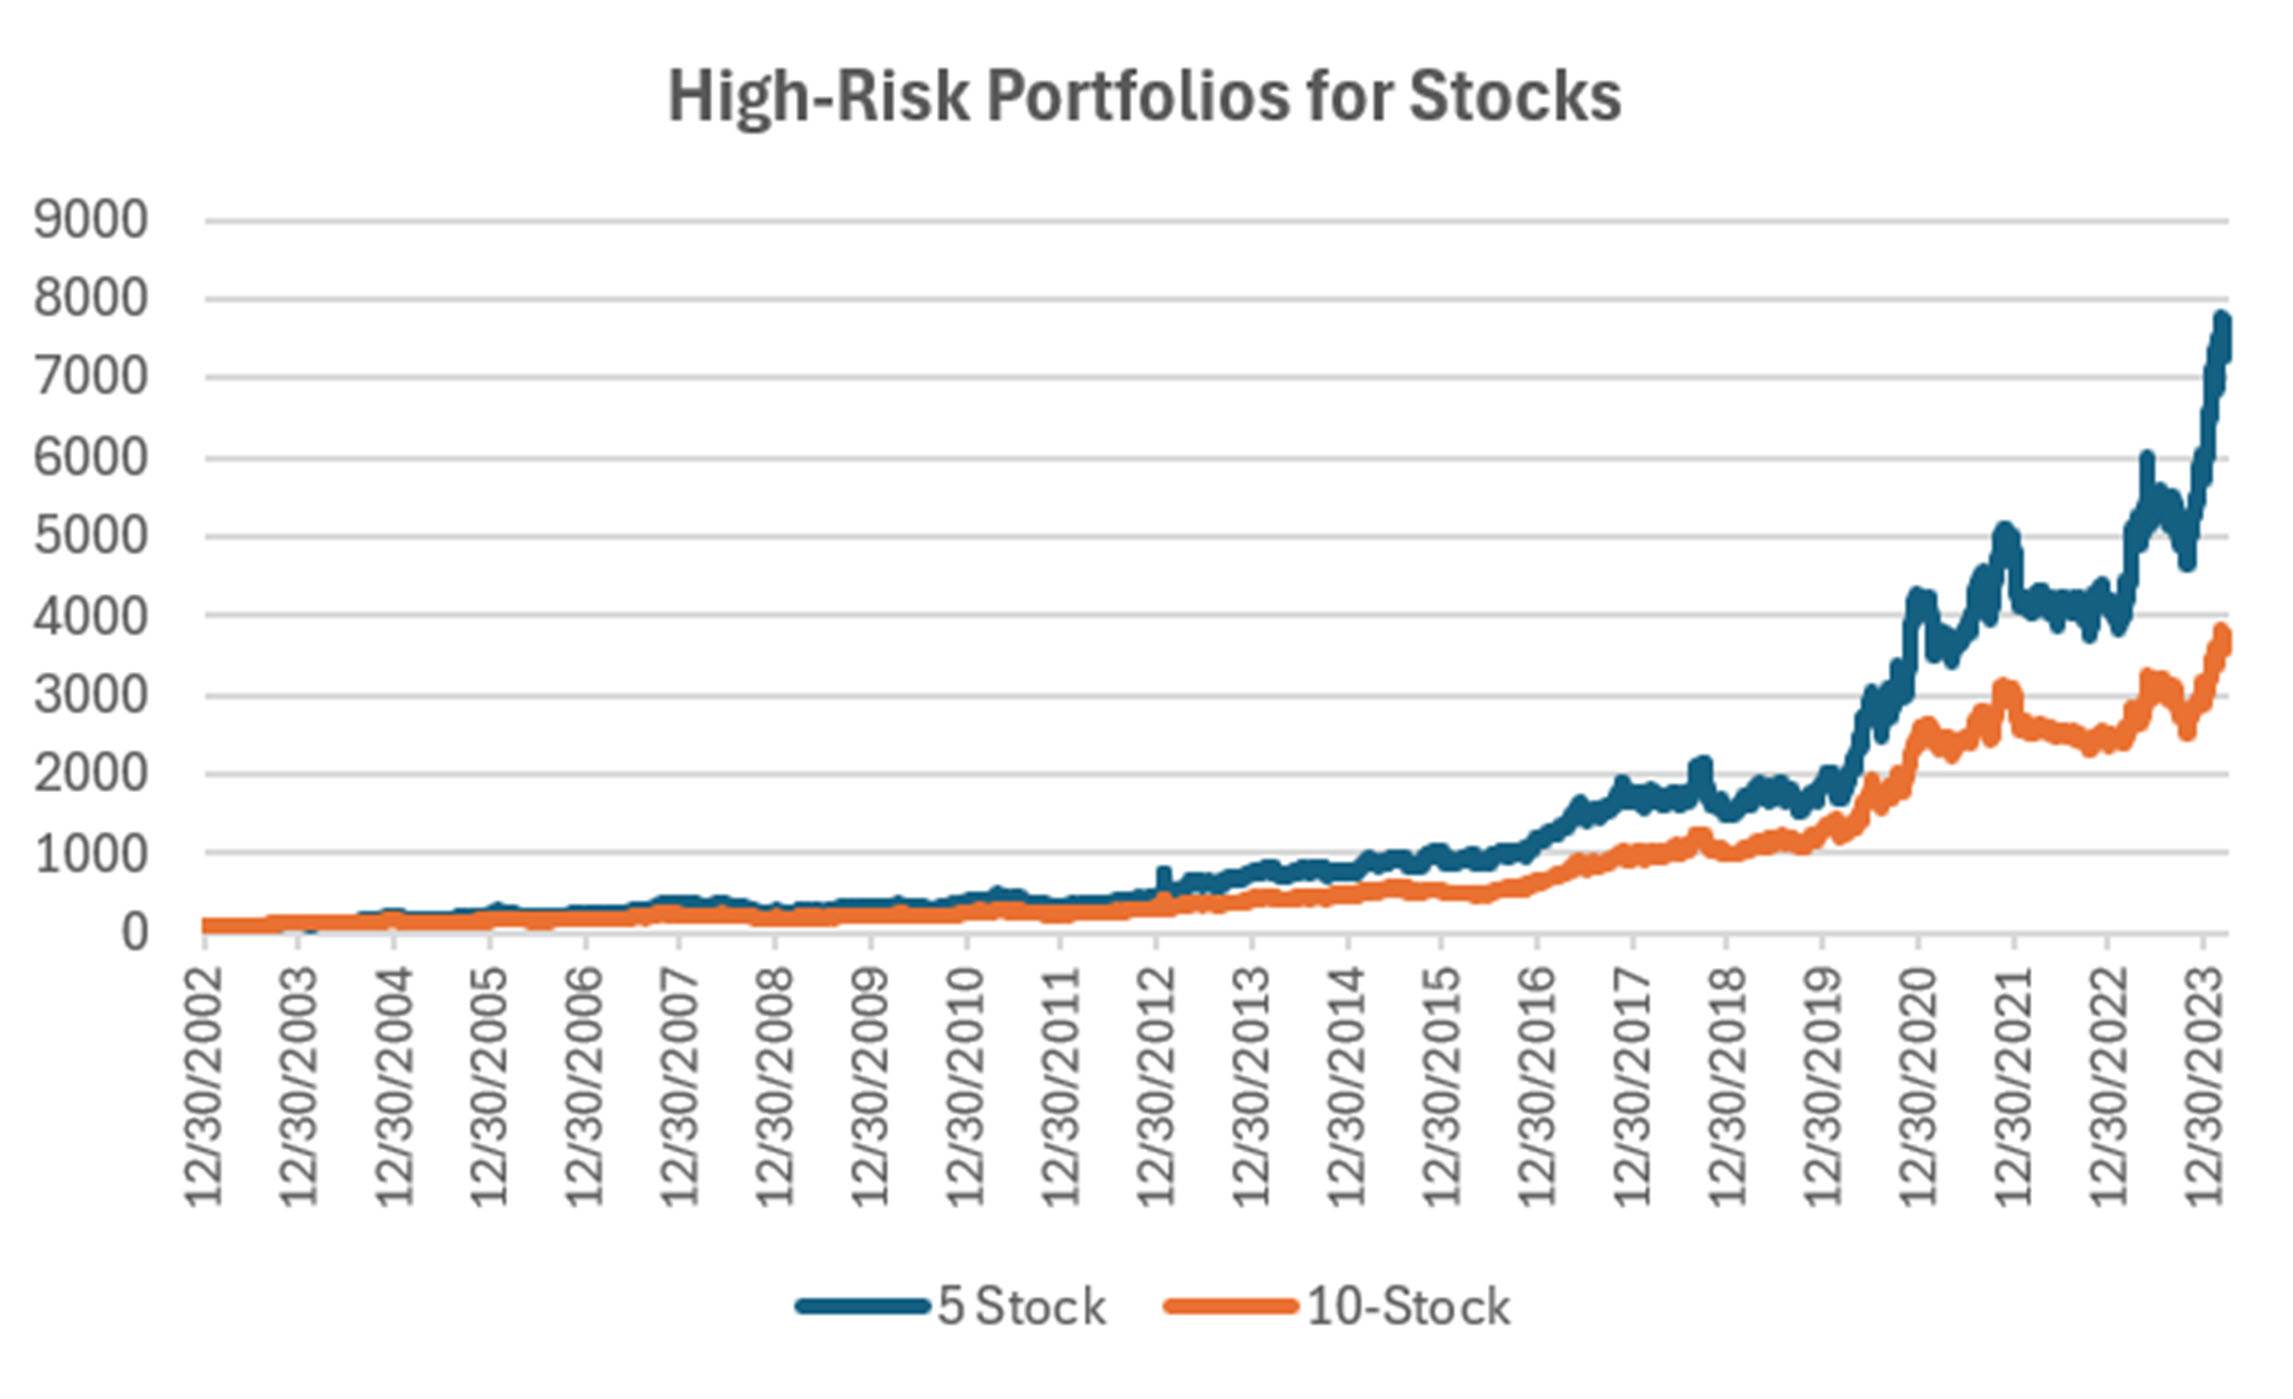
As an aside, our website now posts a “High-Risk” portfolio that includes these stocks as well as semis and healthcare. It shows frequent drawdowns of 20%. Then trading the Magnificent 7 is likely to have drawdowns greater than 20%. High returns come with high risk. Be careful about reading about untold profits without considering the risk.
Robinhood and Social Media
In 2021, Robinhood was in the news. Whether it recommended certain stocks I have no first-hand knowledge. I do know that social networking was enamored with the idea of buying a stock that was heavily shorted by funds, with the idea of damaging those funds. The two that come to mind are AMC (AMC Entertainment) and Gamestop (GME).
“Meme” buyers were successful in the short-term, as shown in Figure 2. Prices rallied sharply, followed by a decline back to the original prices. After all, the rally had nothing to do with earnings, it was just a game. You can see the initial run-up was all at once. I would bet that the “young” investors mostly bought at the top.
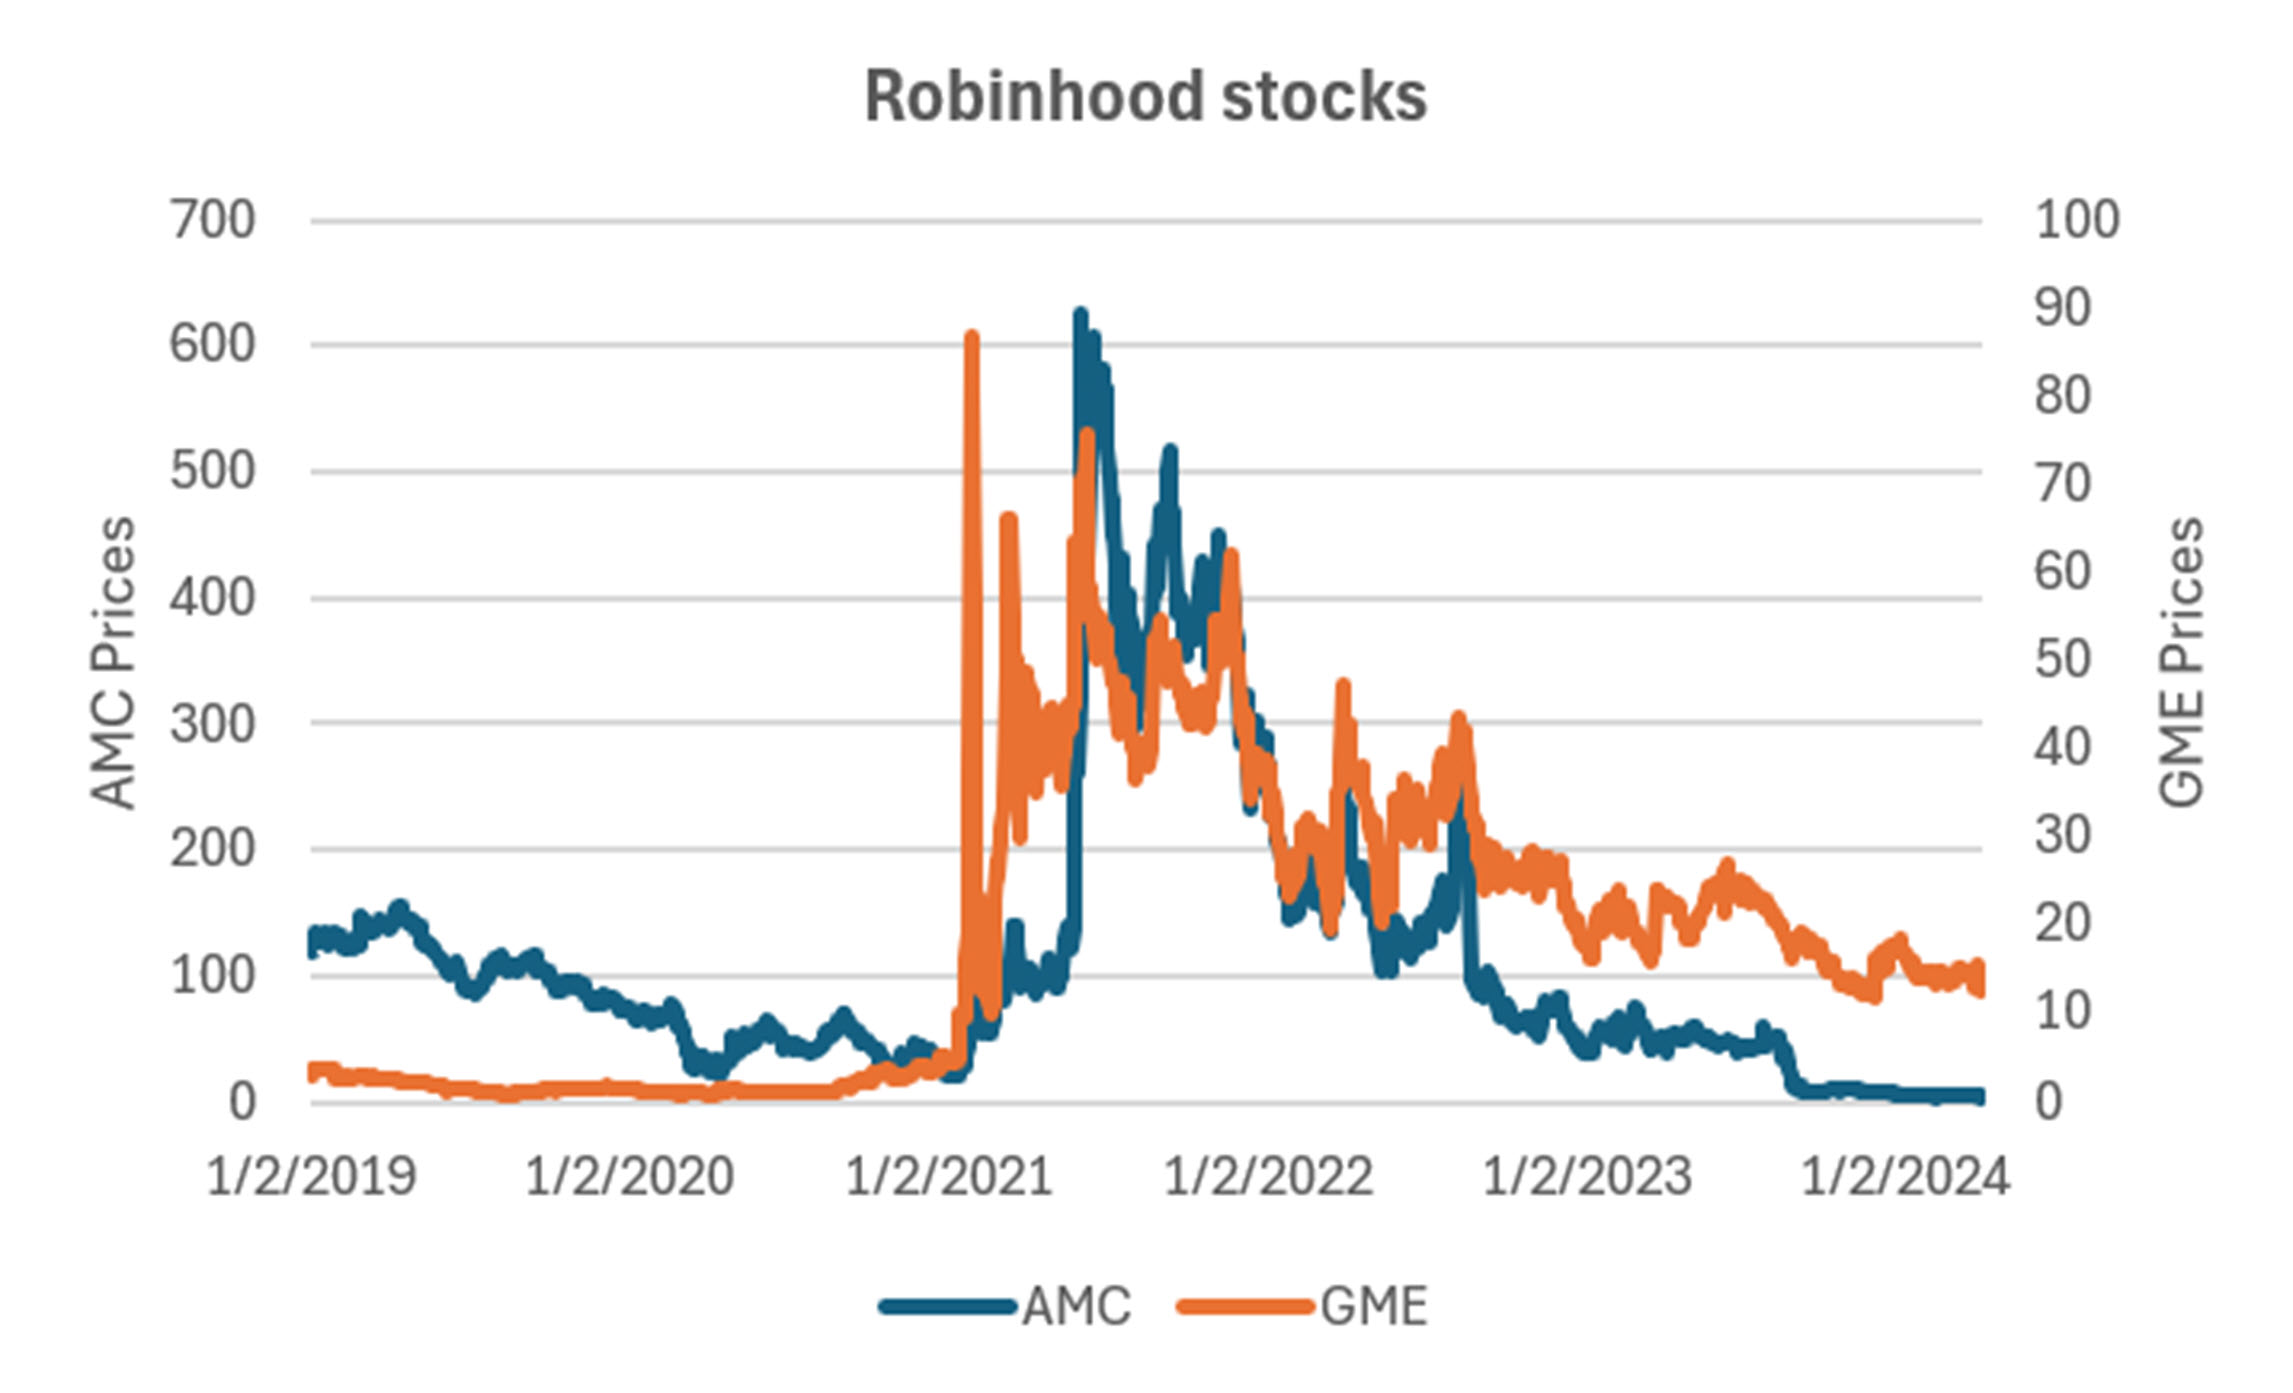
Figure 2. Meme recommended stocks.
As with most news, traders are going to be late to the party, even with the speed of social networking. By the time you get an opportunity to invest, prices have already moved.
I also find it interesting that someone tells you to buy, but no one tells you when to sell.
Think about the news that says JPMorgan has moved stock X from a “hold” to a “buy.” Do you think they are telling you ahead of their own purchases? What about Jim Cramer on “Mad Money.” Or news about Warren Buffet adding to his Apple or Union Pacific holdings. For sure, Warren Buffet’s trading is most likely based on his last SEC quarterly disclosure. Not very timely.
One way to take advantage of a news announcement is to see the effect it has on prices. That’s not always easy. If the stock goes up and the overall market goes down, we can assume the announcement had an effect. At that point the odds favor selling, because all buying is in the market. You might sell the stock and buy the S&P, limiting your risk. If both the stock and the index go up on the news, we have no way of telling the impact on the stock.
Verify
I listen to CNBC at lunch time, the Half-Time Report. There are some good and some curious aspects to it.
Most of the commentators tend to buy “value.” That is, a company stock that has sold off but the fundamentals seem to be sound. They take this as a good opportunity to buy. I have a problem with “value.” It may be true that the company will rally, but we have no idea when. It is likely a poor use of money. Best to wait until the trend turns up, even if you lose a percent or two. if the new uptrend is broken, you have a clear reason to exit. I have had more luck buying stocks on new highs.
A year or more, the Half-Time Report was tracking the performance of the traders. That didn’t last long. While some traders did well, most did not. Given the number of stocks they recommend over a month, they must have a highly diversified portfolio. At best, that tends towards the same returns as the S&P index.
I’m always confused about how traders can buy stocks at lows without ever mentioning how they liquidated stocks in order to free up capital. Caveat emptor.
Trading The News
Every news article has an agenda. Even the writer may not know his/her bias, but it’s there. It can even be in the parts left out, rather than examples. You need to verify every recommendation to see if it satisfies your trading rules and risk. Let’s analyze those statements by asking these questions:
- Are these posts by traders or by someone promoting their own positions, or are they just advertisements?
- How do you take advantage of an “unexpected” event?
- Are the expectations already in the market?
- What type of return can you expect from these events?
- What is the risk? What is the goal? Where do I exit?
What’s In the News Today?
On March 29th, this is what I found on Yahoo/Finance (paraphrased).
- New Inflation reading is good.
- Corporate profits are booming
- On Bloomberg: Powell Reiterates Fed Doesn’t Need to Be In a Hurry to Cut Rates
- Bullish Stocks Narrative Seen Intact After US Inflation Data
- Citi Strategies Downgrade US Tech Stocks as Rally to Broaden
How should we trade these headlines? Buy the index because the economy is doing well, or sell because rates won’t be coming down soon? Buy the tech stocks or sell because they have gotten too high?
Trading DJT
Whether you’re a fan of Trump or not, you may be interested in the price of DJT, the new name for Digital World Acquisition. In many ways it is a meme stock. As far as I can tell, it has reported no income, therefore it would be hard to establish a value. But I admit, it is difficult to make predictions.
Figures 3 and 4 show the price and volume of the stock. If you’re interested in donating to the Trump cause, this is a way to do it. If you’re looking to make money on the stock, it shows all signs of declining. The volume chart shows that buying is short lived. On the other hand, if Trump becomes President, it could surge.
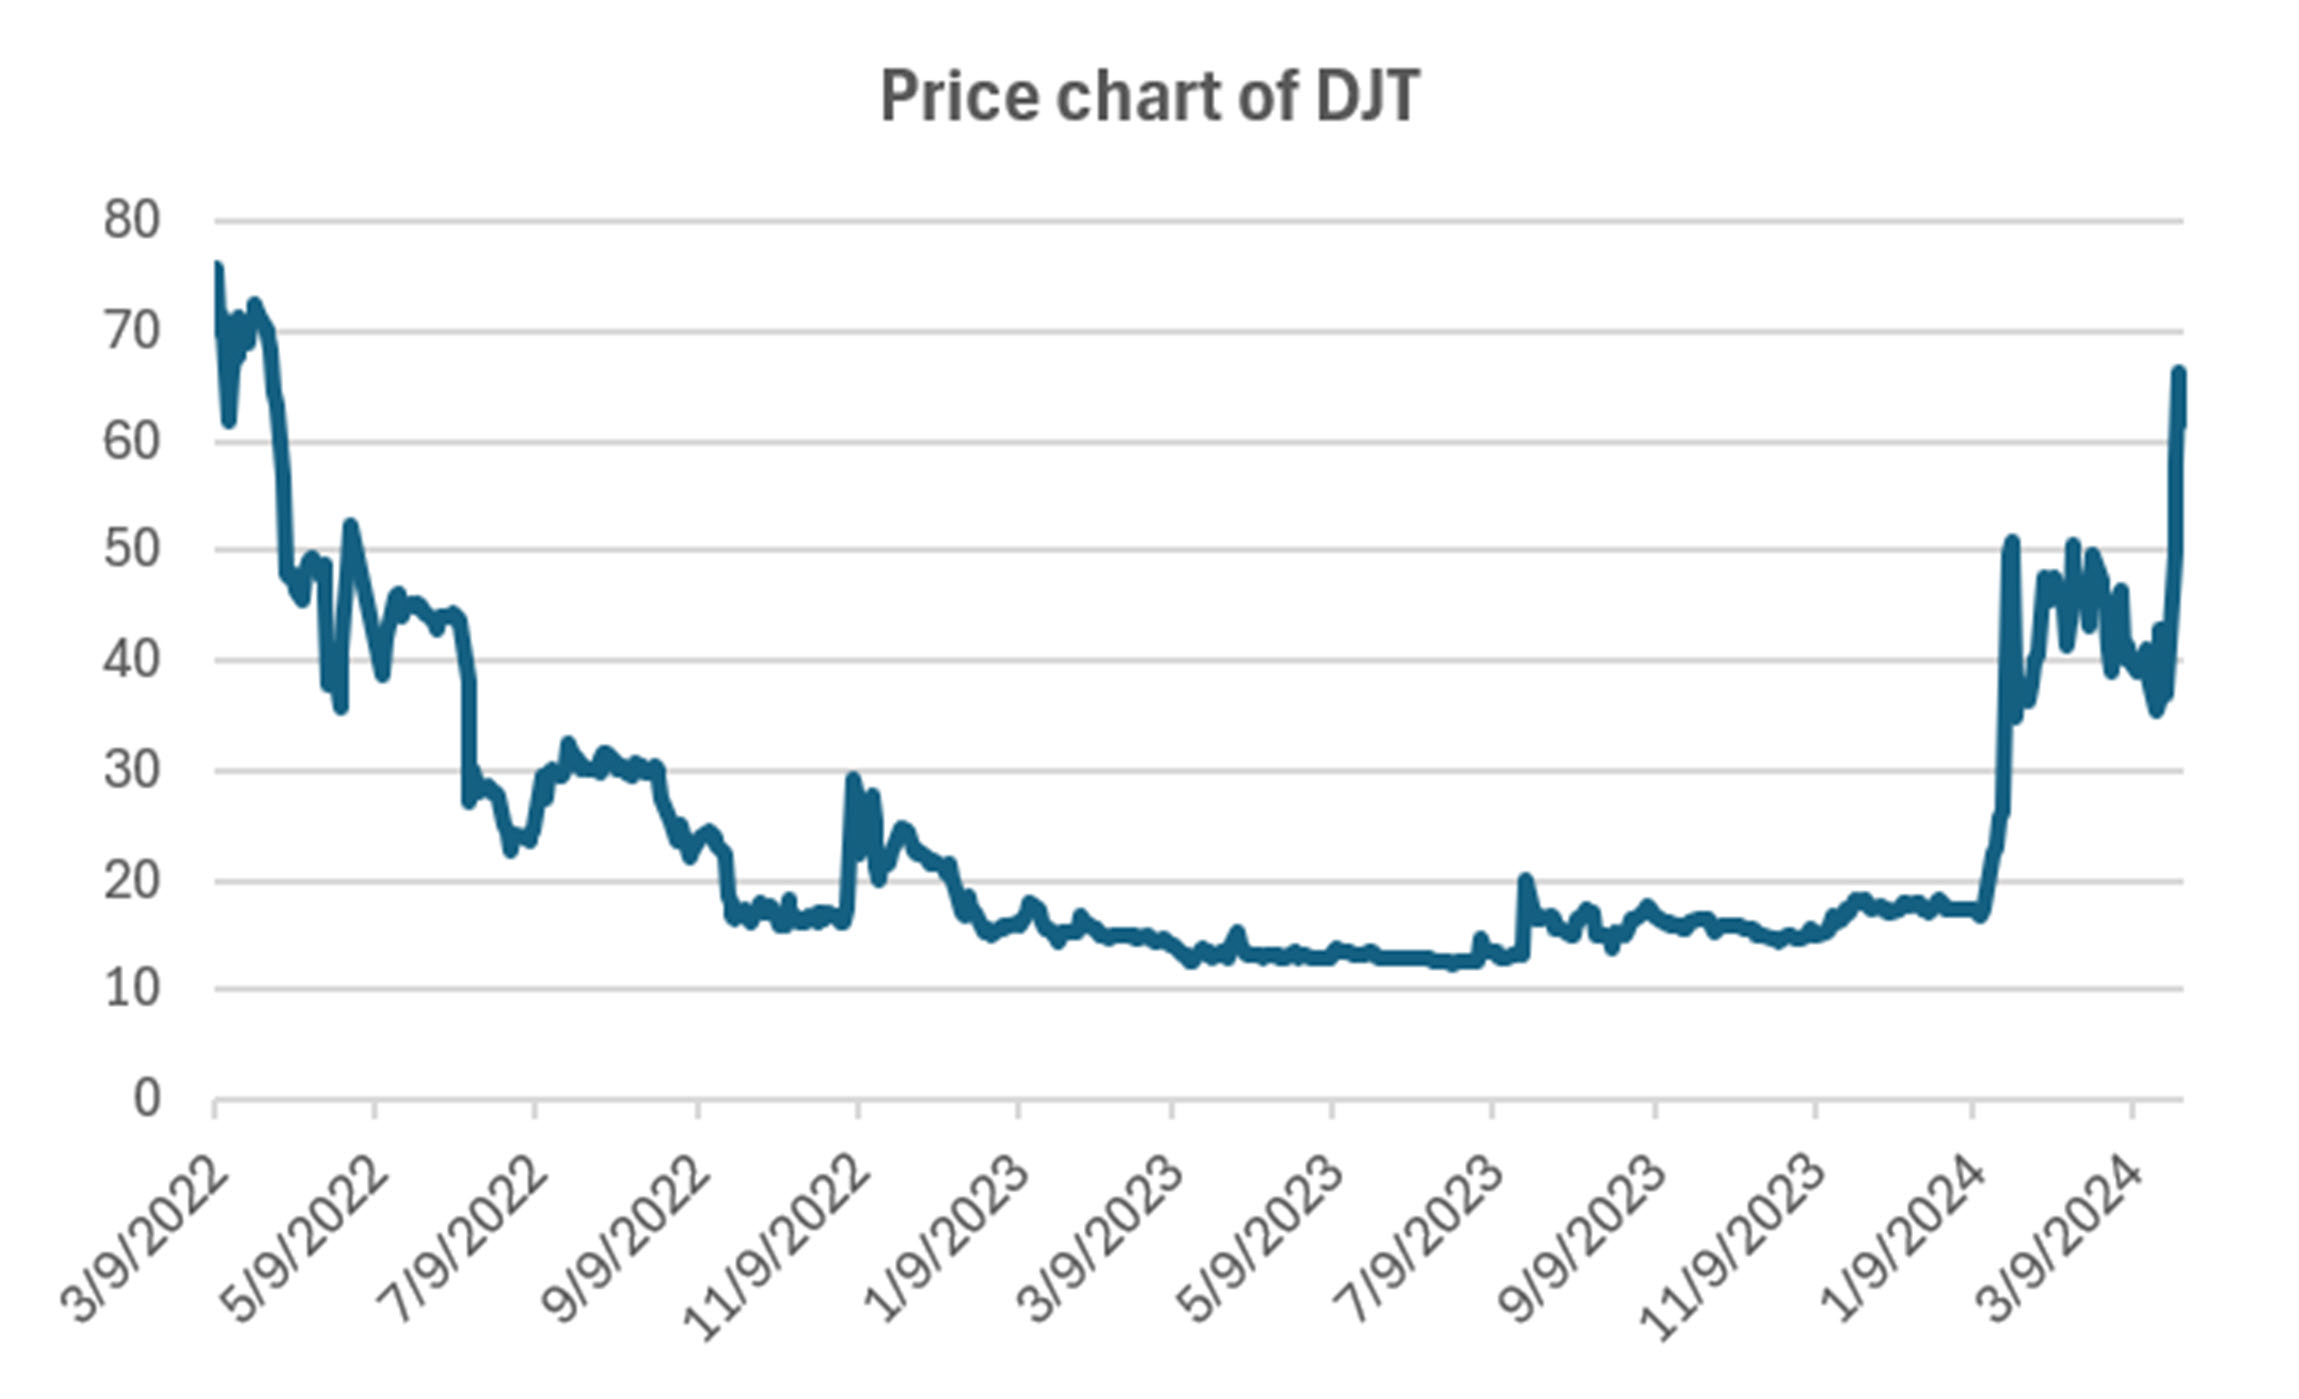
Figure 3. Price chart of DJT through Thursday, March 28.

Figure 4. Volume chart of DJT as of March 28, 2024.
In Figure 3, you can see that the first rally was on the announcement of a merger. If you were able to buy then, you’re in good shape. On the day of the merger, prices open at their highest level. A good time to sell. Buy the rumor, sell the news, works in most cases. Figure 5 shows recent volume.
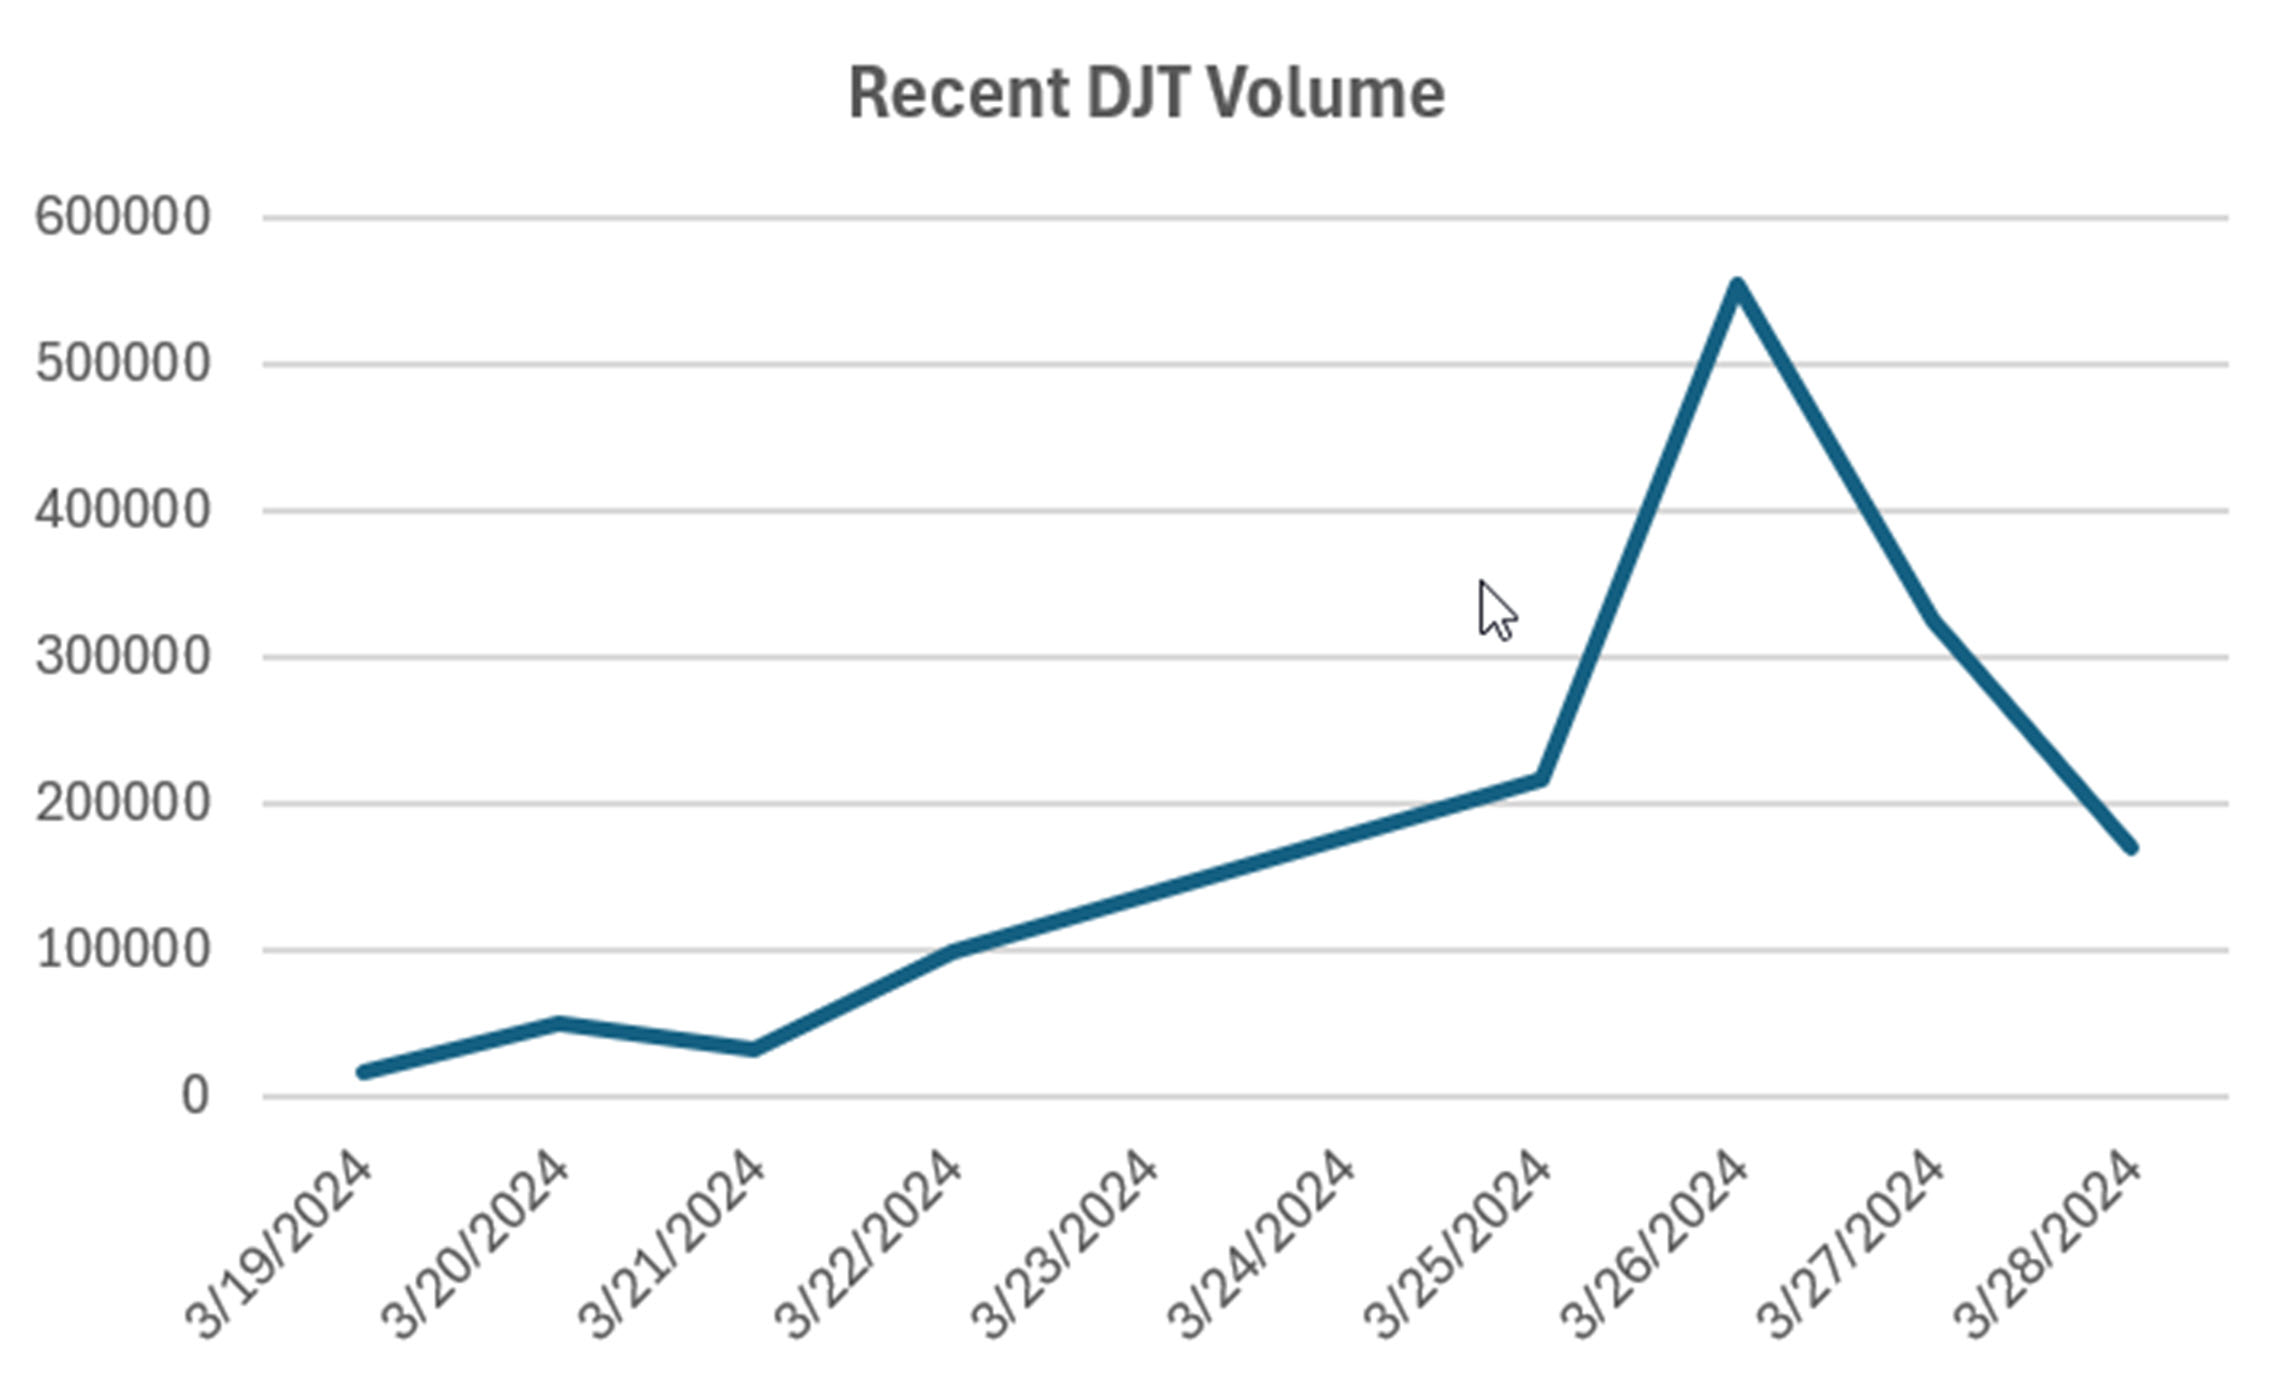
Figure 5. Recent volume of DJT.
Interest Rates
The race to anticipate interest rate cuts has already begun. The headline is “What’s next for mortgage rates?” Are they implying that you should buy interest rate futures (an upwards move means lower rates)?
But other headlines show that the Fed is not anxious to lower rates, so it could be months before we see a substantial decline in rates. Banks are even less likely to lower rates. At the moment, rates have had little movement to the upside.
Figure 6 shows the 10-Year T-Note futures prices. While steady this year, they would need to go above 112 to show that an uptrend has started. You can go long now, but an uptick in inflation could make it a long wait for profits.

Figure 6. T-Note futures from 2024, shows stability but little signs of lower rates.
Timeliness
My own analysis is that news tends to confirm the trend. But there are always exceptions.
Ask yourself “Is the news in the market?” Look to see recent market reactions? If prices ran up ahead of good news, it is probably too late to act. Observe what happens when the news is released. If the market when down, the news was not as good as it seemed. If it did nothing, then the news was unimportant or fully in the market. Form your own way of trading the news from the way the price moves.
Keep in mind that good earnings often follows good earning.
Using some form of trend-following is going to be the best way to separate a poor trade from a good one. Not that it always works, but waiting for the trend to move in your direction gives you an edge. It also gives you a way to exit when you’re wrong. It will make you look at the stock pattern to be sure that the news is correct.
A Standing Note on Short Sales
Note that the “All Signals” reports show short sales in stocks and ETFs, even though short positions are not executed in the equity portfolios. Our work over the years shows that downturns in the stock market are most often short-lived and it is difficult to capture with a longer-term trend. The upwards bias also works against shorter-term systems unless using futures, which allows leverage. Our decision has been to take only long positions in equities and control the risk by exiting many of the portfolios when there is extreme volatility and/or an indication of a severe downturn.
PORTFOLIO METHODOLOGY IN BRIEF
Both equity and futures programs use the same basic portfolio technology. They all exploit the persistence of performance, that is, they seek those markets with good long-term and short-term returns on the specific system, rank them, then choose the best, subject to liquidity, an existing current signal, with limitations on how many can be chosen from each sector. If there are not enough stocks or futures markets that satisfy all the conditions, then the portfolio holds fewer assets. In general, these portfolios are high beta, showing higher returns and higher risk, but have had a history of consistently outperforming the broad market index in all traditional measures.
PERFORMANCE BY GROUP
NOTE that the charts show below represent performance “tracking,” that is, the oldest results since are simulated but the returns from 2013 are the systematic daily performance added day by day. Any changes to the strategies do not affect the past performance, unless noted. The system assumes 100% investment and stocks are executed on the open, futures on the close of the trading day following the signals. From time to time we make logic changes to the strategies and show how the new model performs.
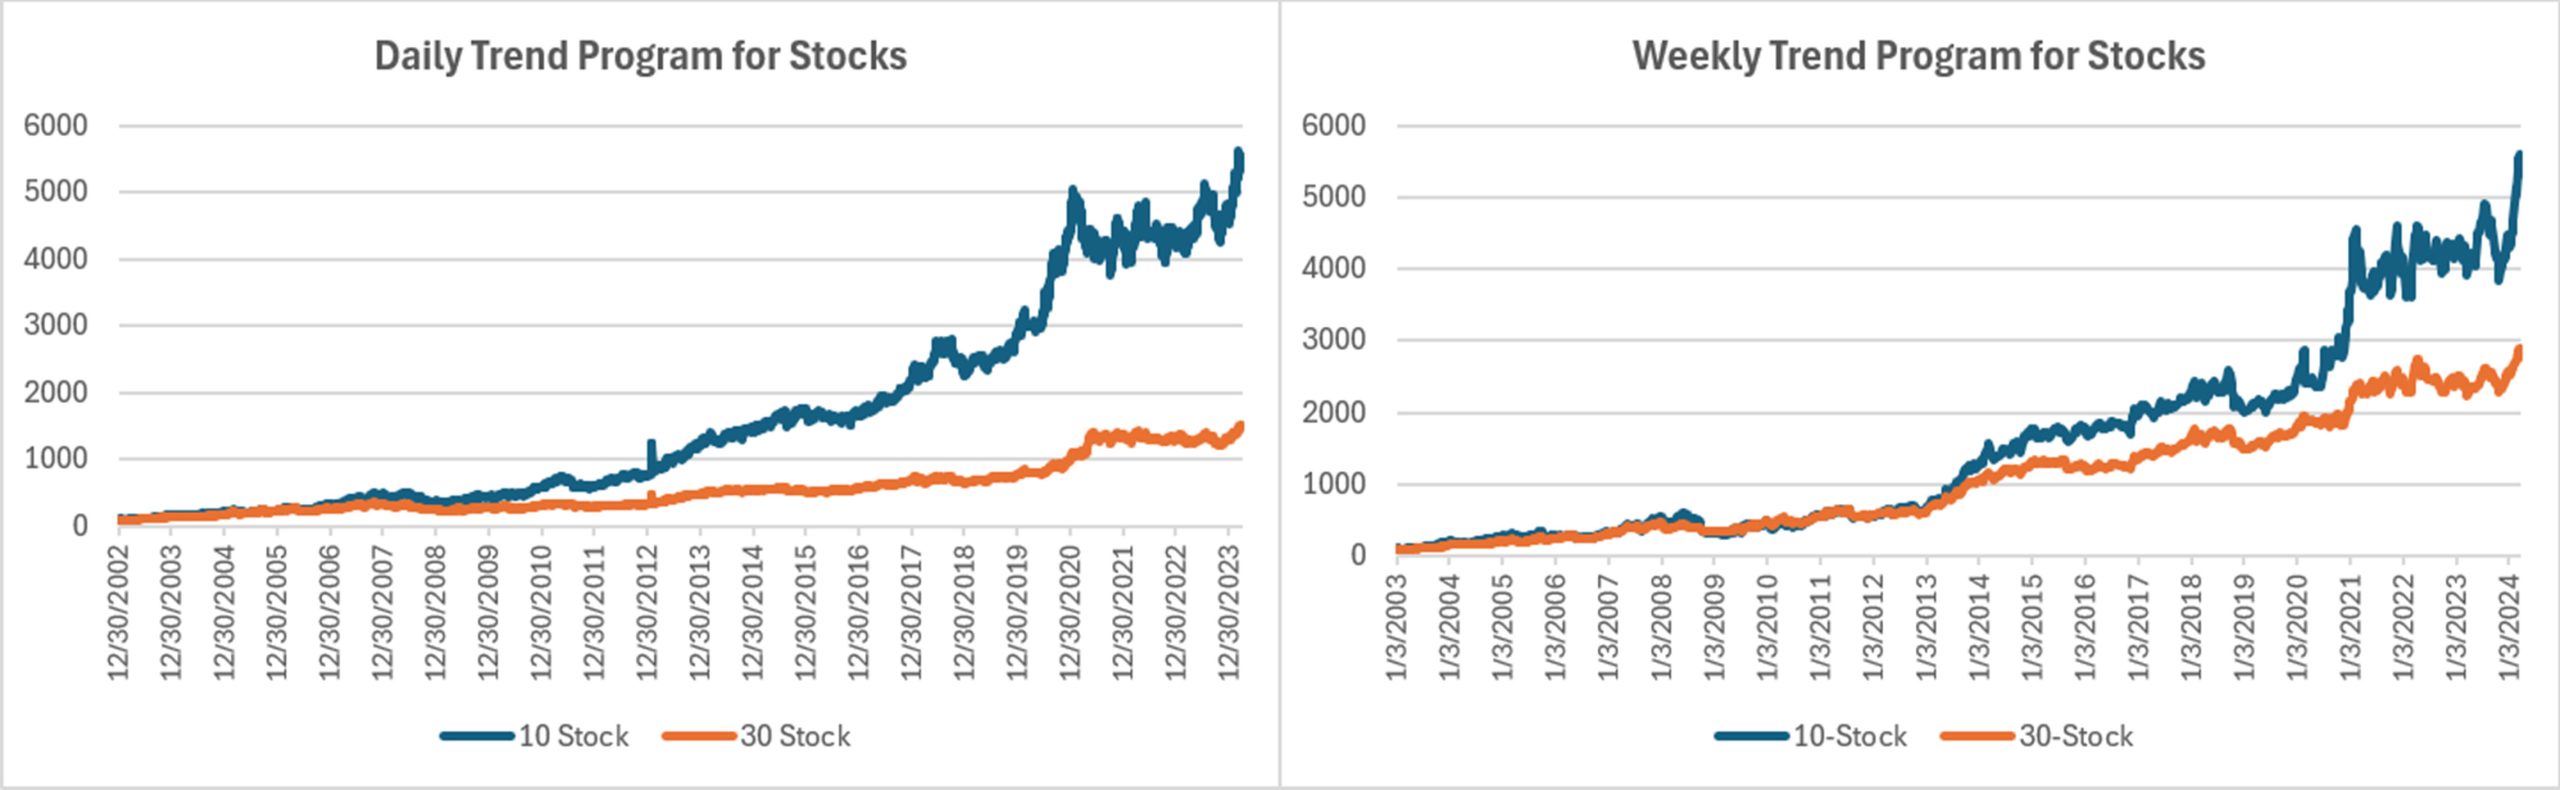
Groups DE1 and WE1: Daily and Weekly Trend Program for Stocks, including Income Focus, DowHedge, Sector Rotation, and the New High-Risk Portfolio
The Trend program seeks long-term directional changes in markets and the portfolios choose stocks that have realized profitable performance over many years combined with good short-term returns. It will hold fewer stocks when they do not meet our condition and exit the entire portfolio when there is extreme risk or a significant downturn.
The Trend portfolios are recovering from a small pullback in the last week of the month, but still ended with a modest gain. In an unusual turn-around, the 30-stock portfolio is doing better than the 10-stock. Normally the diversification limits returns. At the same time, the Weekly program is doing ever better. Not switching stocks so quickly has paid off in March.
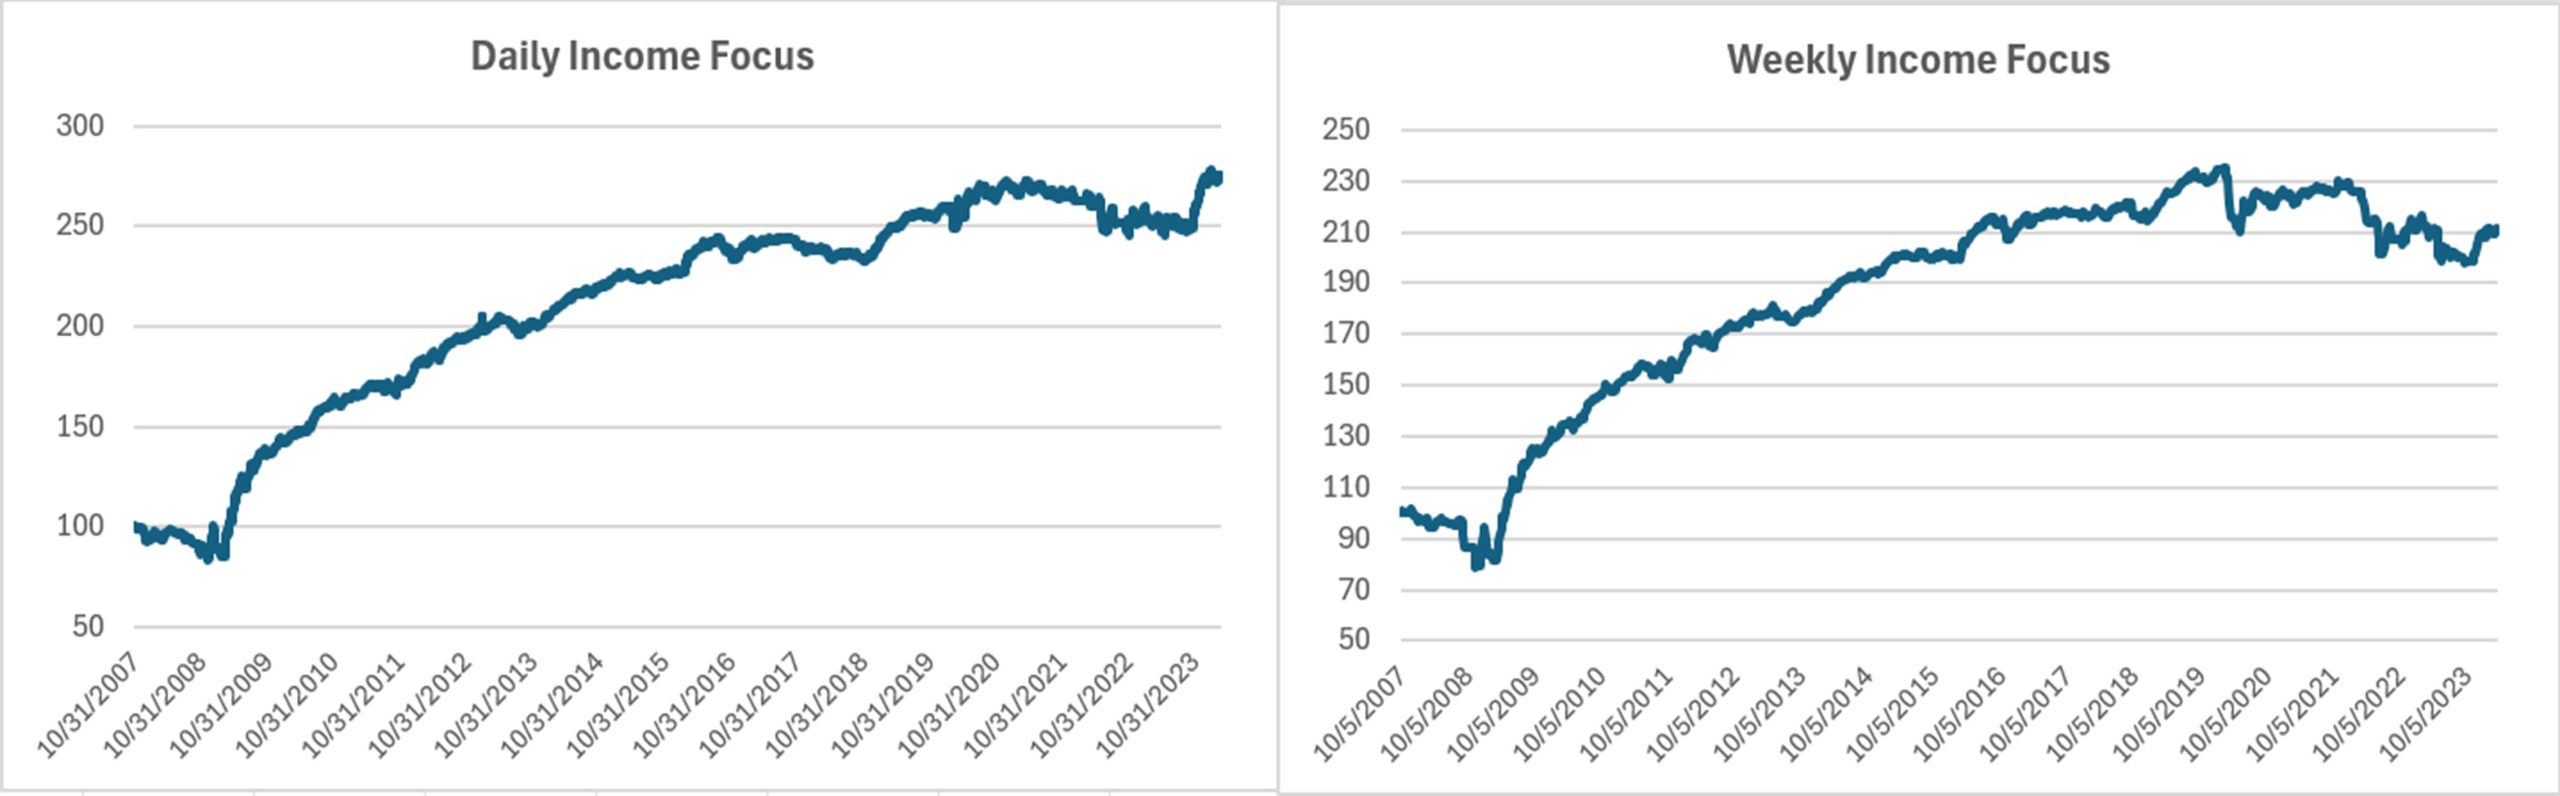
Income Focus and Sector Rotation
Small gains in both the Daily and Weekly Income Focus keeps returns positive. While the Daily Portfolio is doing better, we don’t expect much until rates start to decline.
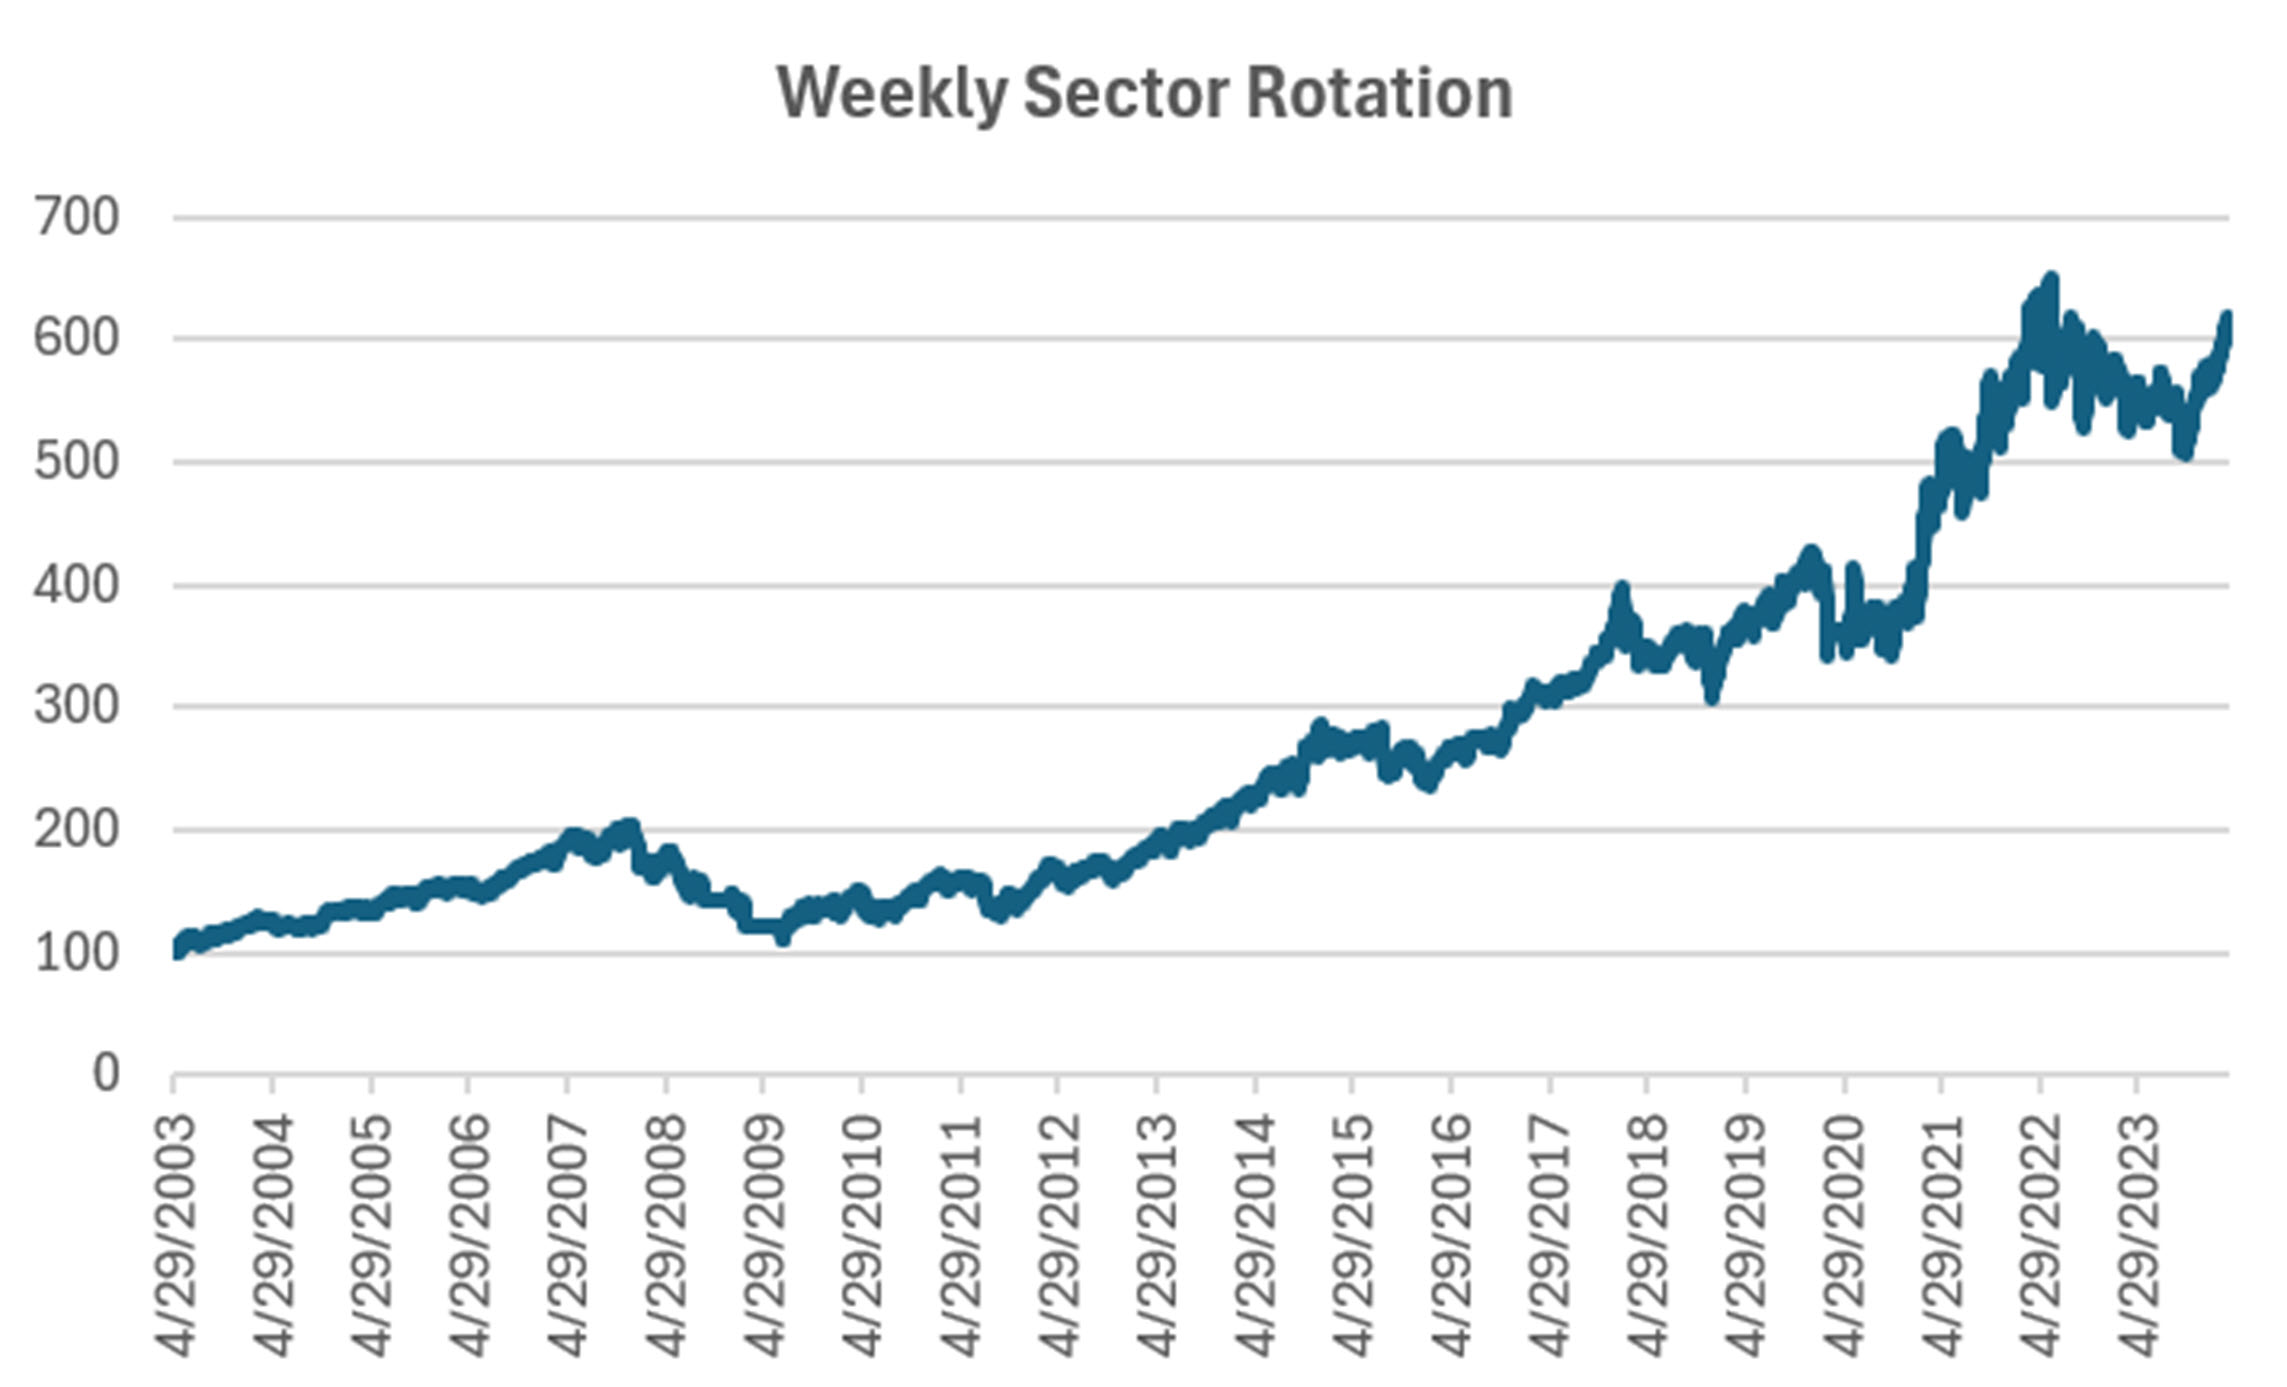
Sector Rotation
A good jump of nearly 5% puts this program back on track, up nearly 9% for the year. It hasn’t changed positions in a long time, so the market is coming to us, rather than we going to the market.
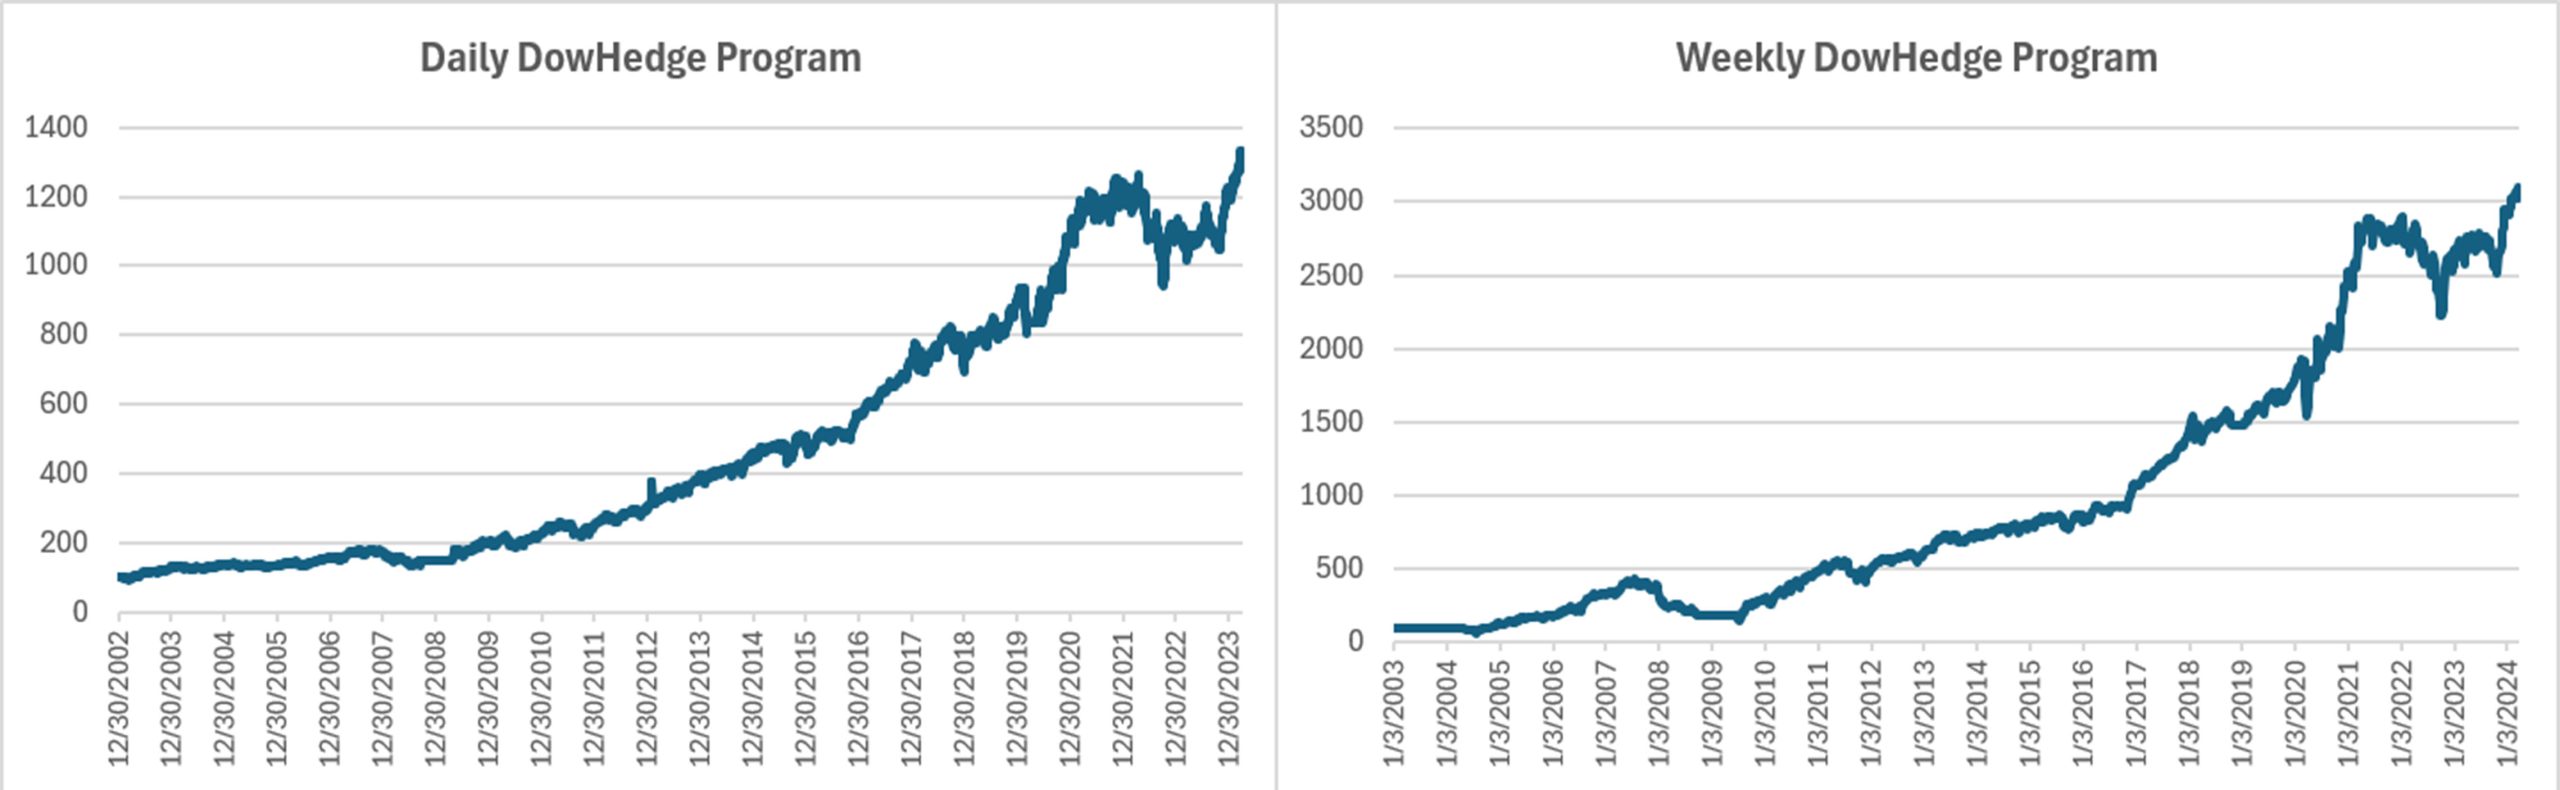
DowHedge Programs
The DowHedge program is keeping track with other Trend models, up 2% to 3.9% for March, and new highs for the program.
The New High-Risk Portfolios
This is the first month of real trading for the High-Risk portfolios. While not as successful as the basic equity Trend portfolio, it was profitable in the face of negative news in the Magnificent 7.
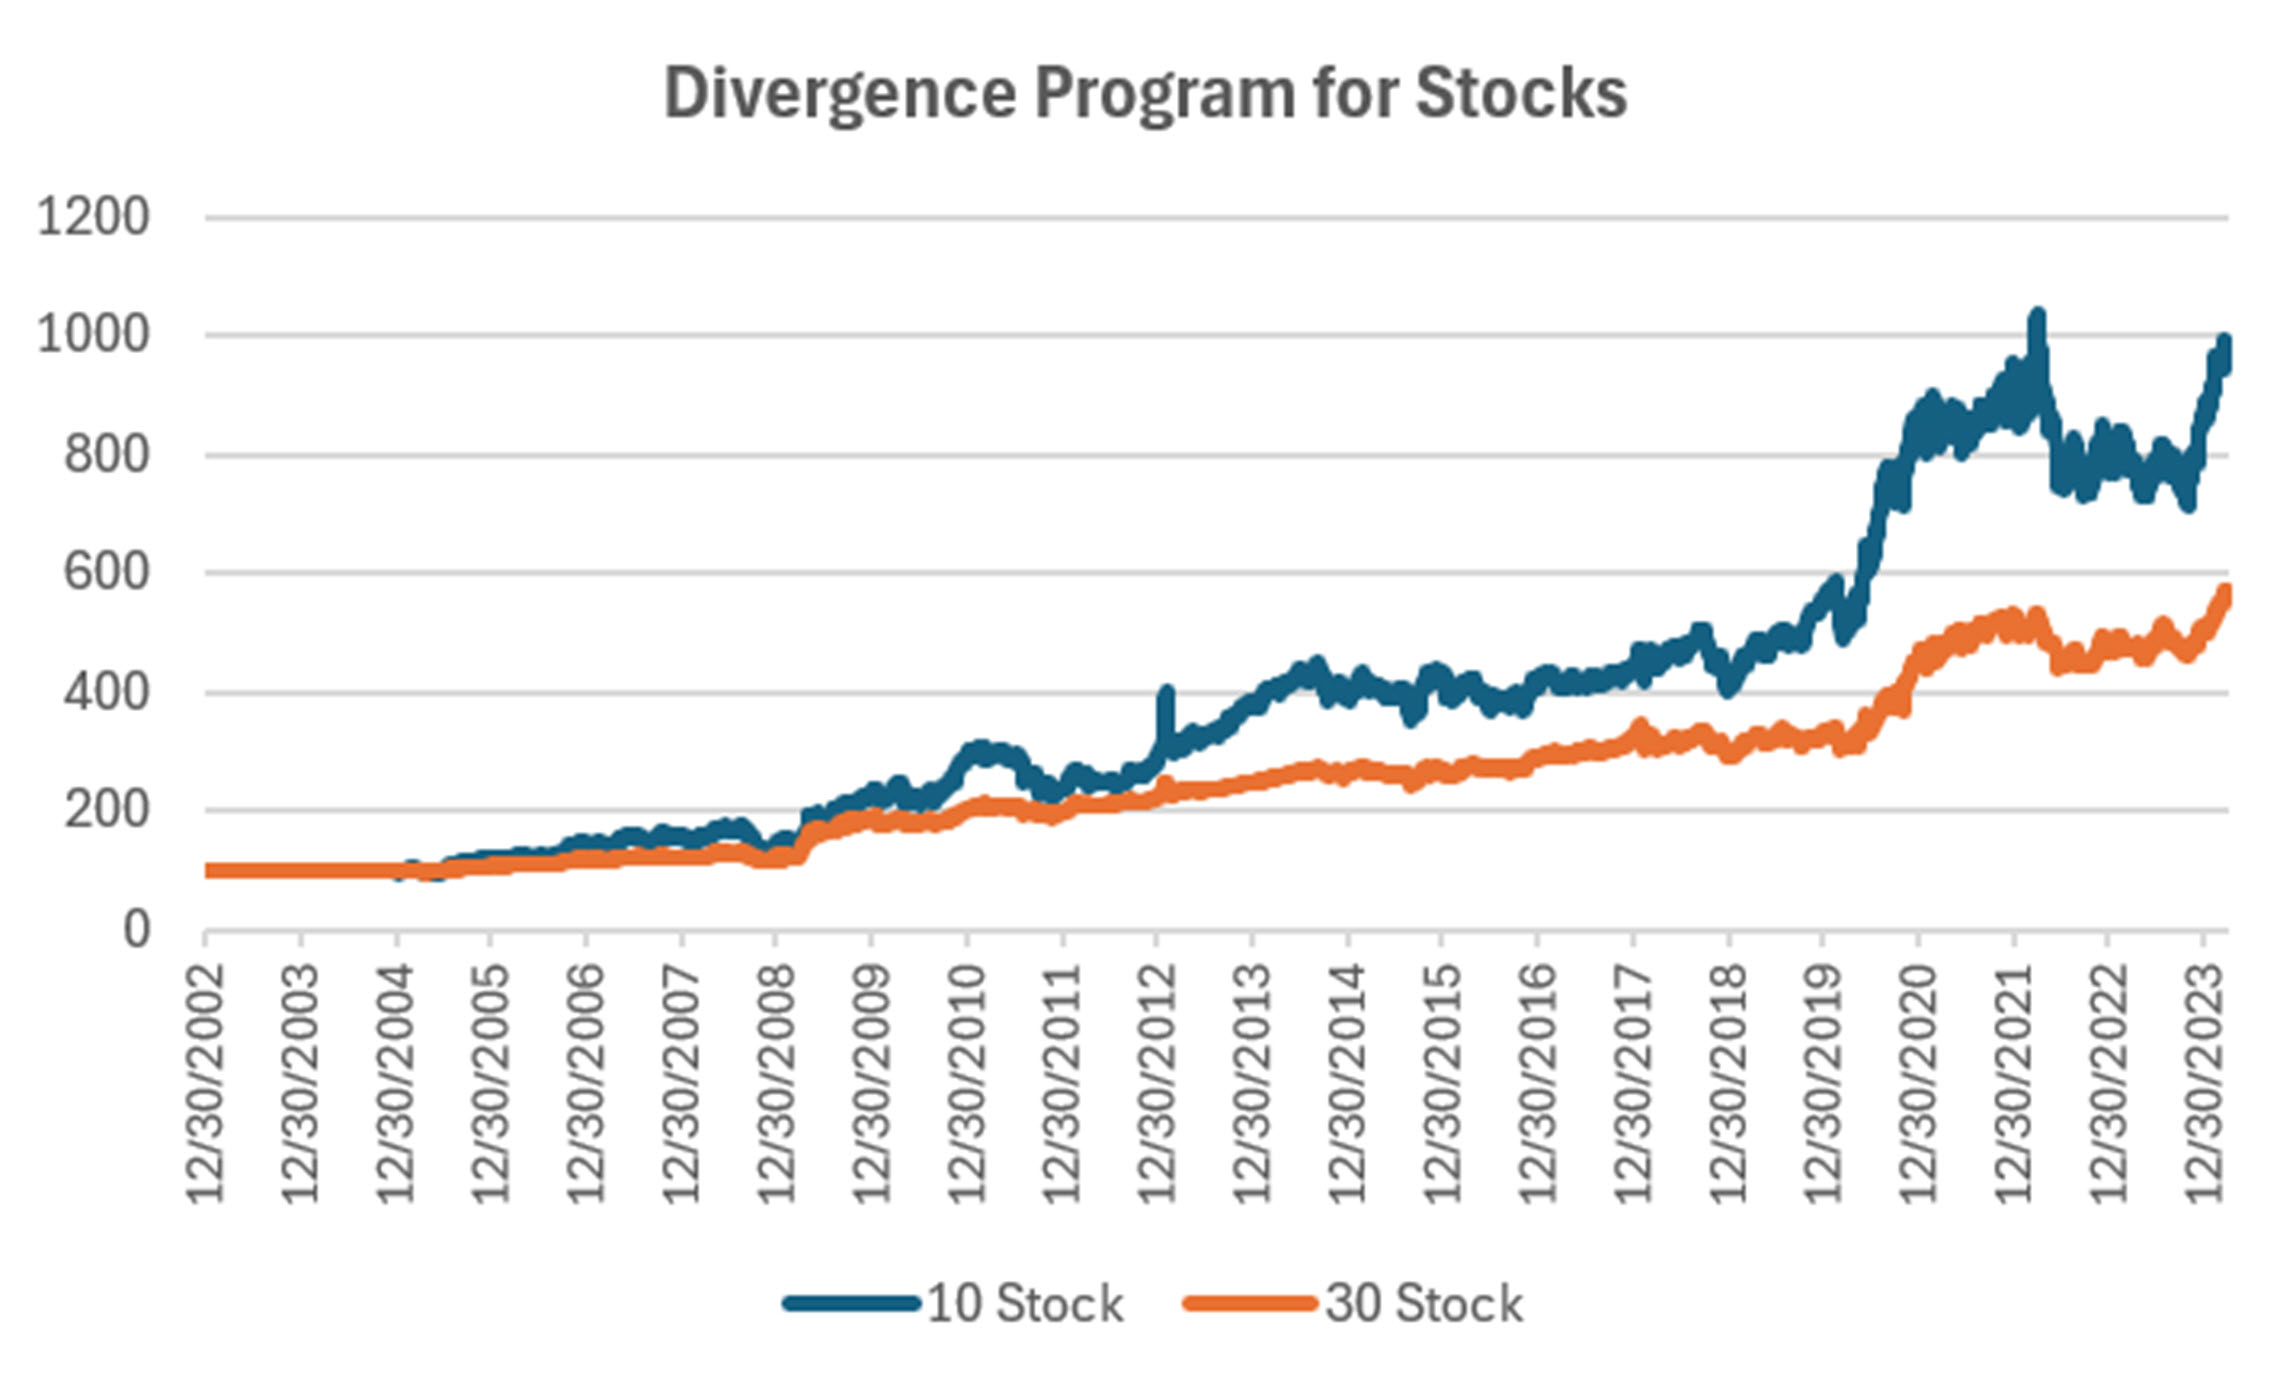
Group DE2: Divergence Program for Stocks
The Divergence program looks for patterns where price and momentum diverge, then takes a position in anticipation of the pattern resolving itself in a predictable direction, often the way prices had moved before the period of uncertainty.
Another gain of 2.5% to 3.5% puts these two portfolios ahead of the S&P for the year. It is a sign that the trend is taking hold.
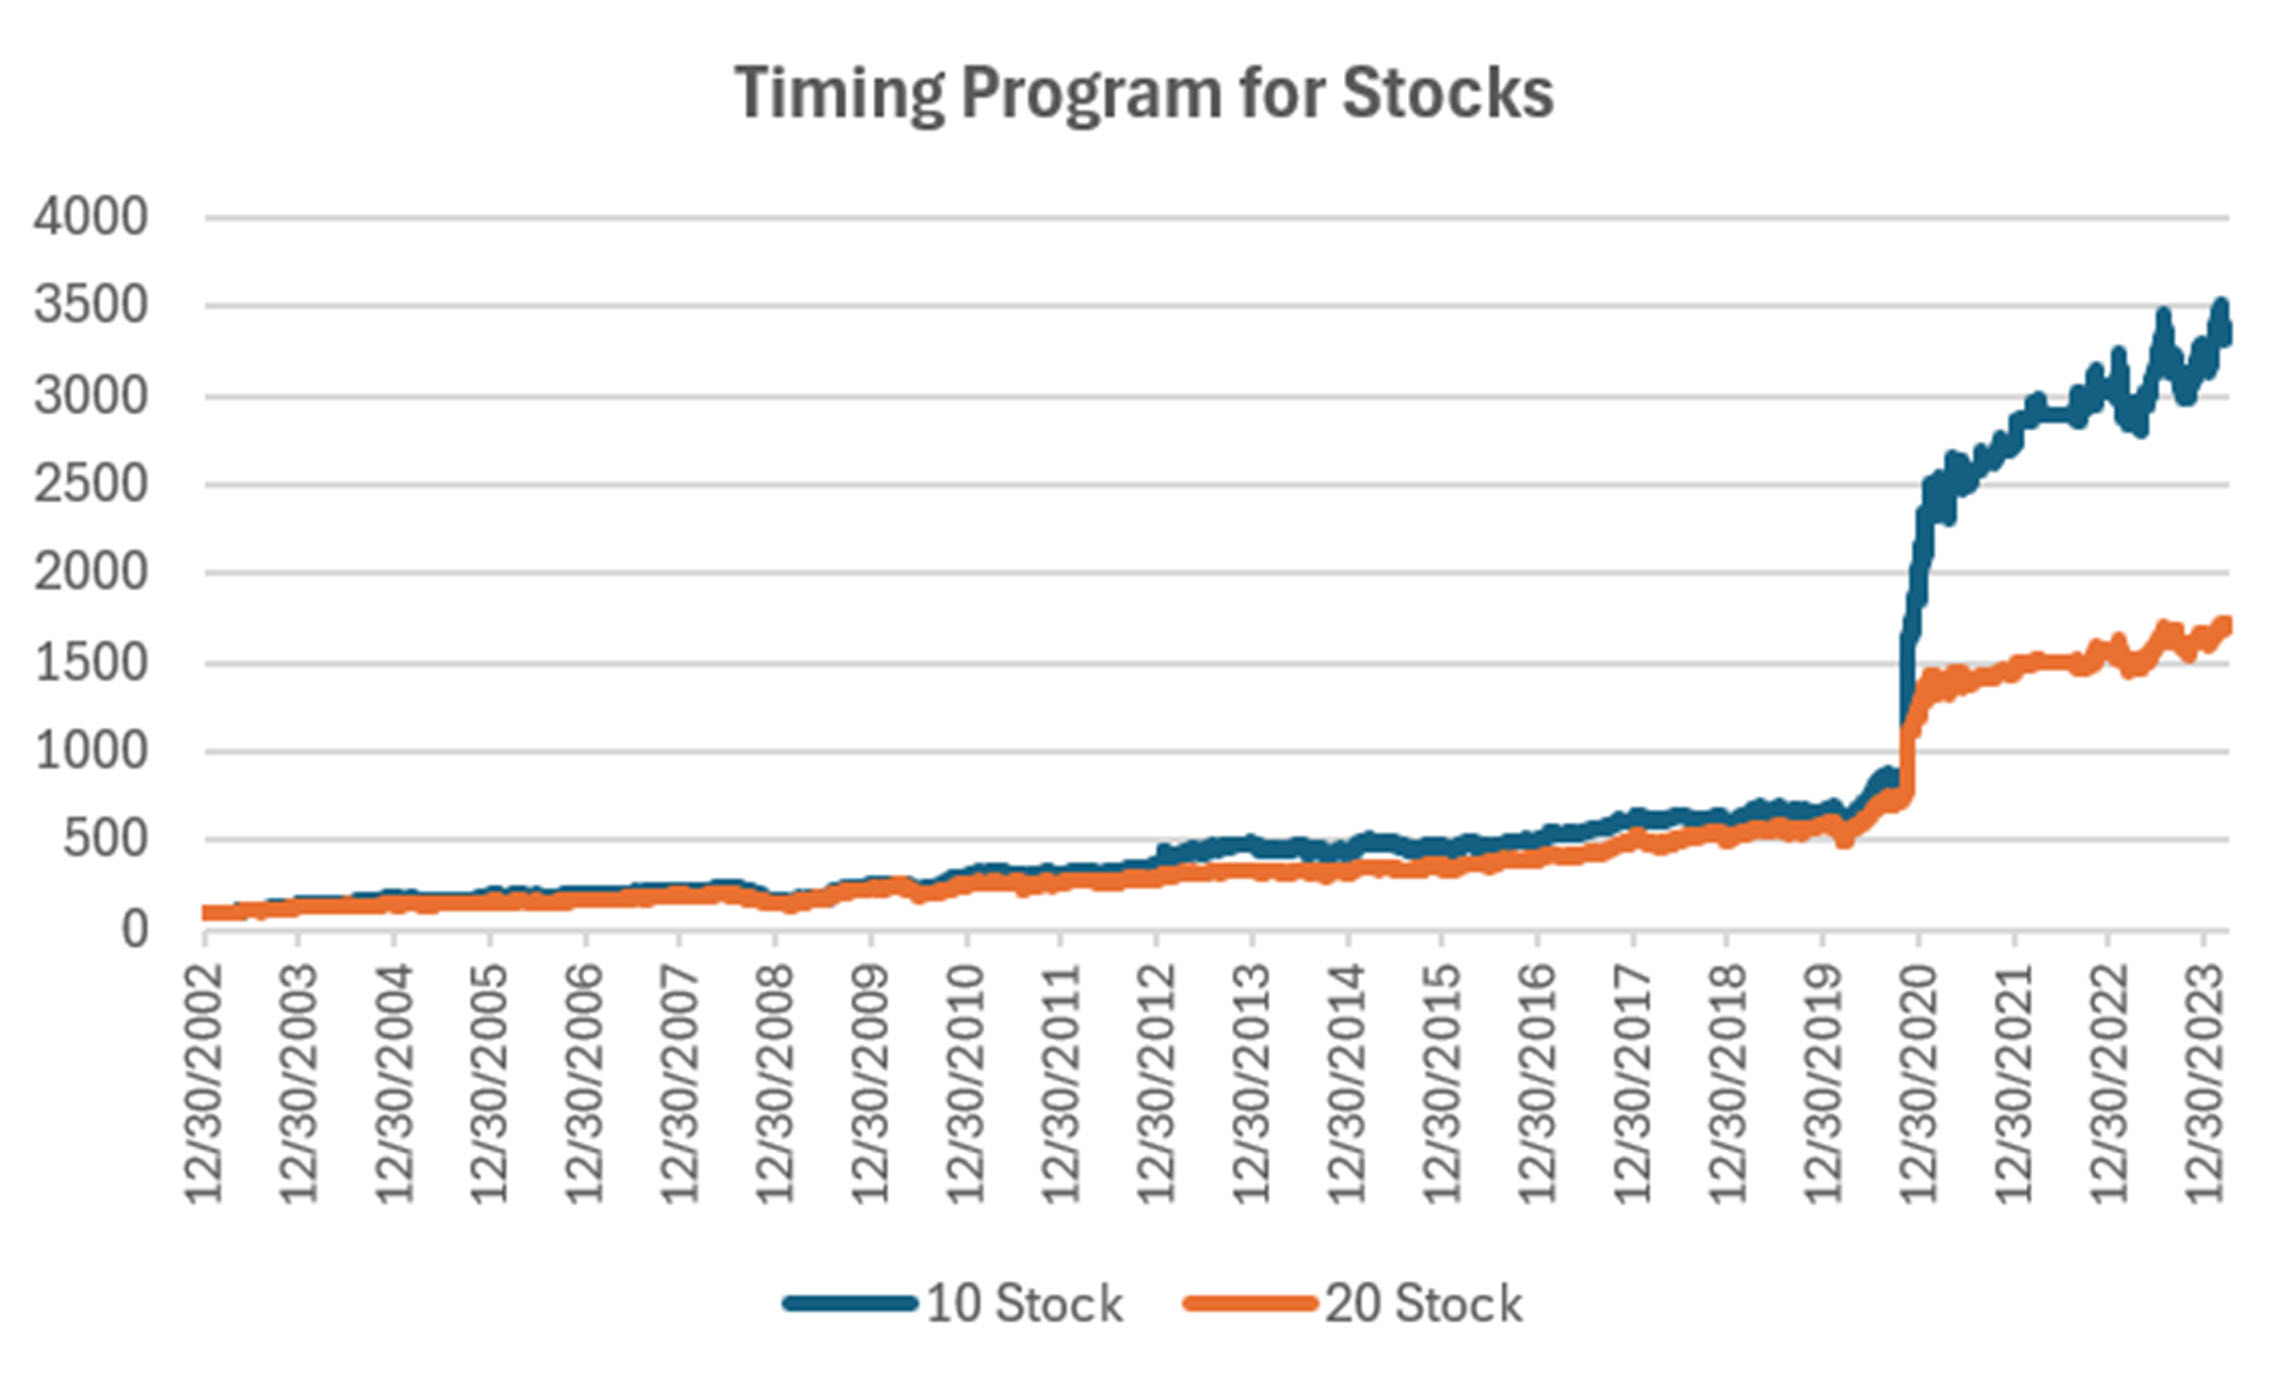
Group DE3: Timing Program for Stocks
The Timing program is a relative-value arbitrage, taking advantage of undervalued stocks relative to its index. It first finds the index that correlates best with a stock, then waits for an oversold indicator within an upwards trend. It exits when the stock price normalizes relative to the index, or the trend turns down. These portfolios are long-only because the upwards bias in stocks and that they are most often used in retirement accounts.
Timing is the only program to have lost money in March, although holding onto gains for the year. This program requires a trend and pullback, which are just this moment showing up. It has a very small drawdown, so we’ll wait for it to catch up.
Futures Programs
Groups DF1 and WF1: Daily and Weekly Trend Programs for Futures
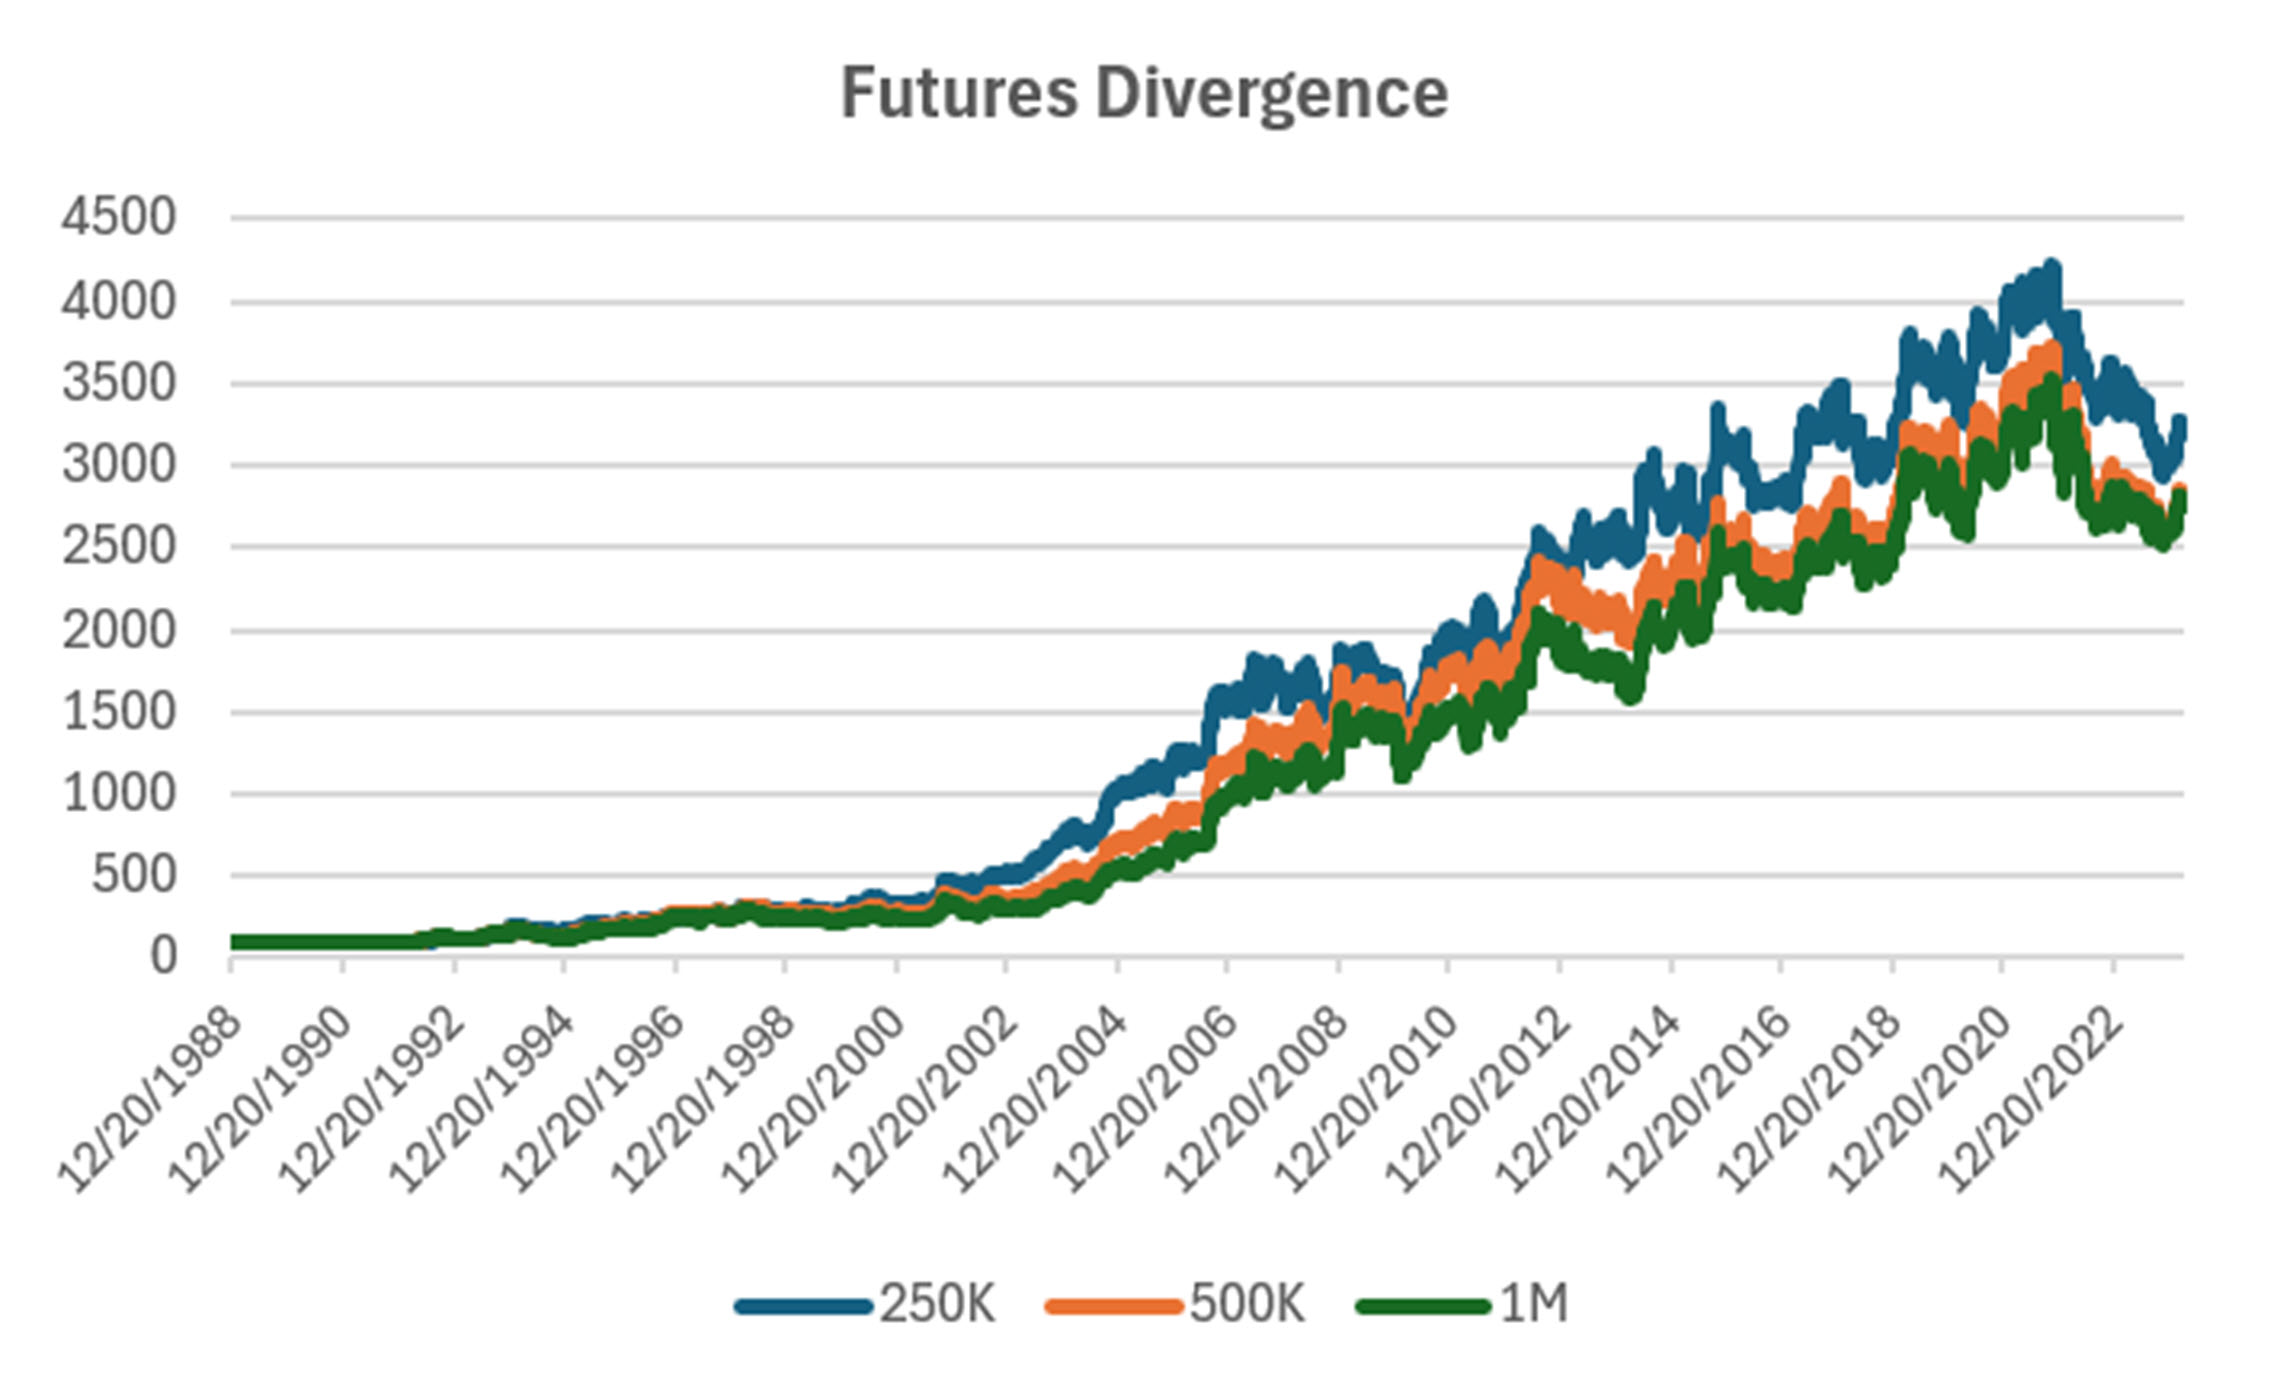
Futures allow both high leverage and true diversification. The larger portfolios, such as $1million, are diversified into both commodities and world index and interest rate markets, in addition to foreign exchange. Its performance is not expected to track the U.S. stock market and is a hedge in every sense because it is uncorrelated. As the portfolio becomes more diversified its returns are more stable.
The leverage available in futures markets allows us to manage the risk in the portfolio, something not possible to the same degree with stocks. This portfolio targets 14% volatility. Investors interested in lower leverage can simply scale down all positions equally in proportion to their volatility preference. Note that these portfolios do not trade Asian futures, which we believe are more difficult for U.S. investors to execute. The “US 250K” portfolio trades only U.S. futures.
Gains of 2% to 6% in the Futures Trend program shows some signs of trendiness in the market. So far, most of the usual markets – interest rates and the dollar – have not been a big help to the program. The index markets have been trending lately, but have not become a large part of the portfolio.

Group DF2: Divergence Portfolio for Futures
Mostly small gains for the Divergence program, but year-to-date of 7% to nearly 14% looks as thought this program may be on track for it’s usual volatile but profitable returns.
Blogs and Recent Publications
Perry’s books are all available on Amazon or through our website, www.kaufmansignals.com.
April 2024
Another article in the April edition of Technical Analysis, “Determining Risk Before It Happens.” Perry thinks this is an article everyone should read.
March 2024
In the 2024 Bonus Issue of Technical Analysis, Perry has an article, “Pros and Cons of Daily Versus Weekly Trend Following.” There is also a quote by him in the “Retrospective: Interviews” going back to April 1988.
Perry also posted an article on Seeking Alpha, “How To Exit a Trade.” A good reminder of the choices.
February 2024
Perry published an article on using the backwardation and contango in crude oil in “The Delta-Delta Strategy.” If not crude, the you might think of this for any commodity, including interest rates, that have a consistent term structure.
January 2024
A new article in February edition of Technical Analysis of Stocks & Commodities, “Crossover Trading: Arbitrating the Physical with the Stock.” A chance at diversification!
Perry posted 3 new articles on Seeking Alpha in December, “Where Do You Take Profits?”, “Is There a Better Day to Enter the Market,” and “Watching January Returns.”
Another article in Technical Analysis of Stocks & Commodities, “Gap Momentum,” another interesting way to identify the trend.
December 2023
Perry posted 3 new articles on Seeking Alpha, “Where Do You Take Profits?”, “Is There a Better Day to Enter the Market,” and “Watching January Returns.”
This month Technical Analysis of Stocks & Commodities published “A Strategy For Trading Seasonal and Non-Seasonal Market.” Turns out that most markets are non-seasonal!
November 2023
Perry posted two articles on Seeking Alpha, “Compression Breakout: Giving a Boost to Your Entries,” and “Volatility: The Second Most Important Indicator.” In addition, he interview Herb Friedman in Technical Analysis of Stocks & Commodities. Herb is a interest rate specialist focusing on low risk investments.
October 2023
In this month’s Technical Analysis of Stocks & Commodities Perry shows how Merger Arb works and how an investor can participate in it. Merger Arb has been the realm of Institutions, but there are opportunities for everyone.
August 2023
Two(!) new articles by Perry in the August issue of Technical Analysis of Stocks & Commodities. The first is a look at how ChatGPT might help traders. It even asks for a computer program to use trend following.
The second article is “Portfolio Risk Dilemma,” where Perry answers the question of whether to let a stock or futures profit run or rebalance, and whether you should do the same for a diversified portfolio.
June 2023
Another article in Technical Analysis, “Protecting Your Wealth While Making a Profit.” It shows that moving money into different world equity markets can take advantage of momentum in both price and exchange rates.
May 2023
A new post on Seeking Alpha, “Profiting From Green Energy – But Not EVs” on May 31. Shows which stocks are best for investing in energy given the moving targets.
Older Items of Interest
On April 18th, 2023 Perry gave a webinar to the Society of Technical Analysts (London) on how to develop and test a successful trading system. Check their website for more details, https://www.technicalanalysts.com..
Perry’s webinar on risk, given to the U.K. Society of Technical Analysts, can be seen using the following link: https://vimeo.com/708691362/04c8fb70ea
For older articles please scan the websites for Technical Analysis of Stocks & Commodities, Modern Trader, Seeking Alpha, ProActive Advisor Magazine, and Forbes. You will also find recorded presentations given by Mr. Kaufman at BetterSystemTrader.com, TalkingTrading.com, FXCM.com, systemtrade.pl, the website for Alex Gerchik, Michael Covel’s website, TrendFollowing.com, and Talking Trading.com.
You will also find up to six months of back copies of our “Close-Up” reports on our website, www.kaufmansignals.com. You can address any questions to perry@kaufmansignalsdaily.com.
© March 2024, Etna Publishing, LLC. All Rights Reserved.