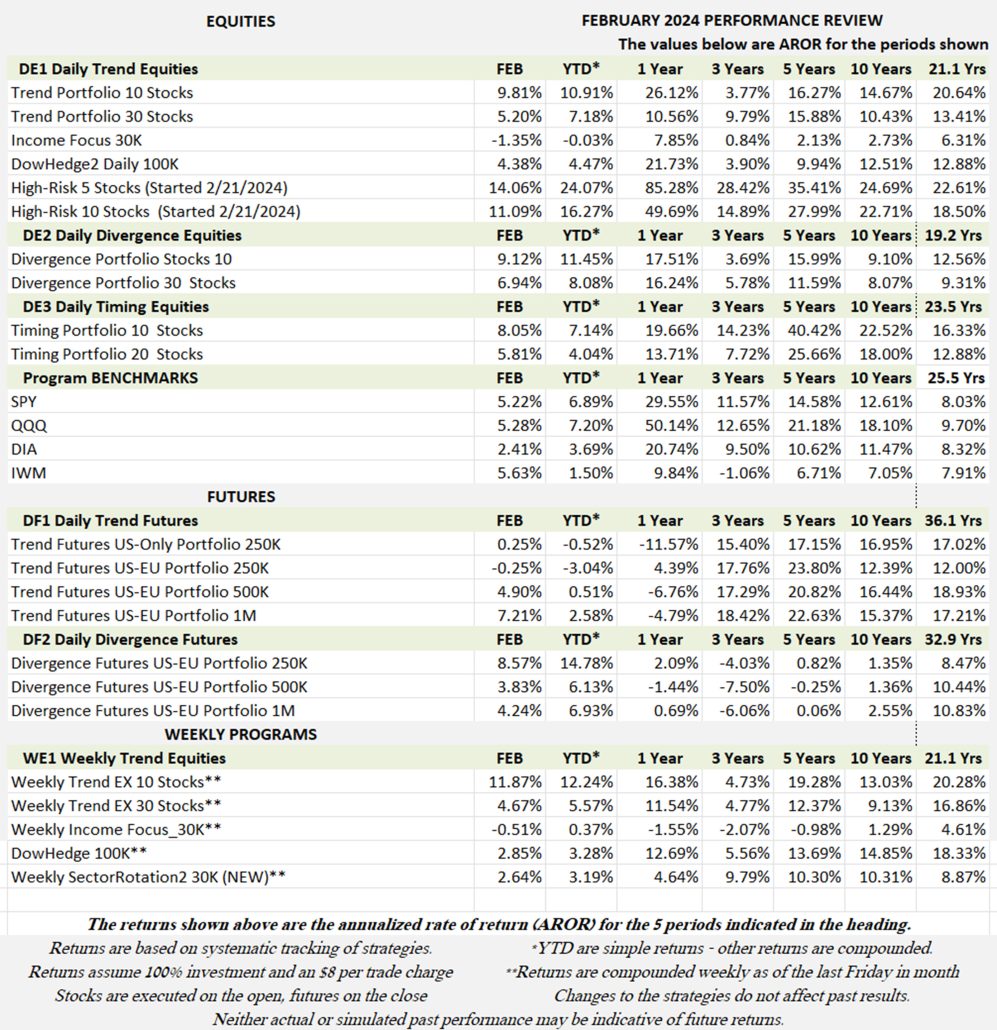
Industry Benchmark Performance
Decent gains in all managed funds in February, with no losses year-to-date. Hedge funds are lagging the S&P 500 and our performance, no doubt due to a smaller allocation to the high-tech stocks.

Kaufman’sMost Popular Books (available on Amazon)
Trading Systems and Methods, 6th Edition. The complete guide to trading systems, with more than 250 programs and spreadsheets. The most important book for a system developer.
Kaufman Constructs Trading Systems. A step-by-step manual on how to develop, test, and trade an algorithmic system.
Learn To Trade. Written for both serious beginners and practiced traders, this book includes chart formations, trends, indicators, trading rules, risk, and portfolio management. You can find it in color on Amazon.
You can also find these books on our website, www.kaufmansignals.com.
Blogs and Recent Publications
Find Mr. Kaufman’s other recent publications and seminars at the end of this report. We post new interviews, seminars, and reference new articles by Mr. Kaufman each month.
February Performance in Brief
It looks as though traders don’t care whether the Fed lowers rates. Not only are AI and semis surging, but the gains are broadening out in the whole S&P.
Most of our programs beat the S&P by nearly double, no doubt because we were concentrated in the high-tech stocks. Only futures are quiet, waiting for interest rates to actually fall, driving FX the dollar lower and the stock market higher.
All Major Equity ETFs have made new highs, despite the Fed’s reluctance to give a date to lowering rates. Of course, Nasdaq have been the driver, as it has for the past year or more. The gains in the S&P are also driven by the stocks that are both in Nasdaq 100 and the S&P 500. Only the Russell doesn’t share the benefit.
Major Equity ETFs
The DOW adds Amazon and removes Walmart, so it might perform as bit more like the S&P. While the index is still rising, it is well off Nasdaq’s performance.

CLOSE-UP: Our New Portfolio:
Technology and Healthcare: High Risk – High Return
This program is for traders who believe that technology and healthcare are likely to continue to be the best sectors in the stock market. We are including two portfolios, 5 stocks and 10 stocks in our DE1 subscription (Daily Trend).
Make no mistake, because of the narrow scope and few stocks in the portfolio, this program has high risk. On the other hand, our tests show it has an outstanding return on capital.
The program uses the same Trend system and stock selection as our other trend portfolio, only the candidate stocks are limited to 71 stocks in both technology and healthcare. We tested the stocks from 2002, but not all technology stocks go back that far, so early returns may not reflect the whole picture.
Please note that this program went live on February 21, 2024. It is new. It uses the same strategy as our Trend systems, but as we know about the market, returns and risk can always be higher than in the past.
Performance Profile
The two tables below show the results of our testing. On the left is the 5-stock portfolio; on the right is the 10-stock portfolio, each stock trading $10,000. Our tests shows that the 5-stock portfolio has higher return and a better “payout.” That is, the return to risk ratio is better (see the lower line).
But there is always the fact that a smaller portfolio has less diversification and higher risk. While the returns are better, the risk (line 2) is also higher.


Tables 1 and 2. Performance profile. Top 5 stocks, bottom 10 stocks.
The two charts below show the history of our tests. While the 5-stock has had smaller drawdowns, we expect that large drawdowns will occur in each portfolio.

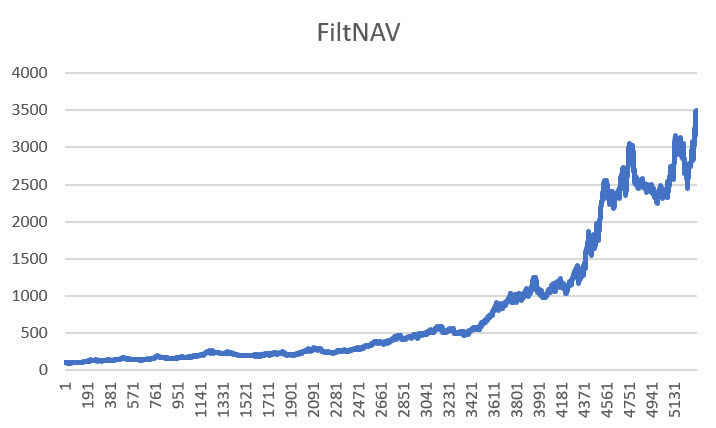
Charts 1 and 2. Returns of both 5- and 10-stock portfolios. Top 5-stocks, bottom 10 stocks.
Drawdowns
Looking at a history of the drawdowns, we see that the 5-stock has larger drawdowns due to its lack of diversification. It will often hold all artificial intelligence or semiconductor stocks or all healthcare (during Covid), only to suffer a reversal in the entire portfolio. In the charts below, you can see that the 10-stock has overall lower drawdowns. However, both drawdowns are quite large for a risk-averse trader or those who don’t sleep well during a drawdown.
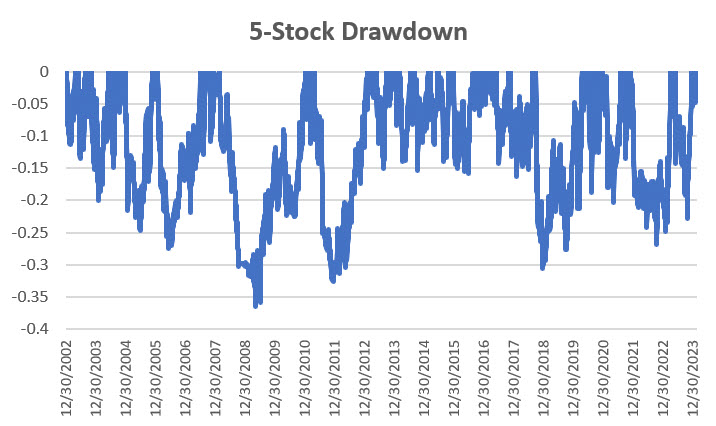
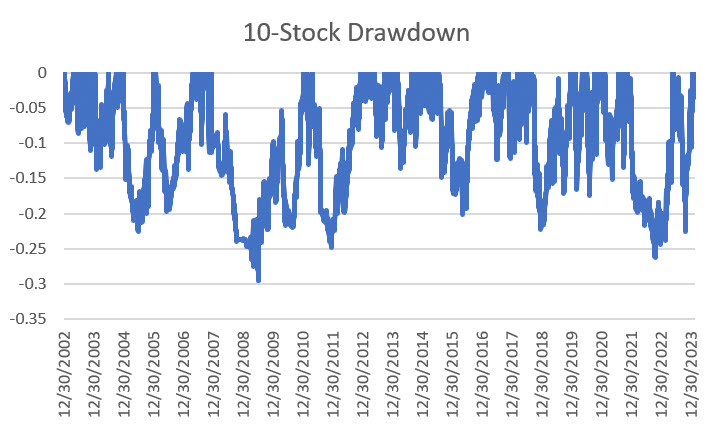
Charts 3 and 4. (Top) Drawdown for the 5-stock portfolio. (Bottom) Drawdowns for the 10-stock portfolio.
The Way the Portfolio Selection Works
We evaluate how each stock performs each day based on our 6 trend criteria. We then rank the most recent performance and choose the top 5 or 10 stocks for the portfolio. If one stock falls out of the top tier, it is dropped and replaced with another stock with higher returns. We believe this works because of “persistence,” the ability to keep profitable stocks in an uptrend.
When ranking, all returns must be above zero, but with no special pattern. If we are in a downturn, we may find that no stocks qualify, and we have no positions in the portfolio. Switching positions based on ranking tends to avoid giving back a lot of trend profits and reduces the average holding time for most stocks to less than 20 days.
Extreme Exits
Markets can get very volatile, especially the stocks in the news. Artificial intelligence and healthcare (during Covid) are high on the list of news-worthy stocks. News can drive up prices, then turn and drive them down.
If the total annualized portfolio volatility goes above 0.40, we have found that the risk is greater than the reward and we exit the entire portfolio. This is the same principle that we use in our other trend portfolios. High risk can cause large losses, even while we hope they don’t. We reenter the portfolio when the volatility drops, often selecting different stocks. The market offers many opportunities to generate profits without extreme risk.
Summary
We believe that technology, especially stocks dealing with artificial intelligence, plus healthcare, are the likely drivers for the next few years. While healthcare is less volatile, it will continue to be important to serve the public and our growing senior population. Diet drugs seem to be the latest evolution.
Although AI is now the rage, technology is forward looking. If not AI, then something else. Who would have guessed a year ago that AI would be the new technology. We expect that there will be a lot of competition, much like electric cars, and that will reduce volatility until the next innovation. If that happens, we will add/change markets that we trade in this program.
The good news about our process is that it can sort out the stocks that are moving and avoid those that have faded. It provides discipline.
A Standing Note on Short Sales
Note that the “All Signals” reports show short sales in stocks and ETFs, even though short positions are not executed in the equity portfolios. Our work over the years shows that downturns in the stock market are most often short-lived and it is difficult to capture with a longer-term trend. The upwards bias also works against shorter-term systems unless using futures, which allows leverage. Our decision has been to take only long positions in equities and control the risk by exiting many of the portfolios when there is extreme volatility and/or an indication of a severe downturn.
PORTFOLIO METHODOLOGY IN BRIEF
Both equity and futures programs use the same basic portfolio technology. They all exploit the persistence of performance, that is, they seek those markets with good long-term and short-term returns on the specific system, rank them, then choose the best, subject to liquidity, an existing current signal, with limitations on how many can be chosen from each sector. If there are not enough stocks or futures markets that satisfy all the conditions, then the portfolio holds fewer assets. In general, these portfolios are high beta, showing higher returns and higher risk, but have had a history of consistently outperforming the broad market index in all traditional measures.
PERFORMANCE BY GROUP
NOTE that the charts show below represent performance “tracking,” that is, the oldest results since are simulated but the returns from 2013 are the systematic daily performance added day by day. Any changes to the strategies do not affect the past performance, unless noted. The system assumes 100% investment and stocks are executed on the open, futures on the close of the trading day following the signals. From time to time we make logic changes to the strategies and show how the new model performs.
Groups DE1 and WE1: Daily and Weekly Trend Program for Stocks, including Income Focus, DowHedge, Sector Rotation, and the New High-Risk Portfolio
The Trend program seeks long-term directional changes in markets and the portfolios choose stocks that have realized profitable performance over many years combined with good short-term returns. It will hold fewer stocks when they do not meet our condition and exit the entire portfolio when there is extreme risk or a significant downturn.
New highs! It seems like a long-time coming, but traders don’t seem to care about the Fed as long as business keep generating profits. While most gains are coming from high-tech, there are many companies doing well (along with some not doing well). On balance, it looks good.

Income Focus and Sector Rotation
A small setback as the Fed refuses to give a date for reducing rates. This program seems poised to rally as soon as there is even a hint of a rate cut.

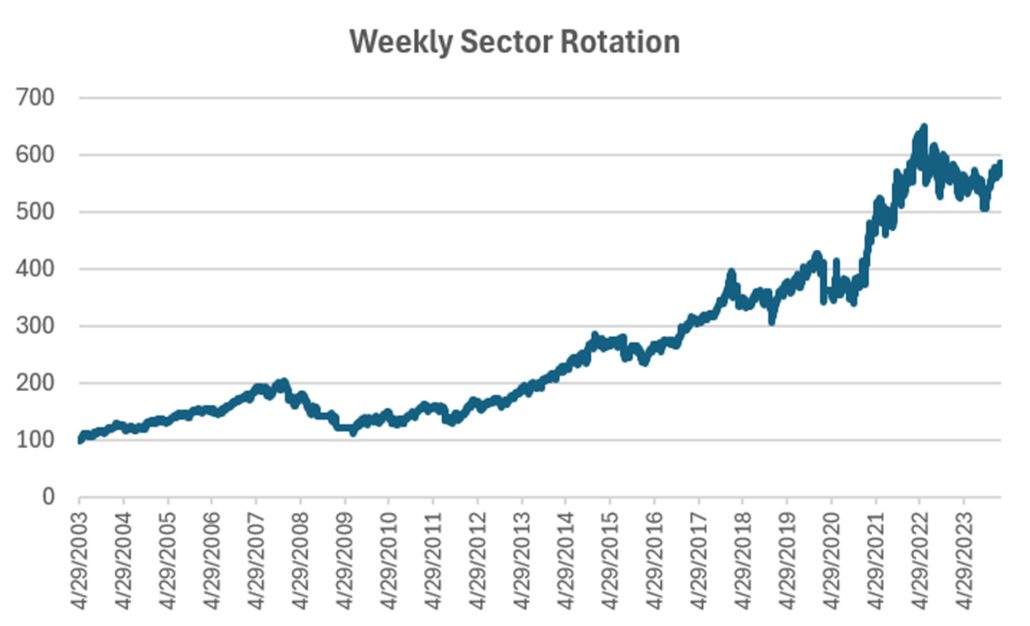
Sector Rotation
Small but steady profits for the Weekly Sector Rotation program. Again, no changes in positions.
DowHedge Programs
Another modest gain for the DowHedge programs. As you could see in the Major Equity ETF chart, the DOW and Russell are both lack-luster performers, so a gain of more than 4% is good. Both programs are on new highs.

The New High-Risk Portfolios
This is the first month for this new program. Our “Close-Up” report explained the premise and process for this portfolio. The first three weeks of this February perform is hypothetical. The last week is our usual tracking, where we capture the results of the Order Sheets.
It should not be a surprise that this portfolio did well, since it concentrates on those markets that are currently moving the market. The chart shows that the past two years have been volatile and mostly sideways. Not so much for the past few months.

Group DE2: Divergence Program for Stocks
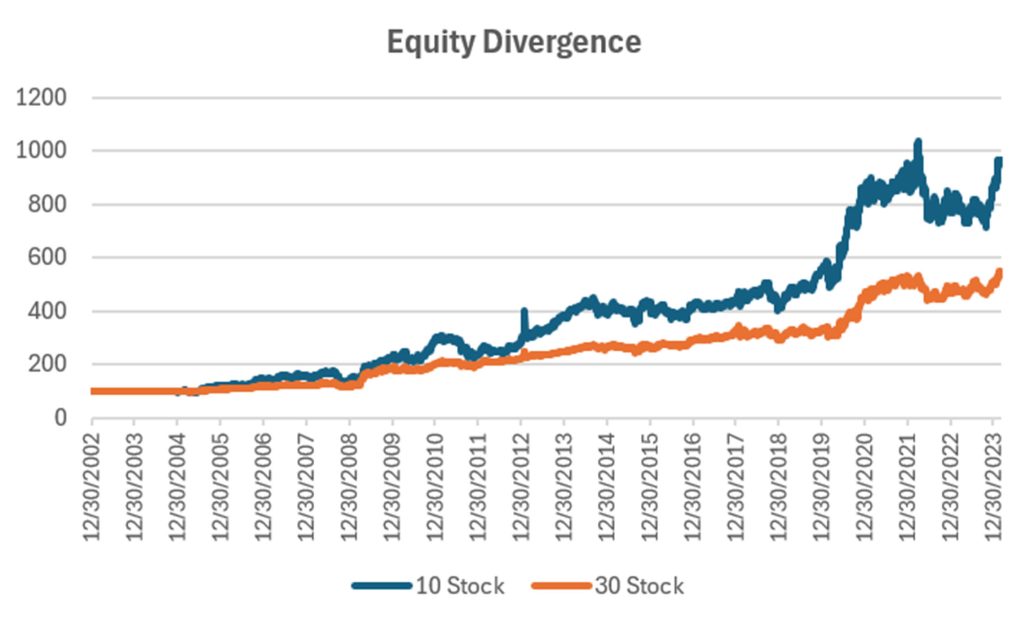
The Divergence program looks for patterns where price and momentum diverge, then takes a position in anticipation of the pattern resolving itself in a predictable direction, often the way prices had moved before the period of uncertainty.
A gain of more than 9% in the 10-stock and 5.8% in the 30-stock shows that the trend is persisting. This system looks to enter when the trend pauses and retraces, expecting the trend to resume. It hasn’t happened for a few years, but these gains indicate a different market.
Group DE3: Timing Program for Stocks
The Timing program is a relative-value arbitrage, taking advantage of undervalued stocks relative to its index. It first finds the index that correlates best with a stock, then waits for an oversold indicator within an upwards trend. It exits when the stock price normalizes relative to the index, or the trend turns down. These portfolios are long-only because the upwards bias in stocks and that they are most often used in retirement accounts.
A good pattern in the chart below, although the strong upwards gain of a few years ago requires a bull market. Still returns of 8% and 5.8% in February is a good sign. This program has been performing nicely with very small drawdowns.

Futures Programs
Groups DF1 and WF1: Daily and Weekly Trend Programs for Futures
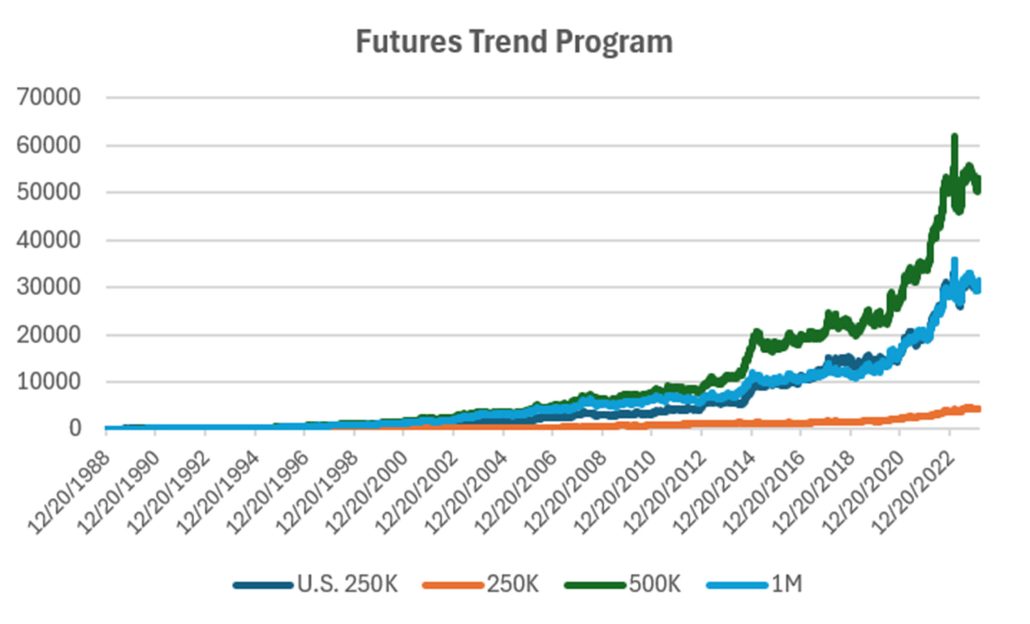
Futures allow both high leverage and true diversification. The larger portfolios, such as $1million, are diversified into both commodities and world index and interest rate markets, in addition to foreign exchange. Its performance is not expected to track the U.S. stock market and is a hedge in every sense because it is uncorrelated. As the portfolio becomes more diversified its returns are more stable.
The leverage available in futures markets allows us to manage the risk in the portfolio, something not possible to the same degree with stocks. This portfolio targets 14% volatility. Investors interested in lower leverage can simply scale down all positions equally in proportion to their volatility preference. Note that these portfolios do not trade Asian futures, which we believe are more difficult for U.S. investors to execute. The “US 250K” portfolio trades only U.S. futures.
Equities keep rallying and futures are mostly unchanged, waiting for their opportunity. February saw good returns in the $500K and $1M accounts but very little in either of the $250K portfolios. At some point they will all kick in.
Group DF2: Divergence Portfolio for Futures
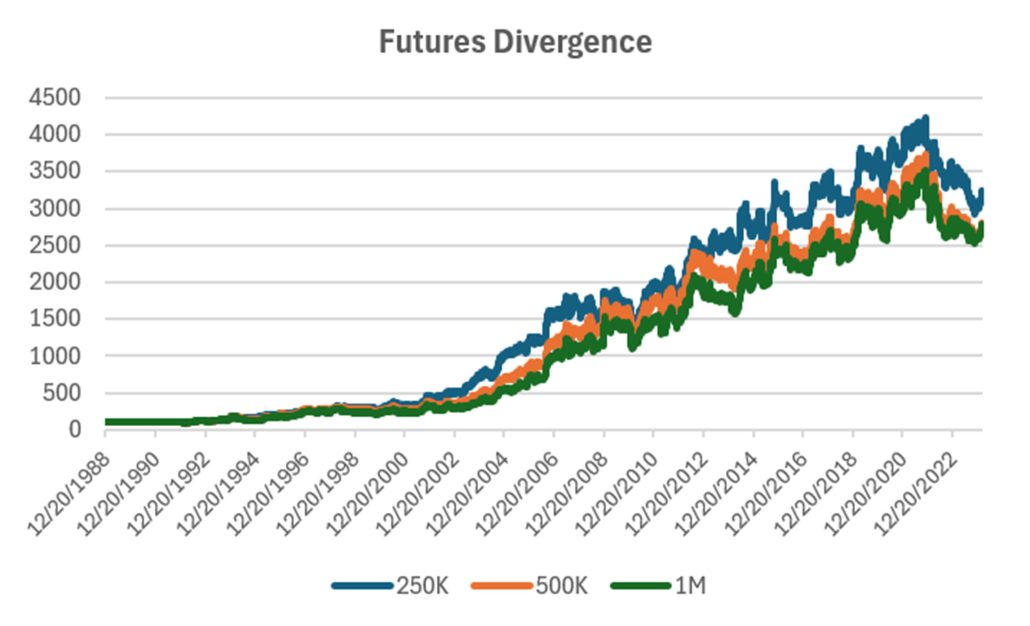
Similar to the equities Divergence program, February’s returns were good. All portfolios are nicely profitable, with the $250K leading the was with a gain of 8.5% and a YTD of over 14%.
Blogs and Recent Publications
Perry’s books are all available on Amazon or through our website, www.kaufmansignals.com.
February 2024
Perry published an article on using the backwardation and contango in crude oil in “The Delta-Delta Strategy.” If not crude, the you might think of this for any commodity, including interest rates, that have a consistent term structure.
January 2024
A new article in February edition of Technical Analysis of Stocks & Commodities, “Crossover Trading: Arbitrating the Physical with the Stock.” A chance at diversification!
Perry posted 3 new articles on Seeking Alpha in December, “Where Do You Take Profits?”, “Is There a Better Day to Enter the Market,” and “Watching January Returns.”
Another article in Technical Analysis of Stocks & Commodities, “Gap Momentum,” another interesting way to identify the trend.
December 2023
Perry posted 3 new articles on Seeking Alpha, “Where Do You Take Profits?”, “Is There a Better Day to Enter the Market,” and “Watching January Returns.”
This month Technical Analysis of Stocks & Commodities published “A Strategy For Trading Seasonal and Non-Seasonal Market.” Turns out that most markets are non-seasonal!
November 2023
Perry posted two articles on Seeking Alpha, “Compression Breakout: Giving a Boost to Your Entries,” and “Volatility: The Second Most Important Indicator.” In addition, he interview Herb Friedman in Technical Analysis of Stocks & Commodities. Herb is a interest rate specialist focusing on low risk investments.
October 2023
In this month’s Technical Analysis of Stocks & Commodities Perry shows how Merger Arb works and how an investor can participate in it. Merger Arb has been the realm of Institutions, but there are opportunities for everyone.
August 2023
Two(!) new articles by Perry in the August issue of Technical Analysis of Stocks & Commodities. The first is a look at how ChatGPT might help traders. It even asks for a computer program to use trend following.
The second article is “Portfolio Risk Dilemma,” where Perry answers the question of whether to let a stock or futures profit run or rebalance, and whether you should do the same for a diversified portfolio.
June 2023
Another article in Technical Analysis, “Protecting Your Wealth While Making a Profit.” It shows that moving money into different world equity markets can take advantage of momentum in both price and exchange rates.
May 2023
A new post on Seeking Alpha, “Profiting From Green Energy – But Not EVs” on May 31. Shows which stocks are best for investing in energy given the moving targets.
April 2023
On April 18th, Perry gave a webinar to the Society of Technical Analysts (London) on how to develop and test a successful trading system. Check their website for more details, https://www.technicalanalysts.com..
The April issue of Technical Analysis of Stocks & Commodities published a new article by Perry, “Repatriation,” an interesting trading pattern used by FX traders but adapted for us “normal traders.”
March 2023
Perry was interviewed by Mark Ursell of Ursell of TradeInform on March 3. You can see it or listen to it on UTube https://www.youtube.com/watch?v=9gIlIIzngCk.
A new article by Perry, “Can Volume Predict Price?” in the March issue of Technical Analysis of Stocks & Commodities. You’ll need to read it to find out!
Older Items of Interest
Perry’s webinar on risk, given to the U.K. Society of Technical Analysts, can be seen using the following link: https://vimeo.com/708691362/04c8fb70ea
For older articles please scan the websites for Technical Analysis of Stocks & Commodities, Modern Trader, Seeking Alpha, ProActive Advisor Magazine, and Forbes. You will also find recorded presentations given by Mr. Kaufman at BetterSystemTrader.com, TalkingTrading.com, FXCM.com, systemtrade.pl, the website for Alex Gerchik, Michael Covel’s website, TrendFollowing.com, and Talking Trading.com.
You will also find up to six months of back copies of our “Close-Up” reports on our website, www.kaufmansignals.com. You can address any questions to perry@kaufmansignalsdaily.com.
© February 2024, Etna Publishing, LLC. All Rights Reserved.
