
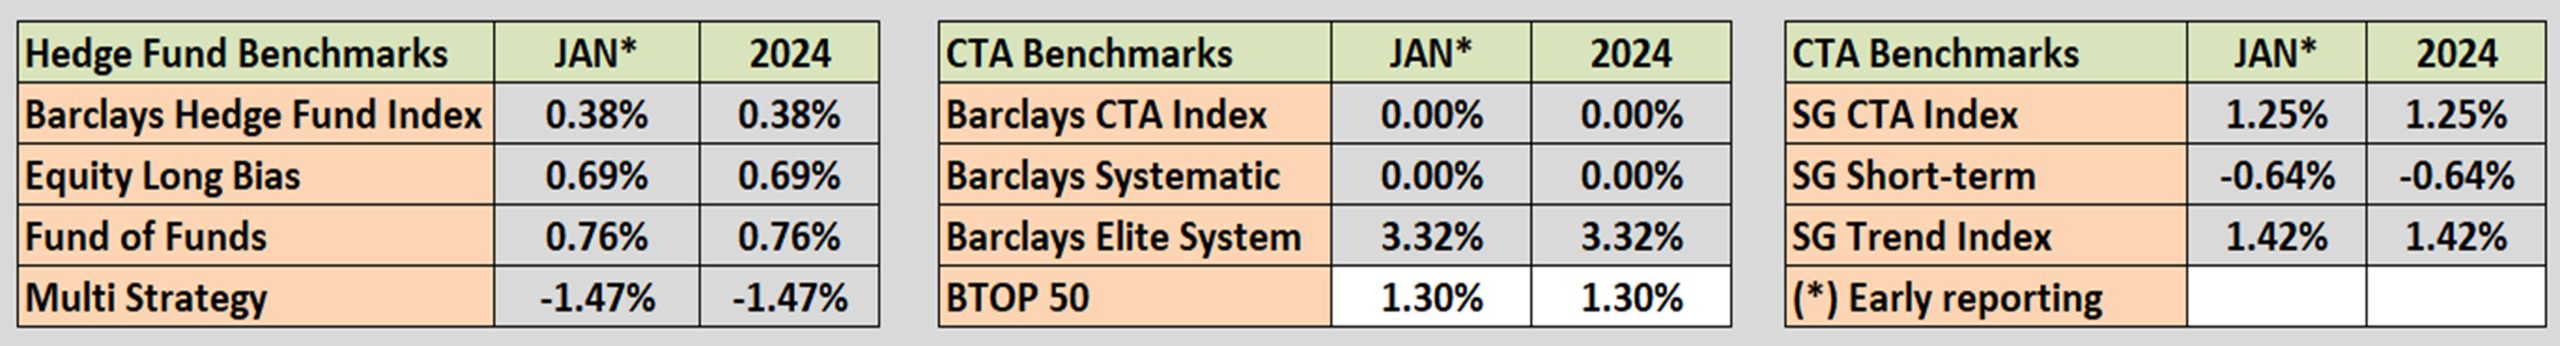
Industry Benchmark Performance
Most Equity funds did much the same as the index markets, somewhere above zero and less than 1%. CTA funds have not yet reported but the BTOP 50 (not a real fund), gained 1.30%. Given the volatility of the market, any positive return is good.
Kaufman’sMost Popular Books (available on Amazon)
Trading Systems and Methods, 6th Edition. The complete guide to trading systems, with more than 250 programs and spreadsheets. The most important book for a system developer.
Kaufman Constructs Trading Systems. A step-by-step manual on how to develop, test, and trade an algorithmic system.
Learn To Trade. Written for both serious beginners and practiced traders, this book includes chart formations, trends, indicators, trading rules, risk, and portfolio management. You can find it in color on Amazon.
You can also find these books on our website, www.kaufmansignals.com.
Blogs and Recent Publications
Find Mr. Kaufman’s other recent publications and seminars at the end of this report. We post new interviews, seminars, and reference new articles by Mr. Kaufman each month.
January Performance in Brief
It was all about traders fighting Fed, every time an economic report came out. Traders were tracking inflation, claiming that the Fed had met its target, while the Fed kept saying “not yet.” It was the same story on the last day of the month, when traders where hopeful that the Fed would put a date on when they would cut. That didn’t happen and prices tanked. But traders are every hopeful, and we expect a rally to resume.
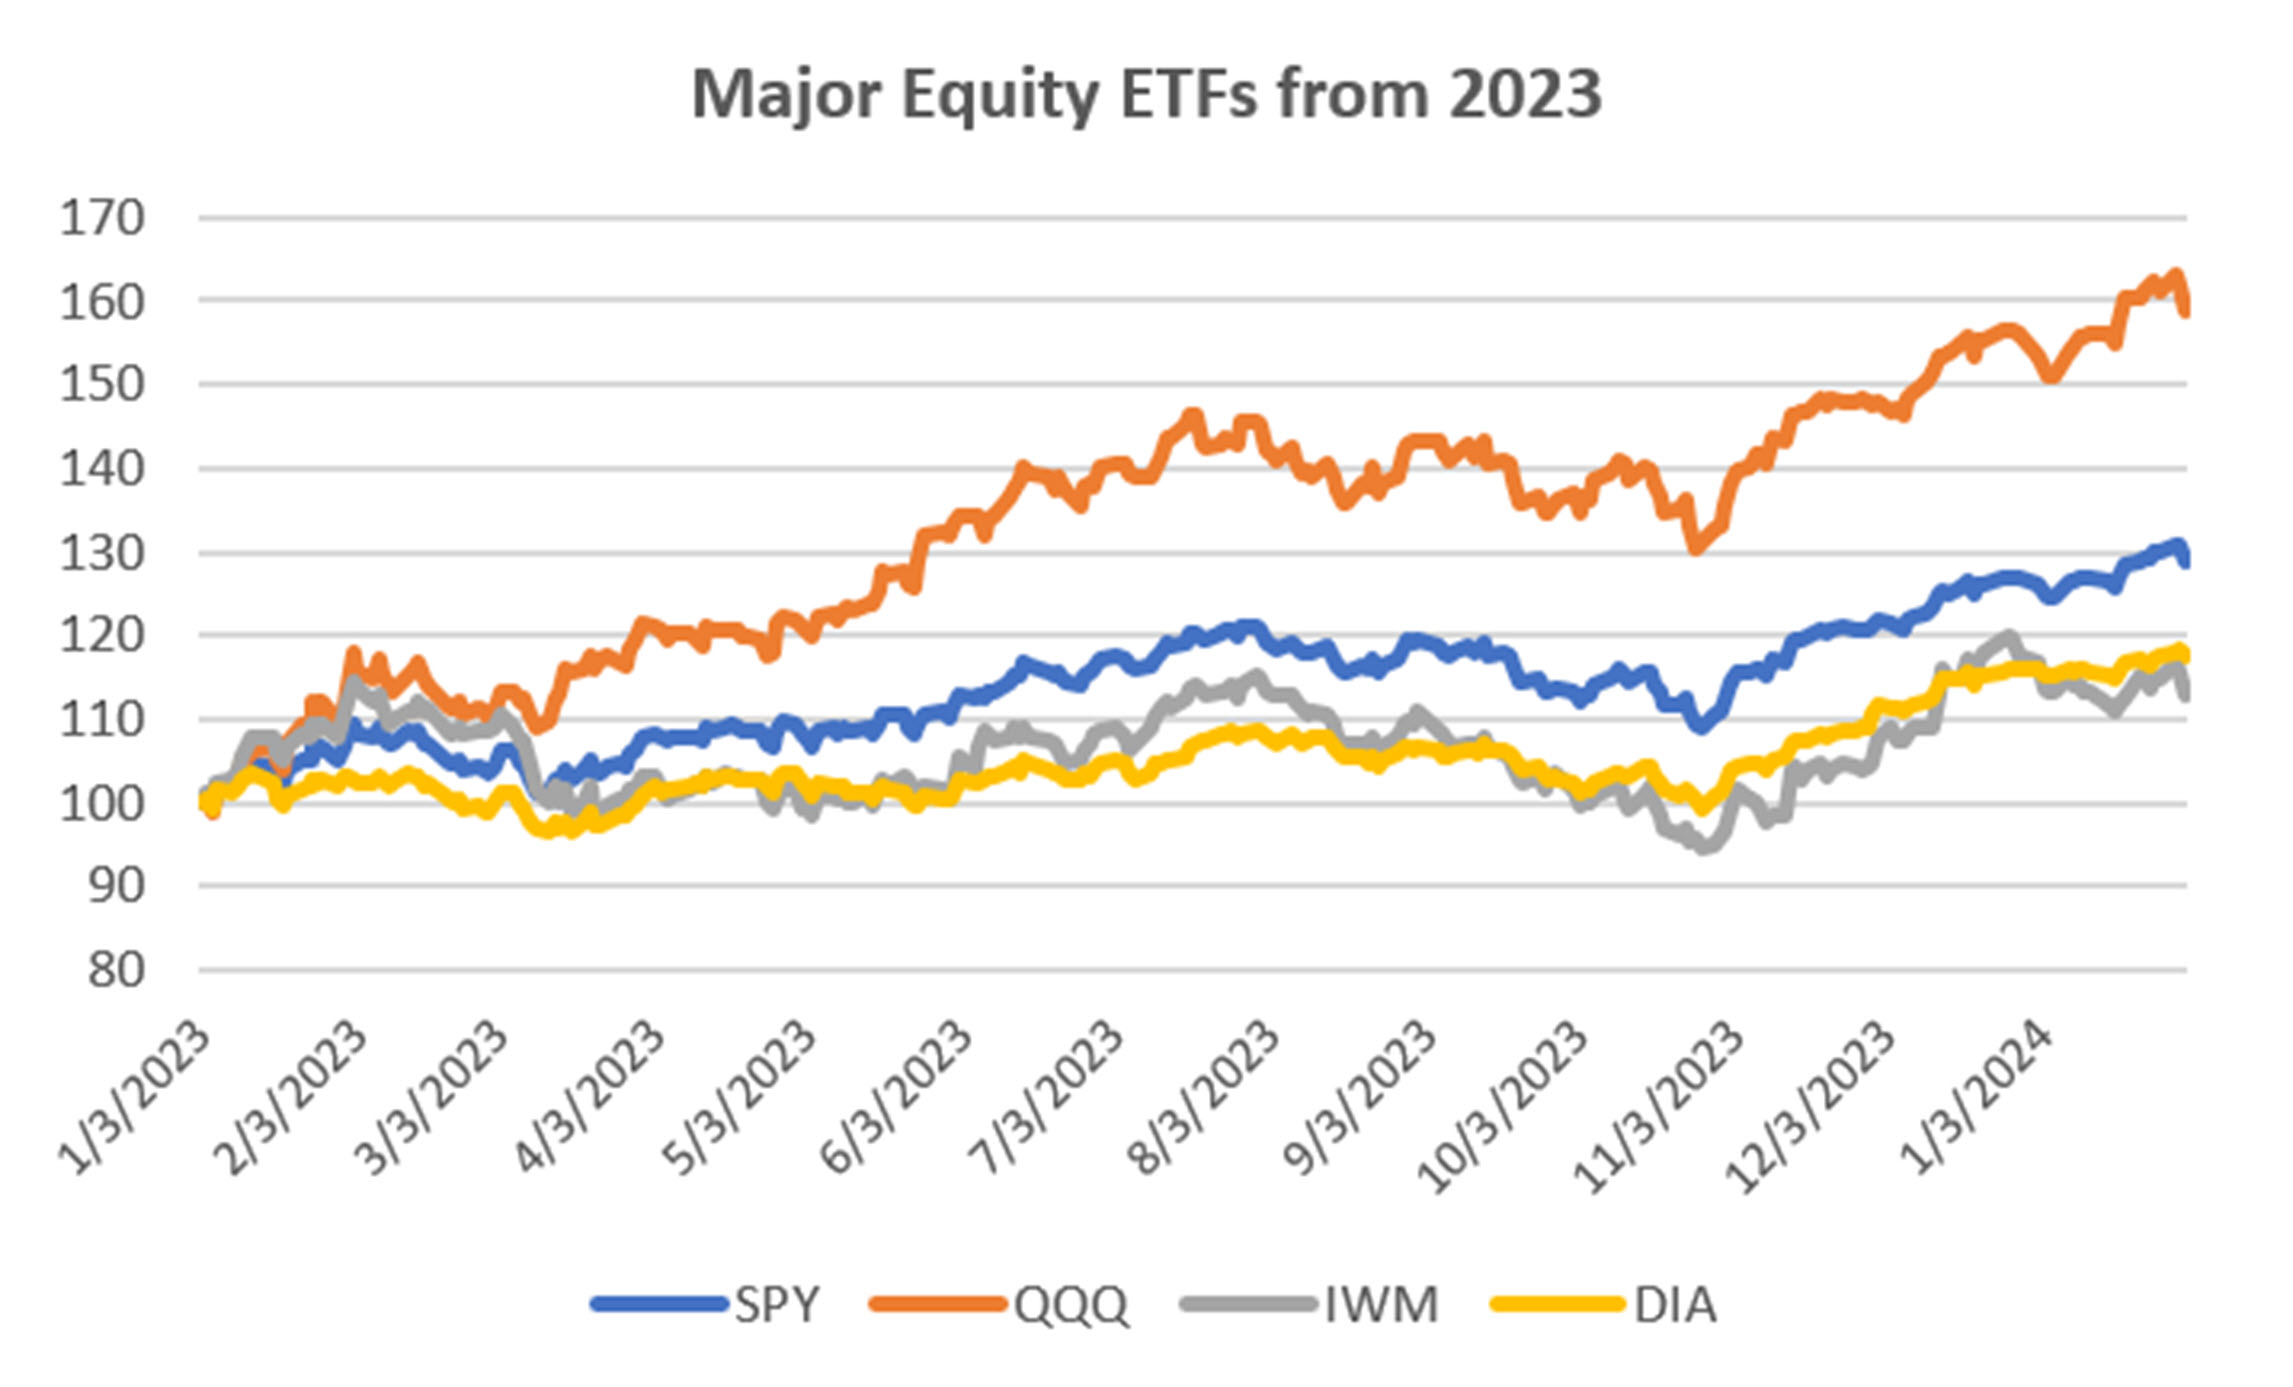
Major Equity ETFs
When we take away 2022 from our Major Equity ETFs, the result looks remarkably bullish. Considering the Fed was raising rates, then holding steady at about 5%, it’s very impressive. Nasdaq was the clear winner with AI as the motivating reason, with the S&P benefiting from mostly the same stocks. The small caps, not so much. As we said above, if the traders can drive up prices while the Fed raises rates, it seems most likely that it will continue given rates custs sometime in the middle of the year.
CLOSE-UP: Selecting the Right Markets for Your Strategy
Not all markets work on all systems – not all systems work on all markets.
It is unrealistic to think that a particular strategy will work on all markets. Markets that go nowhere won’t work for a trend system but can be just right for mean reversion. On the other hand, the Eurodollar rates tend to be the trendiest market and is a disaster for mean reversion.
Of course, there are markets that have periods of trending and noise. You can use them for either strategies as long as you control the risk. They vary in performance but can help with diversification.
In this article, I want to point out the markets that are most important for each venue, and the ones that you want to avoid. Avoiding the worst is the simplest way to increase your returns.
How Do We Rank the Markets?
Years ago I developed the efficiency ratio as part of the Kaufman Adaptive Moving Average system. In many ways it simulates the drunken sailors walk. It measures the most efficient path (a straight line) divided by the actual price path (a crooked line). The closer it gets to 1, the more efficient. Values that are low show more noise. For those that haven’t seen this, the formula is
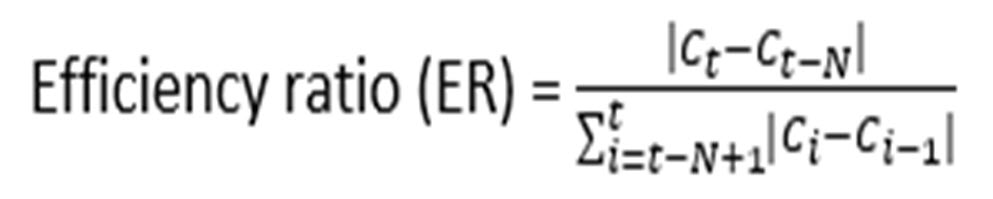
If we use a 10-day interval (N=10) and calculate ER for every day during a data period, then average each of those 10-day results, we get a good idea of the trendiness and noise. We will look at data from 2001. Luckily, I have a program to do that!
Futures First
I like futures because they represent broad sectors of the economy. They are not subject to scandals and earnings as stocks, and they might point to ETFs that have a similar profile. As I said, we are most interested in the highest and lowest values of the ER.
Testing over 65 futures markets, Chart 1 shows that interest rates have the most trend. Five of the top six are short-term or long-term maturities. Note that they are not U.S. rates, which attract a greater degree of speculation and therefore cause noise. I question silver and gold being there, mostly because they have long periods where they haven’t really moved.
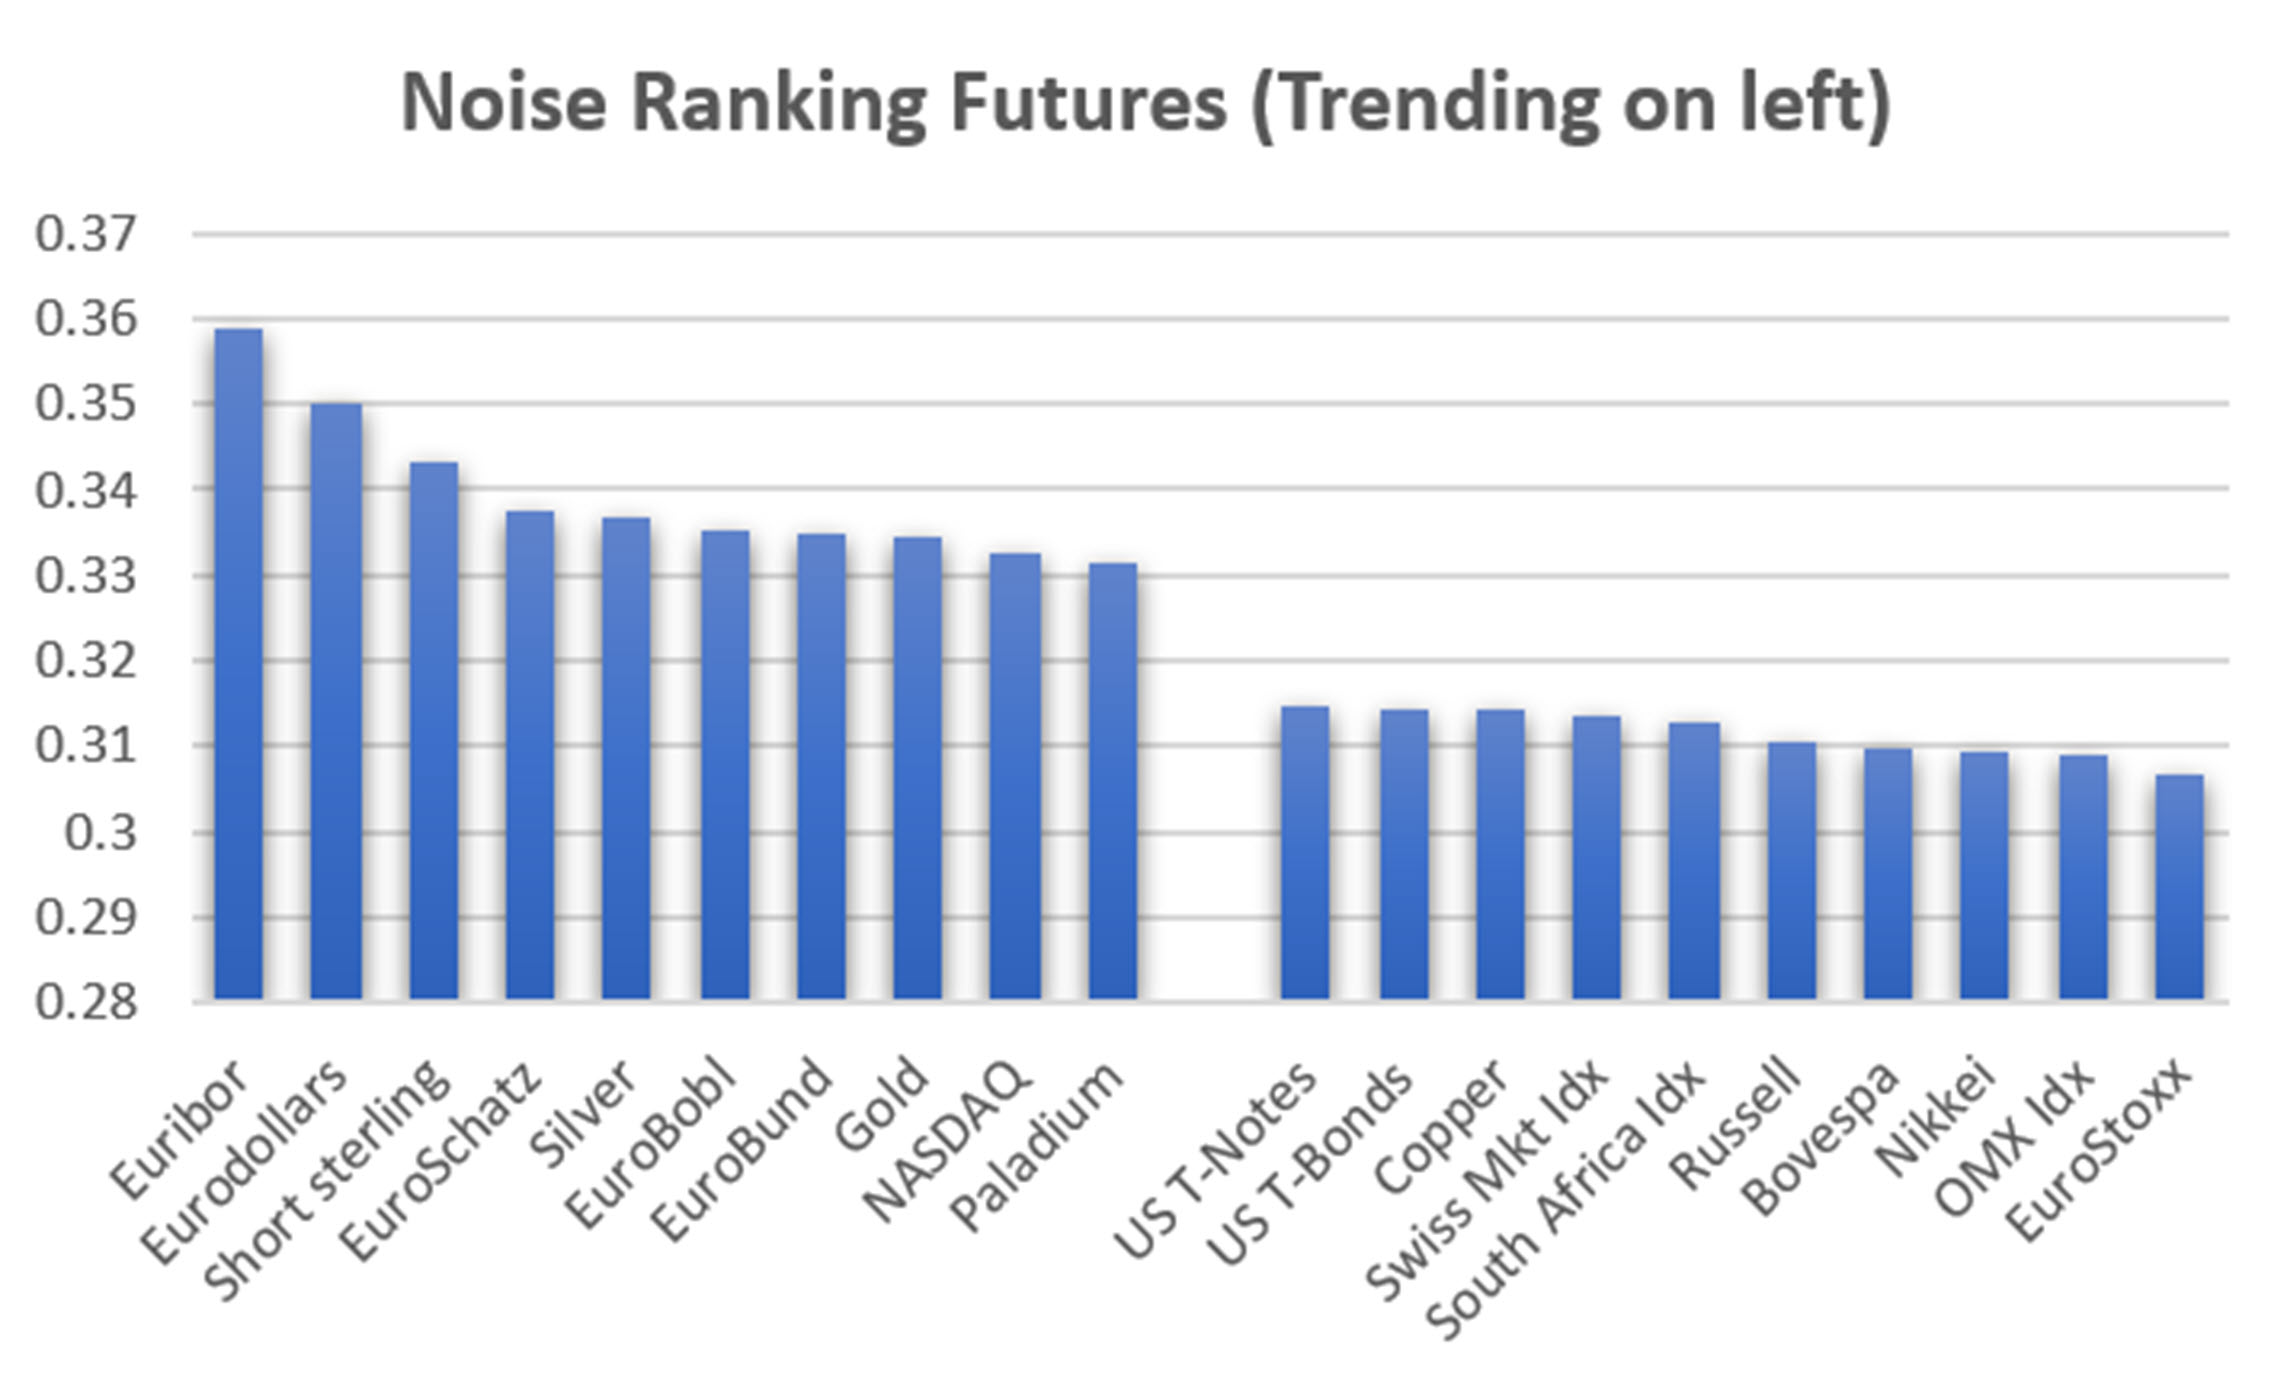
Chart 1. Futures ranking from 2001.
The noisiest market that do not work for trends and are best with mean reversion. Over the years that I have run this test, EuroStoxx has consistently ended as the noisiest market. Among the other noisy markets are mostly stock index markets. Remember that all markets can have trending as sideways periods. The markets in Chart 1 have the most trend (left) and most sideways (right) profiles.
Although not shown, crude, heating oil, the euro and DAX come out as trending. The S&P and other U.S. long maturity rates come out as noisy.
The Best and the Worst of Futures
To prove that the ER ranks correctly, let’s take the two extremes, Euribor and EuroStoxx, and run a trending test on both. Data is from 2000, Buy when the trendline turns up, sell when it turns down. Size the position by dividing $25,000 by the dollar value of the average true range (ATR).
Chart 2 shows that all test calculation periods for Euribor make money for long trades. Before 2021 all the short sales would have lost money, but the rapid rise in interest rates last year now shows profits.
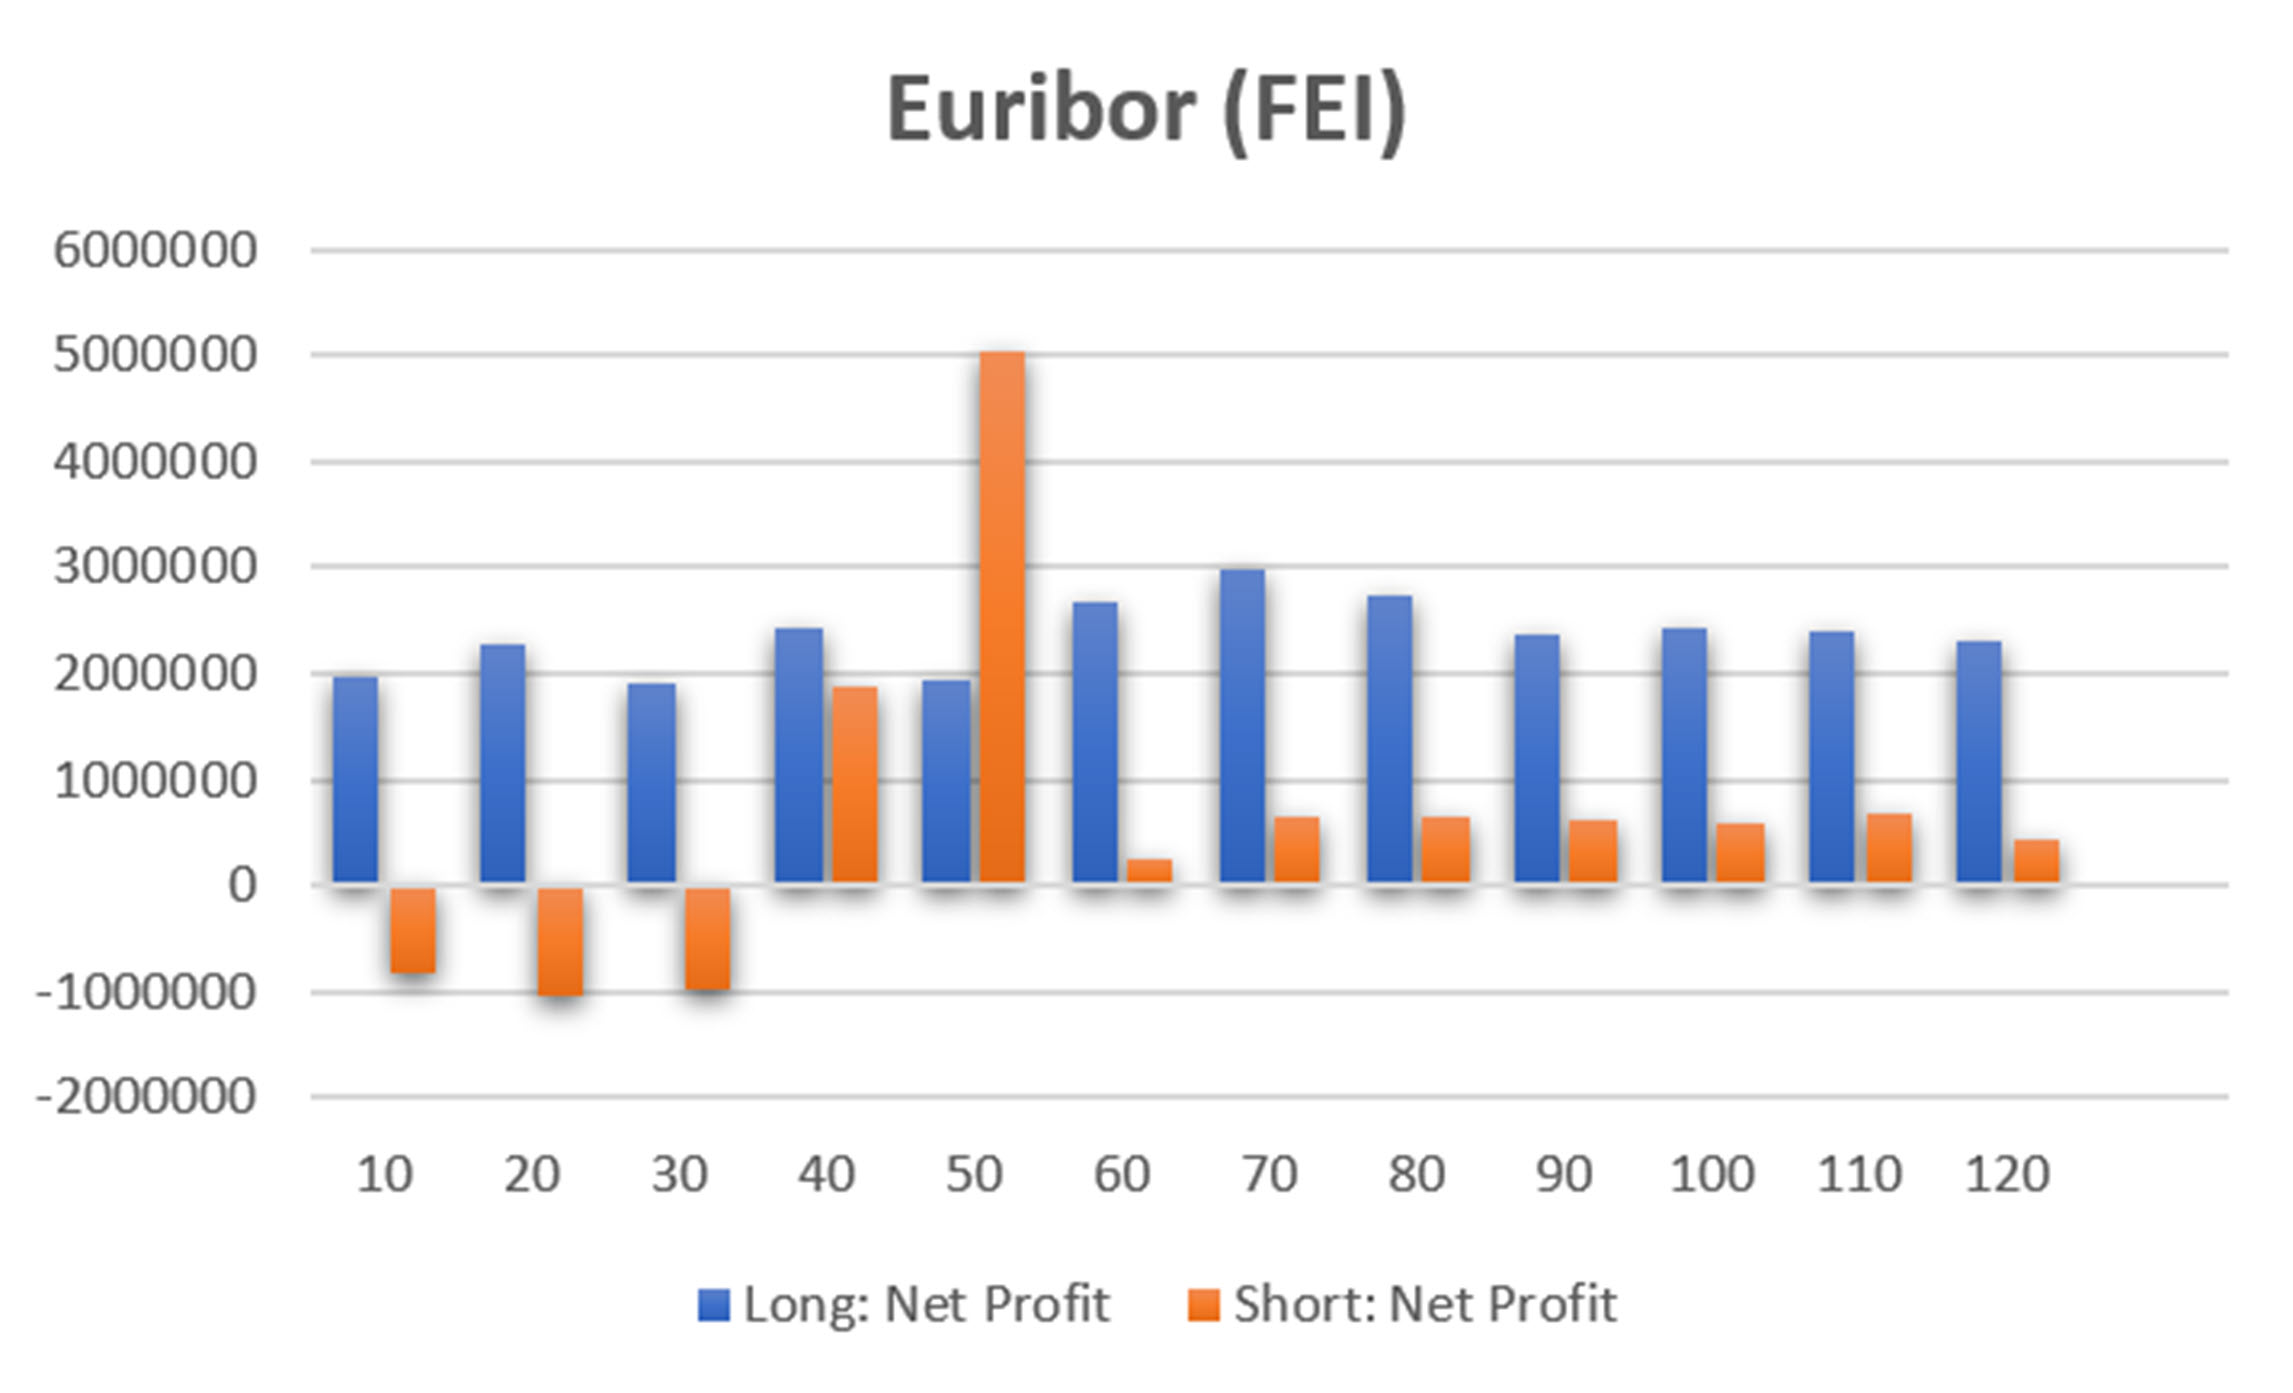
Chart 2. Euribor (FEI) trend tests. Moving average periods along bottom.
If we look at the returns using the 50-day moving average, we can see the jump. Despite the sudden profits, Euribor is the best trending market when only long positions are taken. As rates come down, long positions will again be favored.

Chart 3. Euribor returns using a 50-day moving average.
Going to the opposite side of the noise ranking, the market with the most noise is EuroStoxx (S2E). The best trend was 120 days, the top of our test. To me that indicates there is a long-term trend underlying all the noise. Chart 4 shows the return pattern of the 120-day moving average.

Chart 4. EuroStoxx returns using a 120-day moving average.
Yes, there is a trend because the ending value is greater than the starting value, but it is far from smooth. For a trend follower, you want to use interest rate short-term maturities but not many equity index markets (well, maybe the Nasdaq).
The Best and Worst of ETFs
I ran a large set of ETFs, including some smaller sector ETFs. Chart 5 shows the best (left) and the worst (right) for a trending system. The best by quite a bit are munis (municipal bonds), with two other high-yield bonds showing on the left. Nasdaq appears as a trend market for both Futures and ETFs (QQQ). That goes along with the technology ETF, XLK.

Chart 5. Ranking of ETFs for noise.
On the noisy end (the right) we find Treasury bills, Regional Banks, and Retail. Treasury bills are a problem because they seem to roll every three months, causing the yield to jump. We’ll skip that and use Regional Banks as the best mean reversion choice (high noise). We will also skip the detailed optimization results and go straight to “the best” moving averages.
Chart 6 shows the muni returns using a 10-day average. The fact that 10-days was the best trend implies that the trend is very smooth. Just like Euribor, shorts sales are not preferable, even though the past two years were an exception.
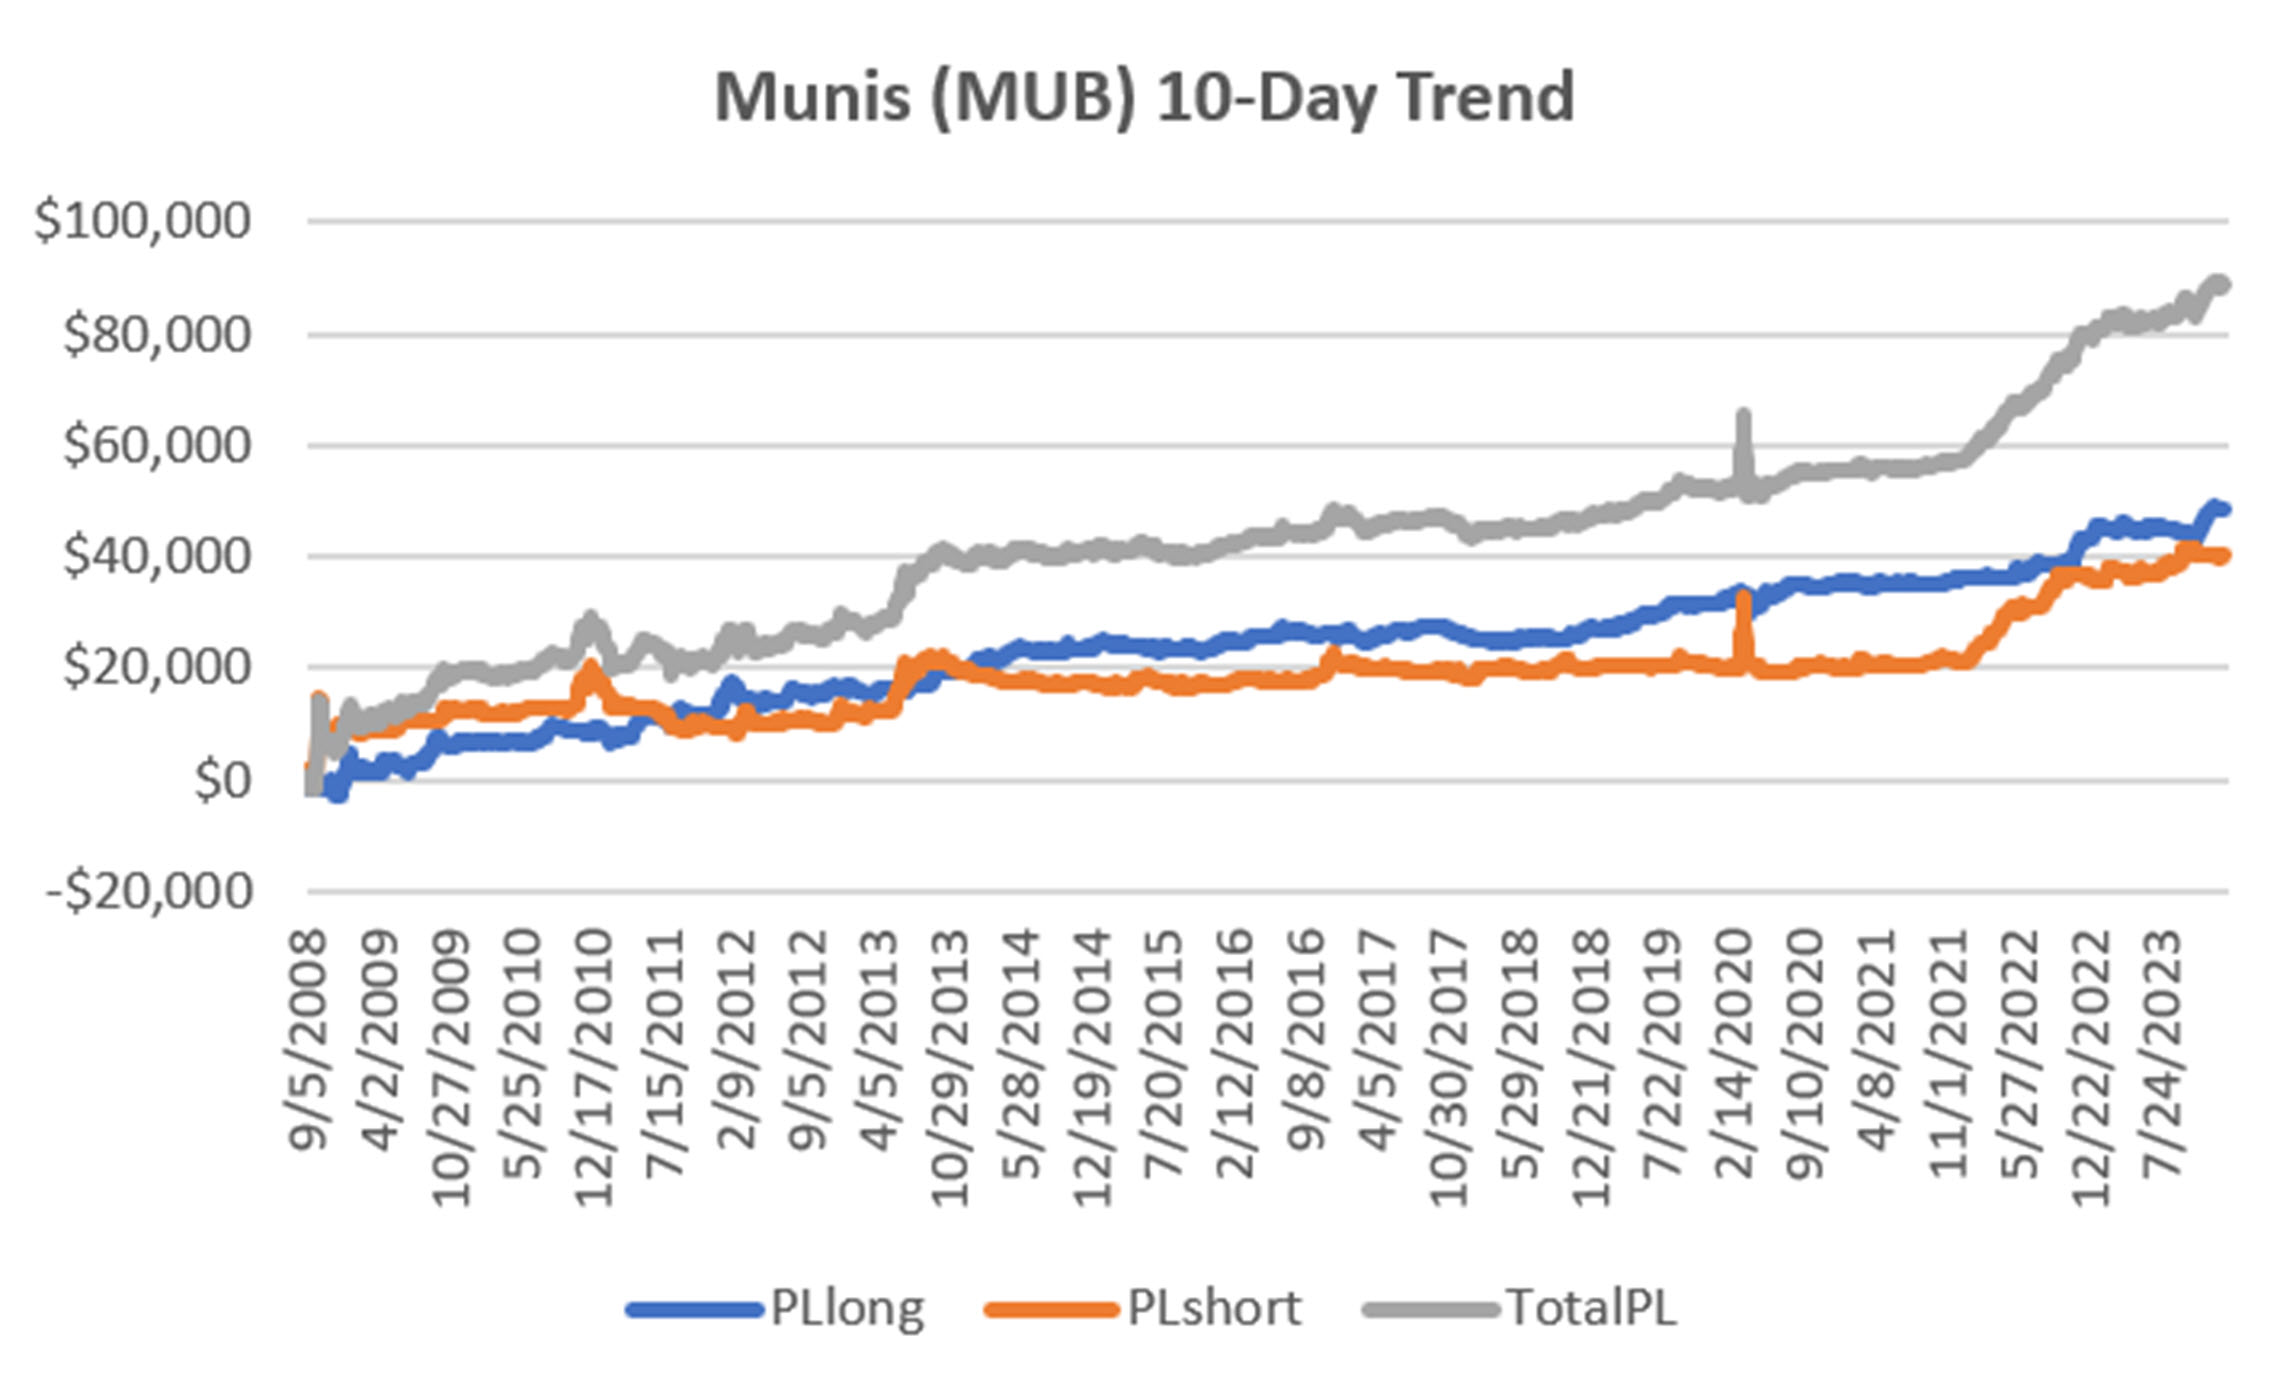
Chart 6. Returns of the municipal bonds ETF (MUB) using a 10-day moving average.
Chart 7 shows the 120-day returns of Regional Banks (KRE), the best of the moving average tests. Again, we find that a 120-day moving average is trying to pick up the long-term, underlying trend. Even with that, we can see that the best trend is not very good.
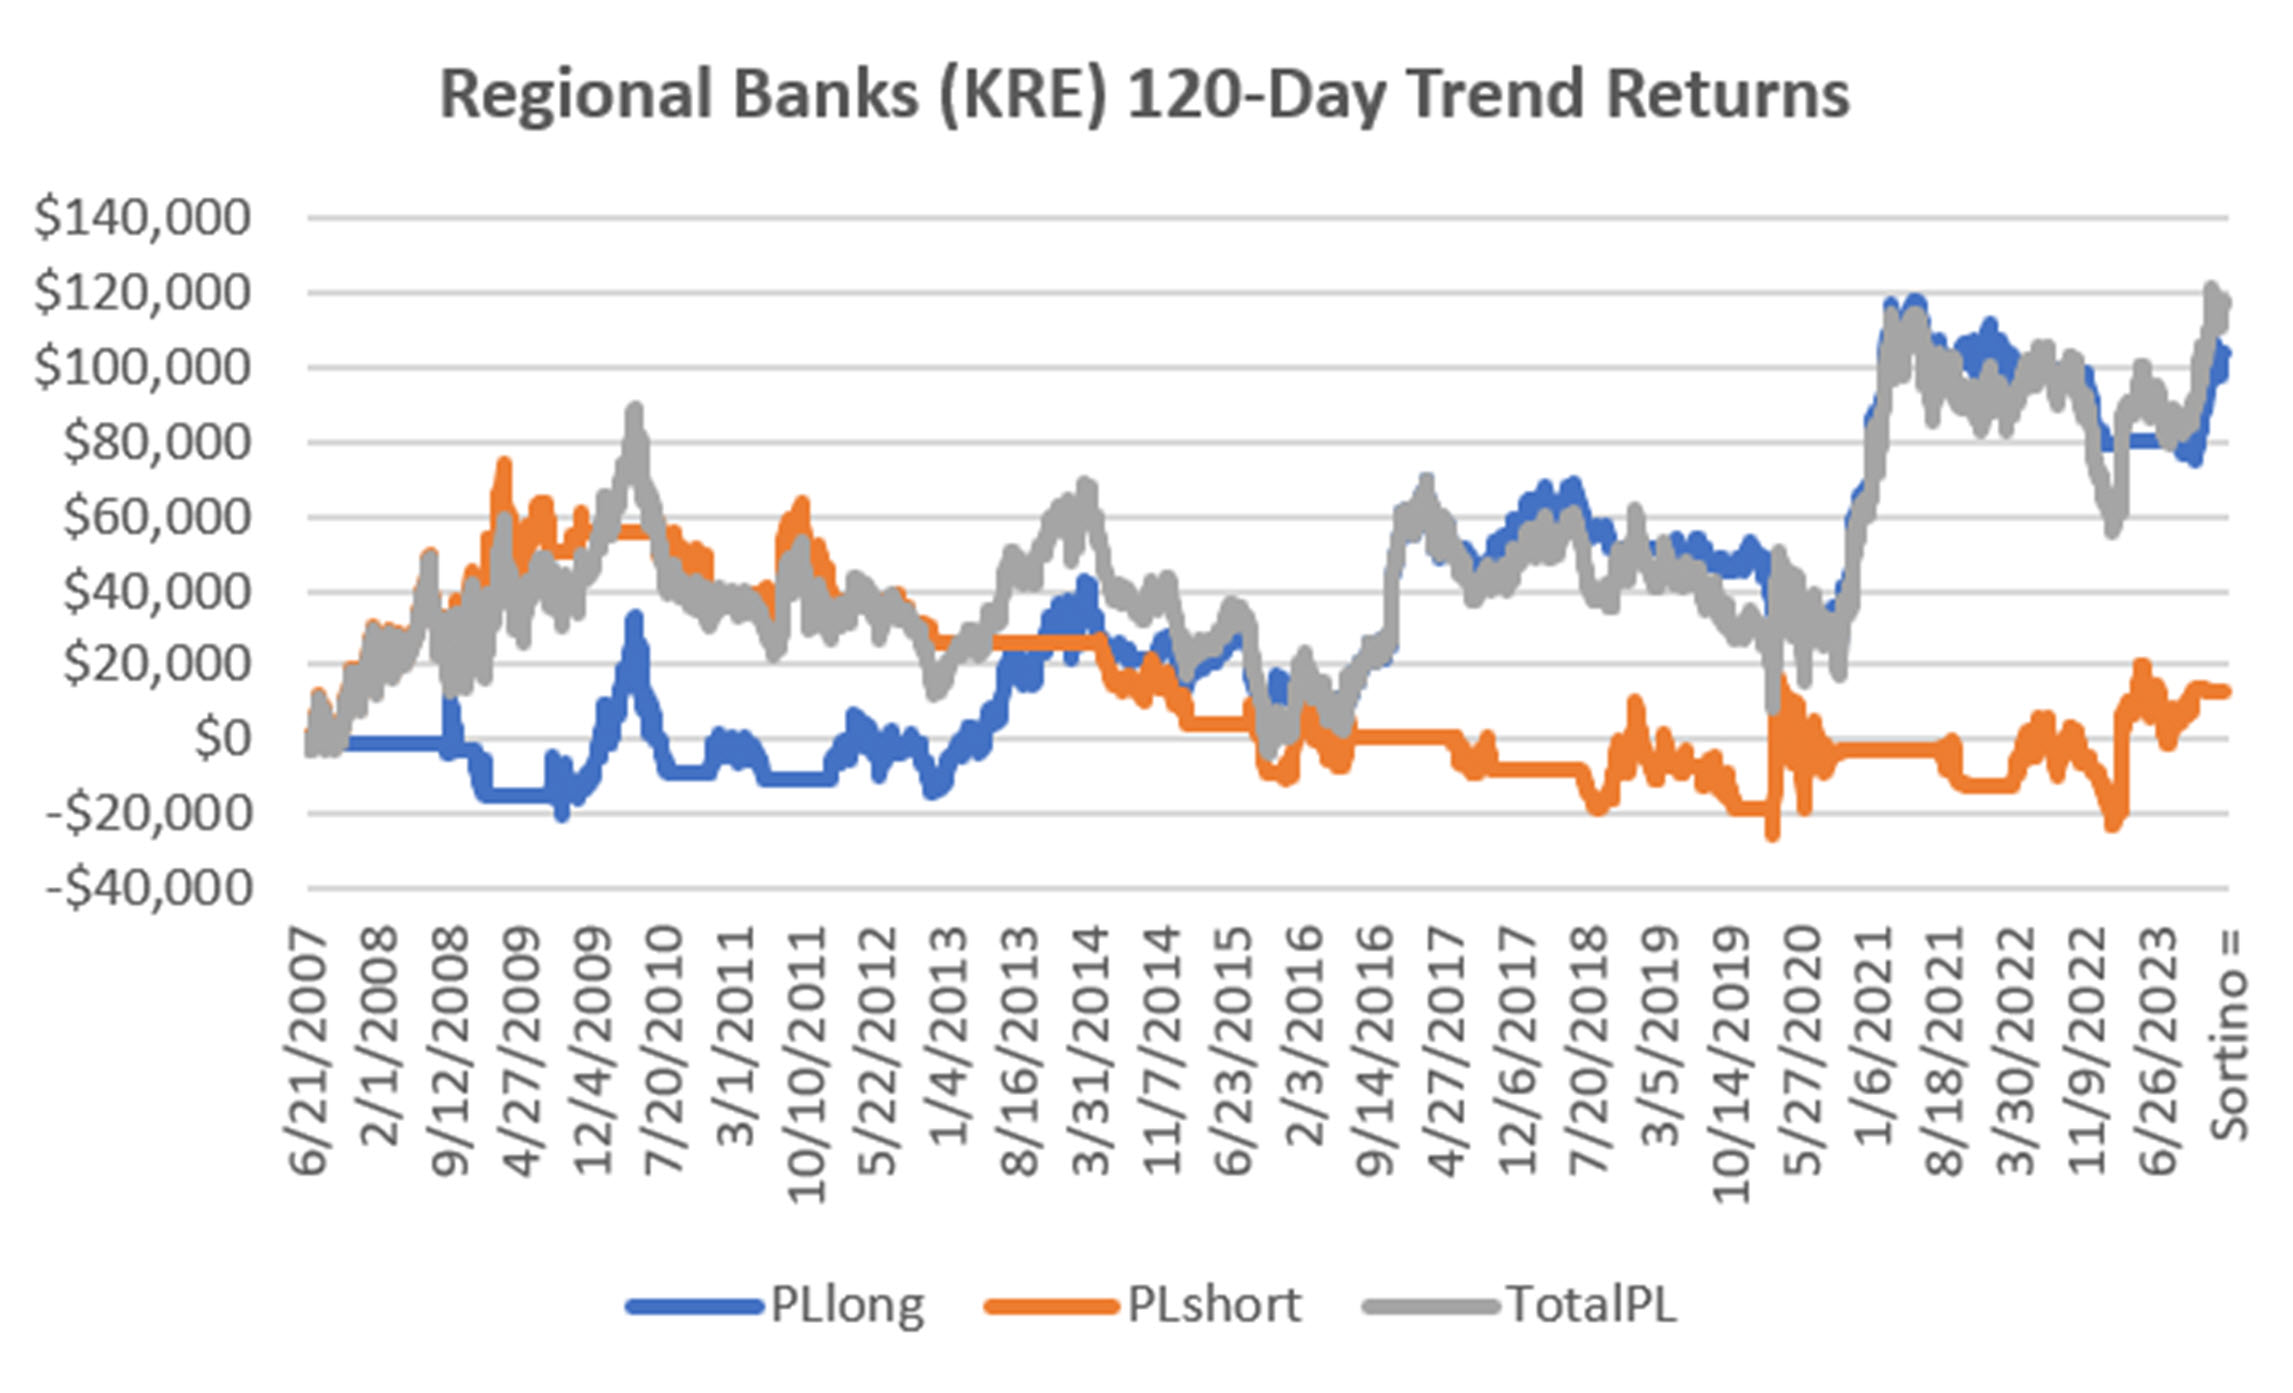
Chart 7. Returns of the Regional Bank ETF (KRE) using a 120-day moving average.
The Best and the Worst of Individual Stocks
For this test I used a file containing 450 stocks that I use for my own trend strategies. Keep in mind that a stock can have periods of trending and mean reversion. The stocks on the left have more trends, the ones on the right have more mean reversion. The results include both long and short sales, although when I trade, I only take long positions.
Because there are so many stocks in this test, many of them have similar statistics. Chart 8 shows Apple (AAPL) as the trendiest, plus other stocks that have been in the news. On the right, the noisiest is C3.ai, but it only has three years of data, so we will look at TJMaxx instead. Remember that individual stock prices can jump around, while futures and even ETFs are more stable.
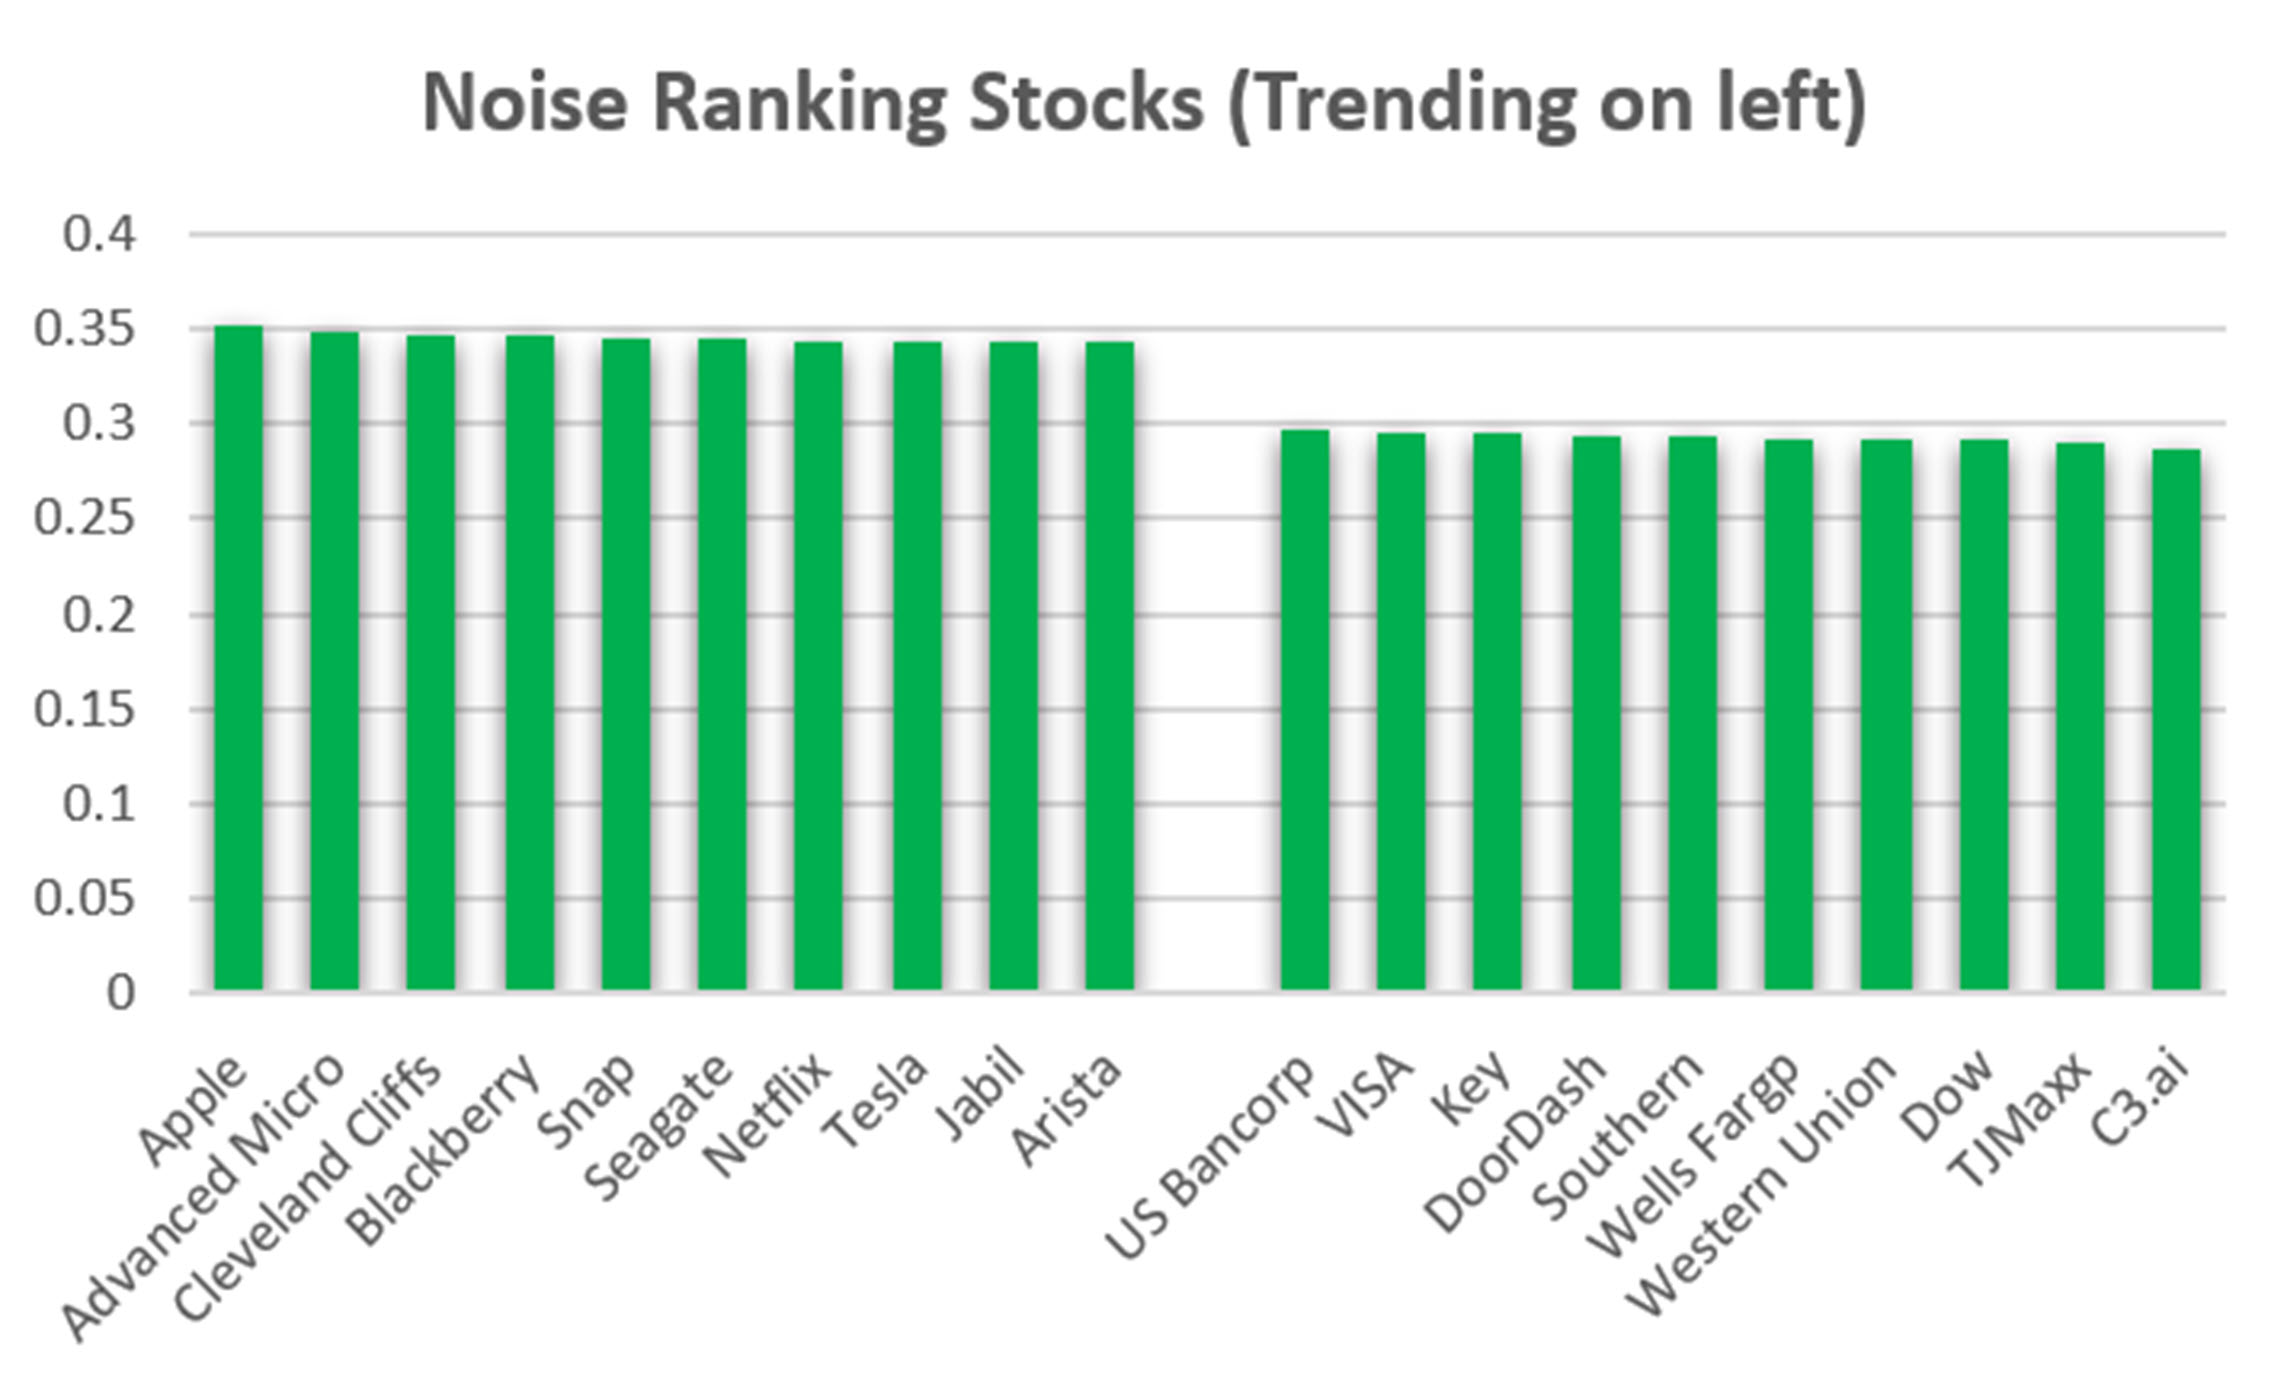
Chart 8. Ranking of individual stocks for trend and noise.
Starting with Apple, Chart 9 shows why we only take long trades. Returns have been very smooth, even using a 110-day moving average. It also seems clear why most managers are still holding their Apple positions.
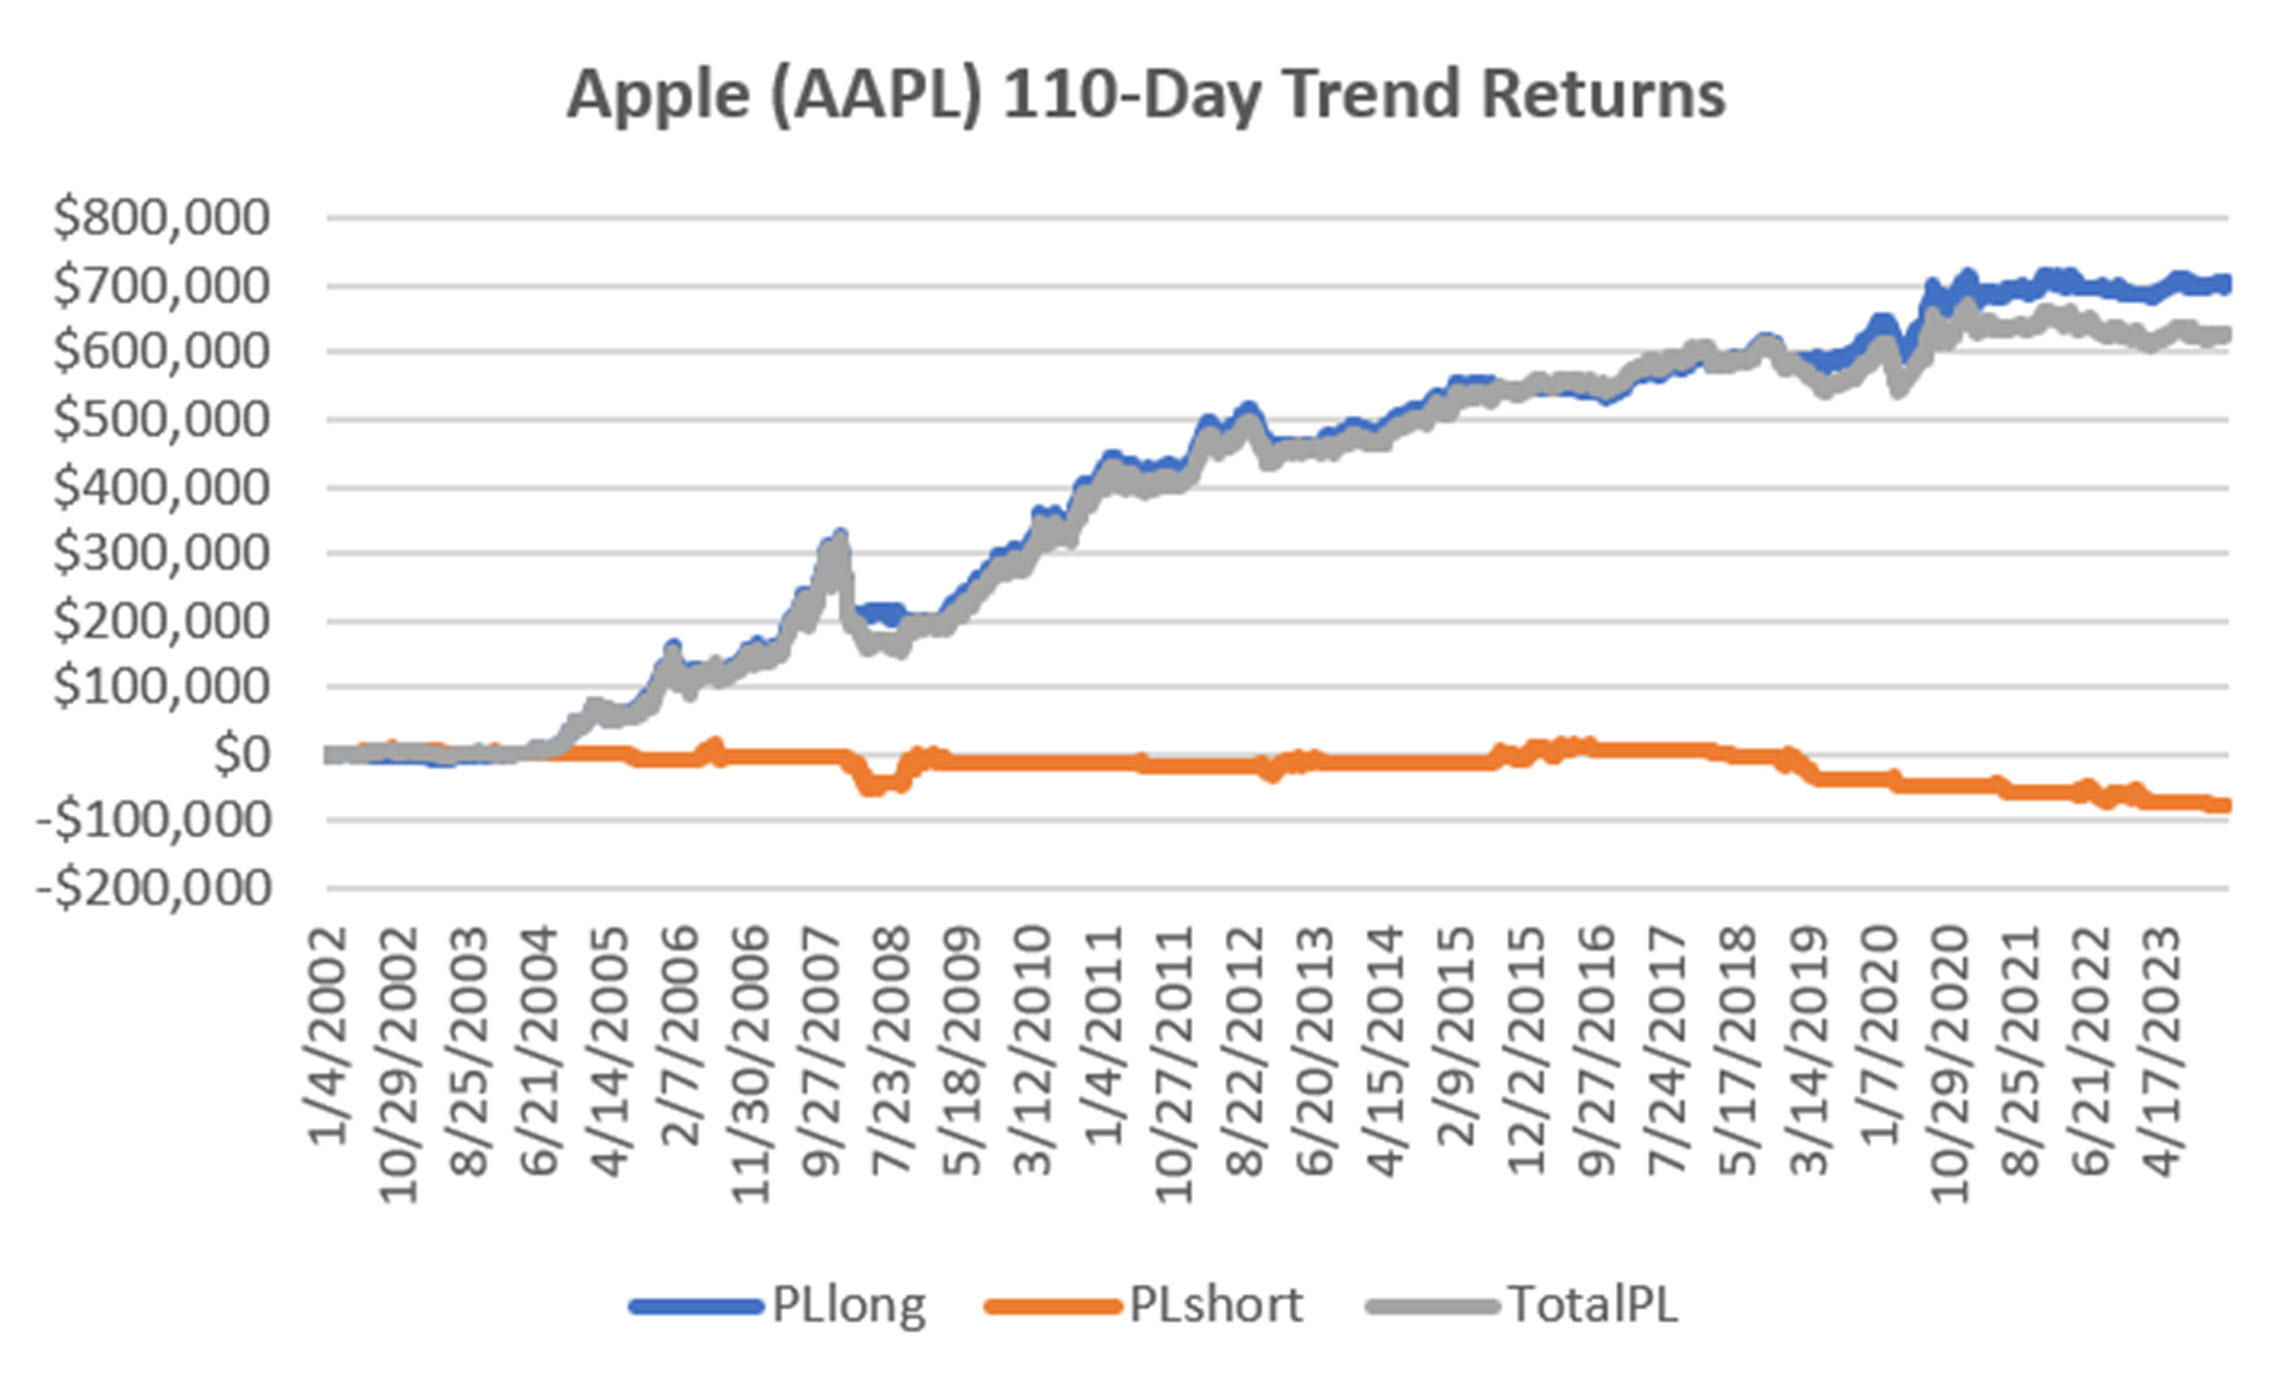
Chart 9. Apple (AAPL) returns using a 110-day moving average.
Moving to TJ Maxx (TJX), we see a slightly different patterns in Chart 10. Long trades have good returns, but combining long and short-sales offset each other. If you do this yourself, I suggest that you only look at long positions for stocks. Still, ranking by noise shows the difference between trending and non-trending.
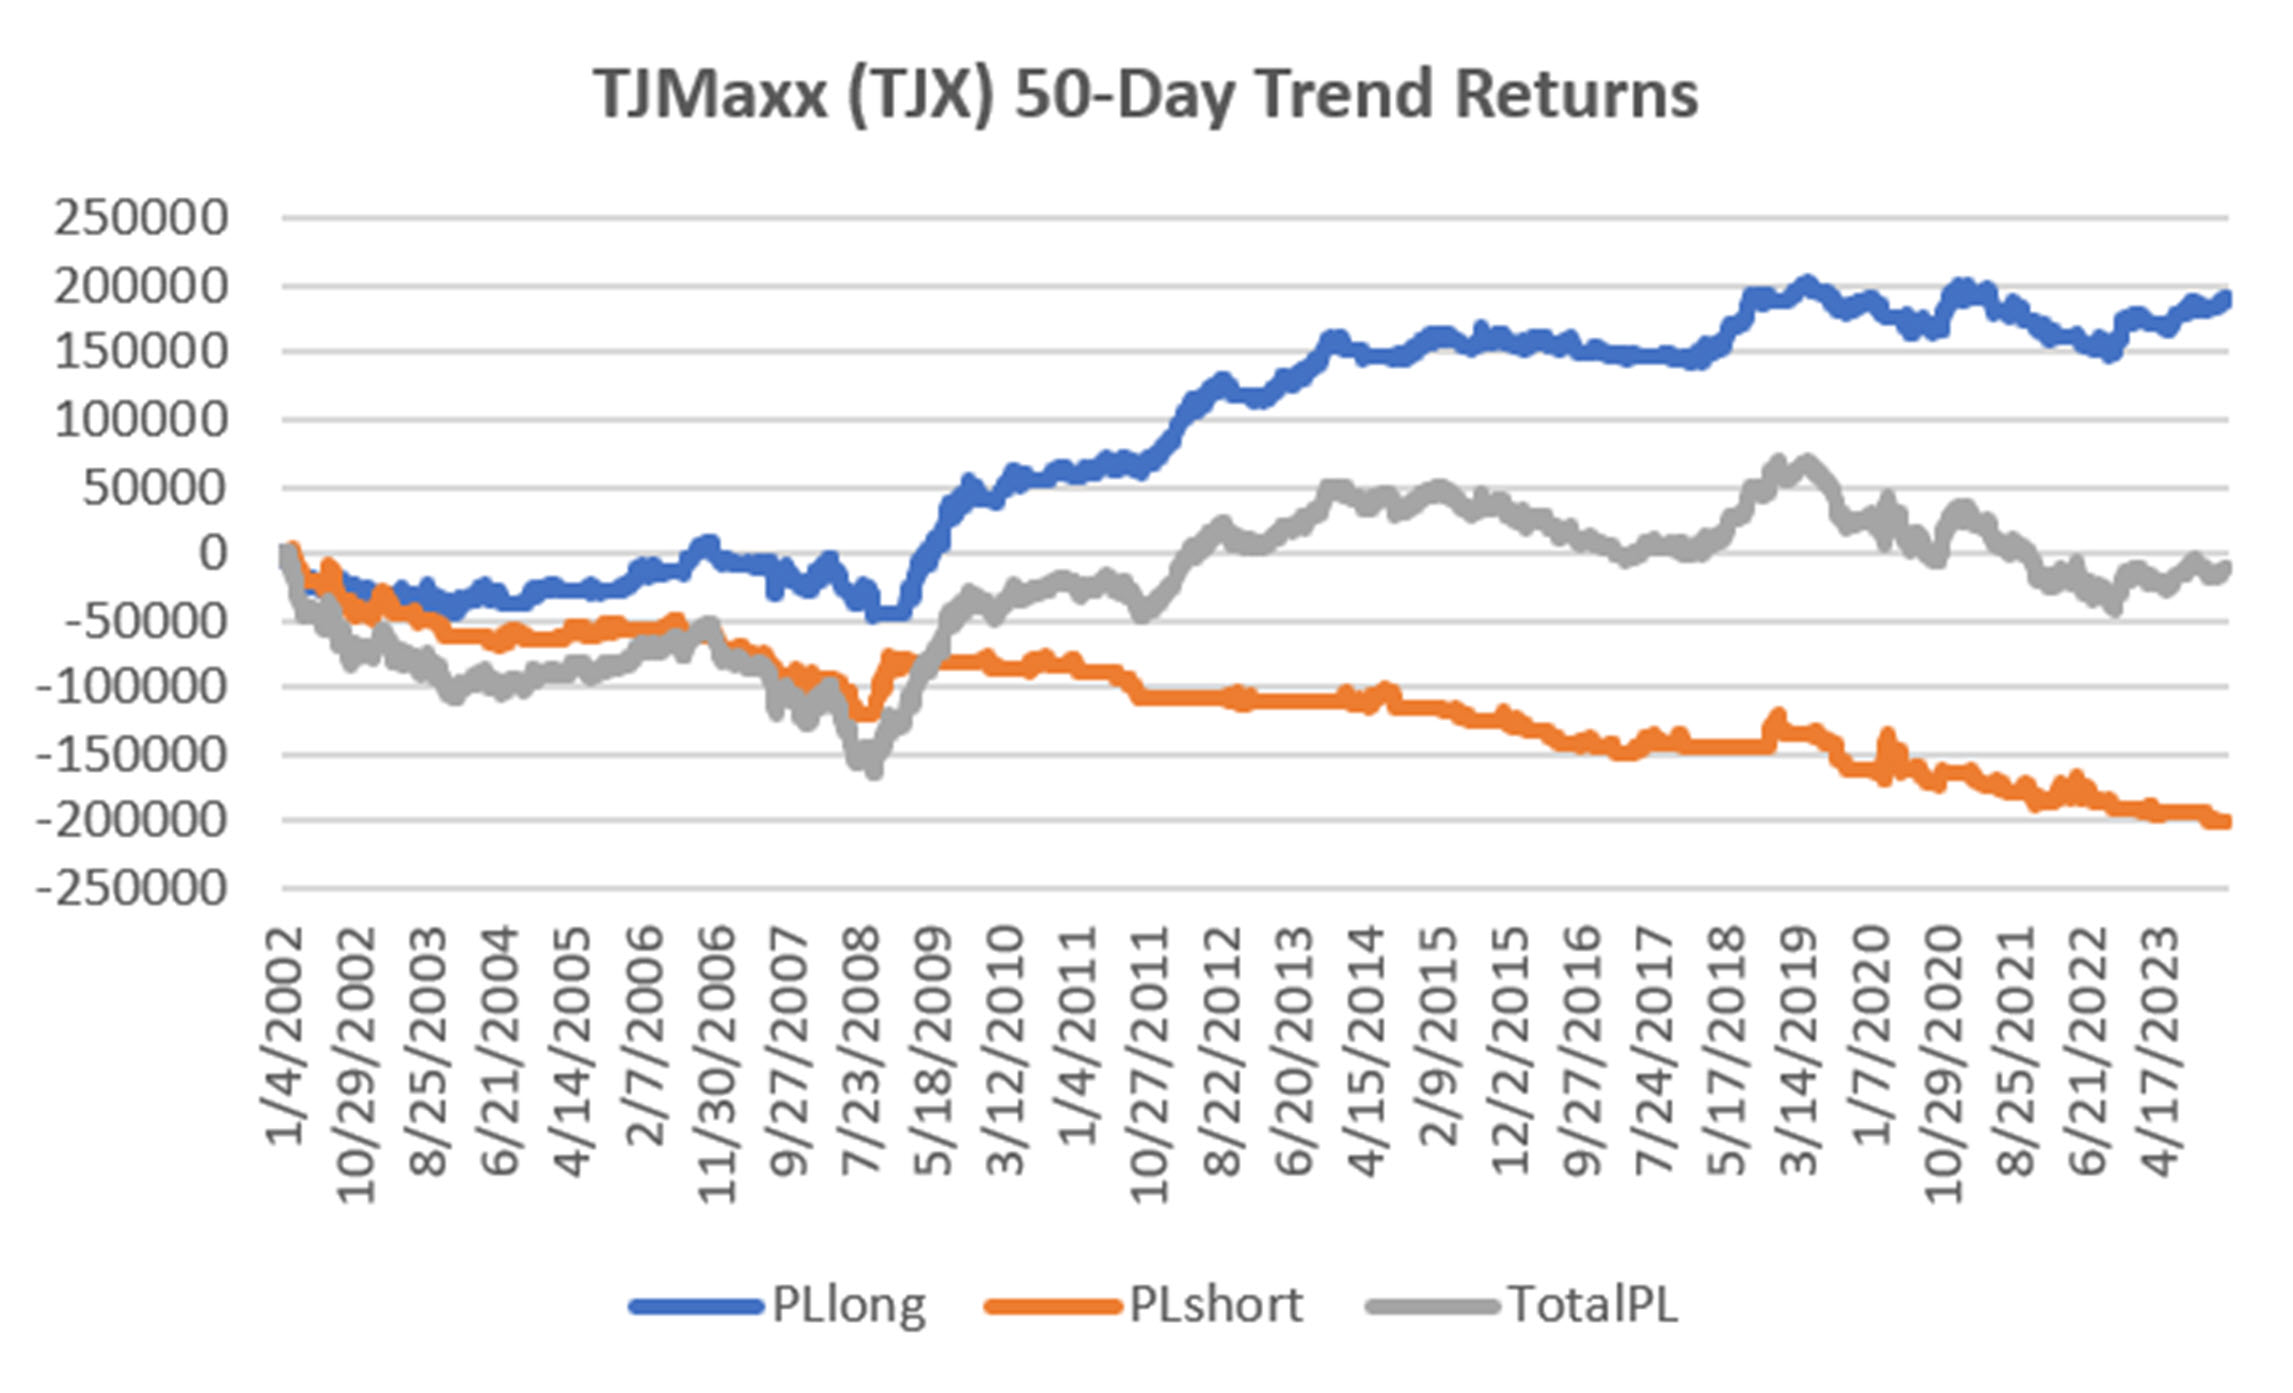
Chart 10. TJ Maxx (TJX) returns using a 50-day moving average.
Using the Best, Avoiding the Worst
Using the efficiency ratio is one way to identify trending from non-trending (or mean reversion). The point is to recognize which markets you need to trade for your preferred system. Even removing one market that doesn’t work can improve your overall performance.
But even the best will have periods that will lose money no matter what system you use. But on balance, using markets that have a history of trending or non-trending should improve your returns.
A Standing Note on Short Sales
Note that the “All Signals” reports show short sales in stocks and ETFs, even though short positions are not executed in the equity portfolios. Our work over the years shows that downturns in the stock market are most often short-lived and it is difficult to capture with a longer-term trend. The upwards bias also works against shorter-term systems unless using futures, which allows leverage. Our decision has been to take only long positions in equities and control the risk by exiting many of the portfolios when there is extreme volatility and/or an indication of a severe downturn.
PORTFOLIO METHODOLOGY IN BRIEF
Both equity and futures programs use the same basic portfolio technology. They all exploit the persistence of performance, that is, they seek those markets with good long-term and short-term returns on the specific system, rank them, then choose the best, subject to liquidity, an existing current signal, with limitations on how many can be chosen from each sector. If there are not enough stocks or futures markets that satisfy all the conditions, then the portfolio holds fewer assets. In general, these portfolios are high beta, showing higher returns and higher risk, but have had a history of consistently outperforming the broad market index in all traditional measures.
PERFORMANCE BY GROUP
NOTE that the charts show below represent performance “tracking,” that is, the oldest results since are simulated but the returns from 2013 are the systematic daily performance added day by day. Any changes to the strategies do not affect the past performance, unless noted. The system assumes 100% investment and stocks are executed on the open, futures on the close of the trading day following the signals. From time to time we make logic changes to the strategies and show how the new model performs.
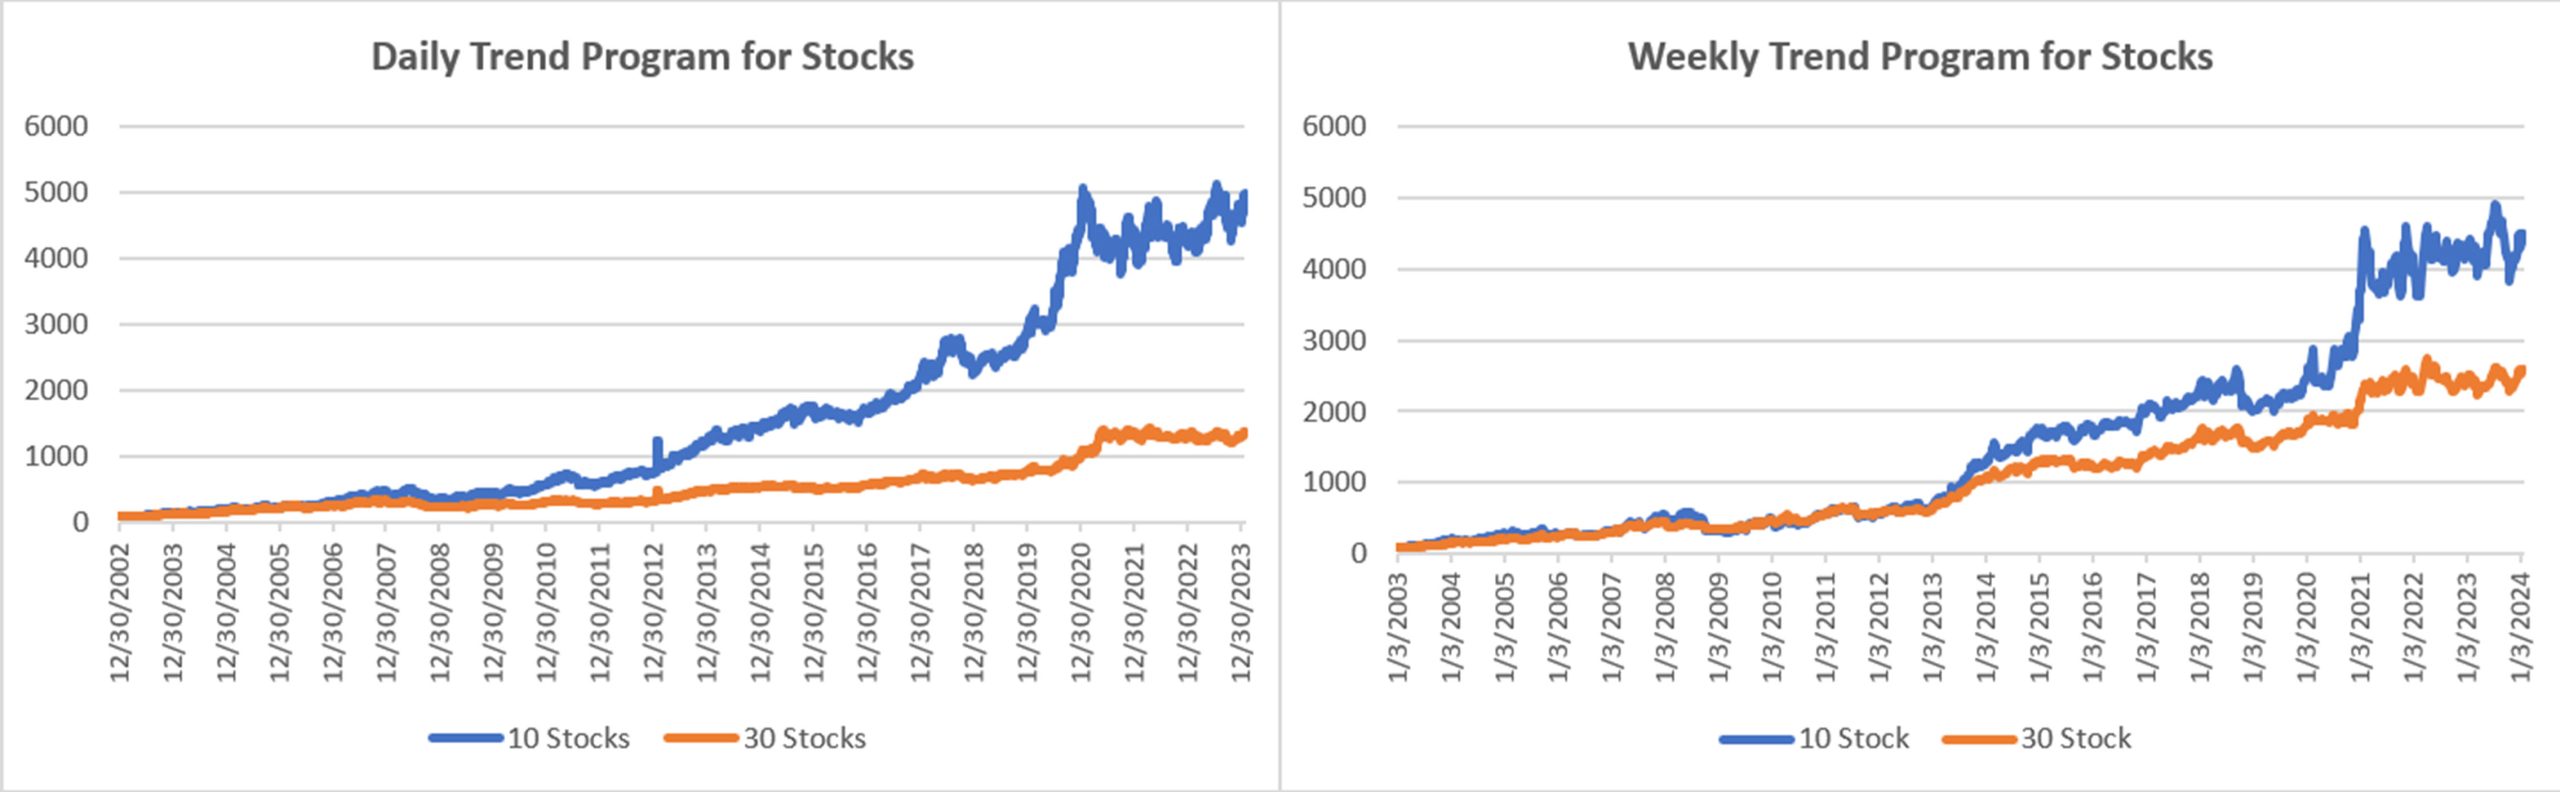
Groups DE1 and WE1: Daily and Weekly Trend Program for Stocks, including Income Focus, DowHedge, and the new Sector Rotation
The Trend program seeks long-term directional changes in markets and the portfolios choose stocks that have realized profitable performance over many years combined with good short-term returns. It will hold fewer stocks when they do not meet our condition and exit the entire portfolio when there is extreme risk or a significant downturn.
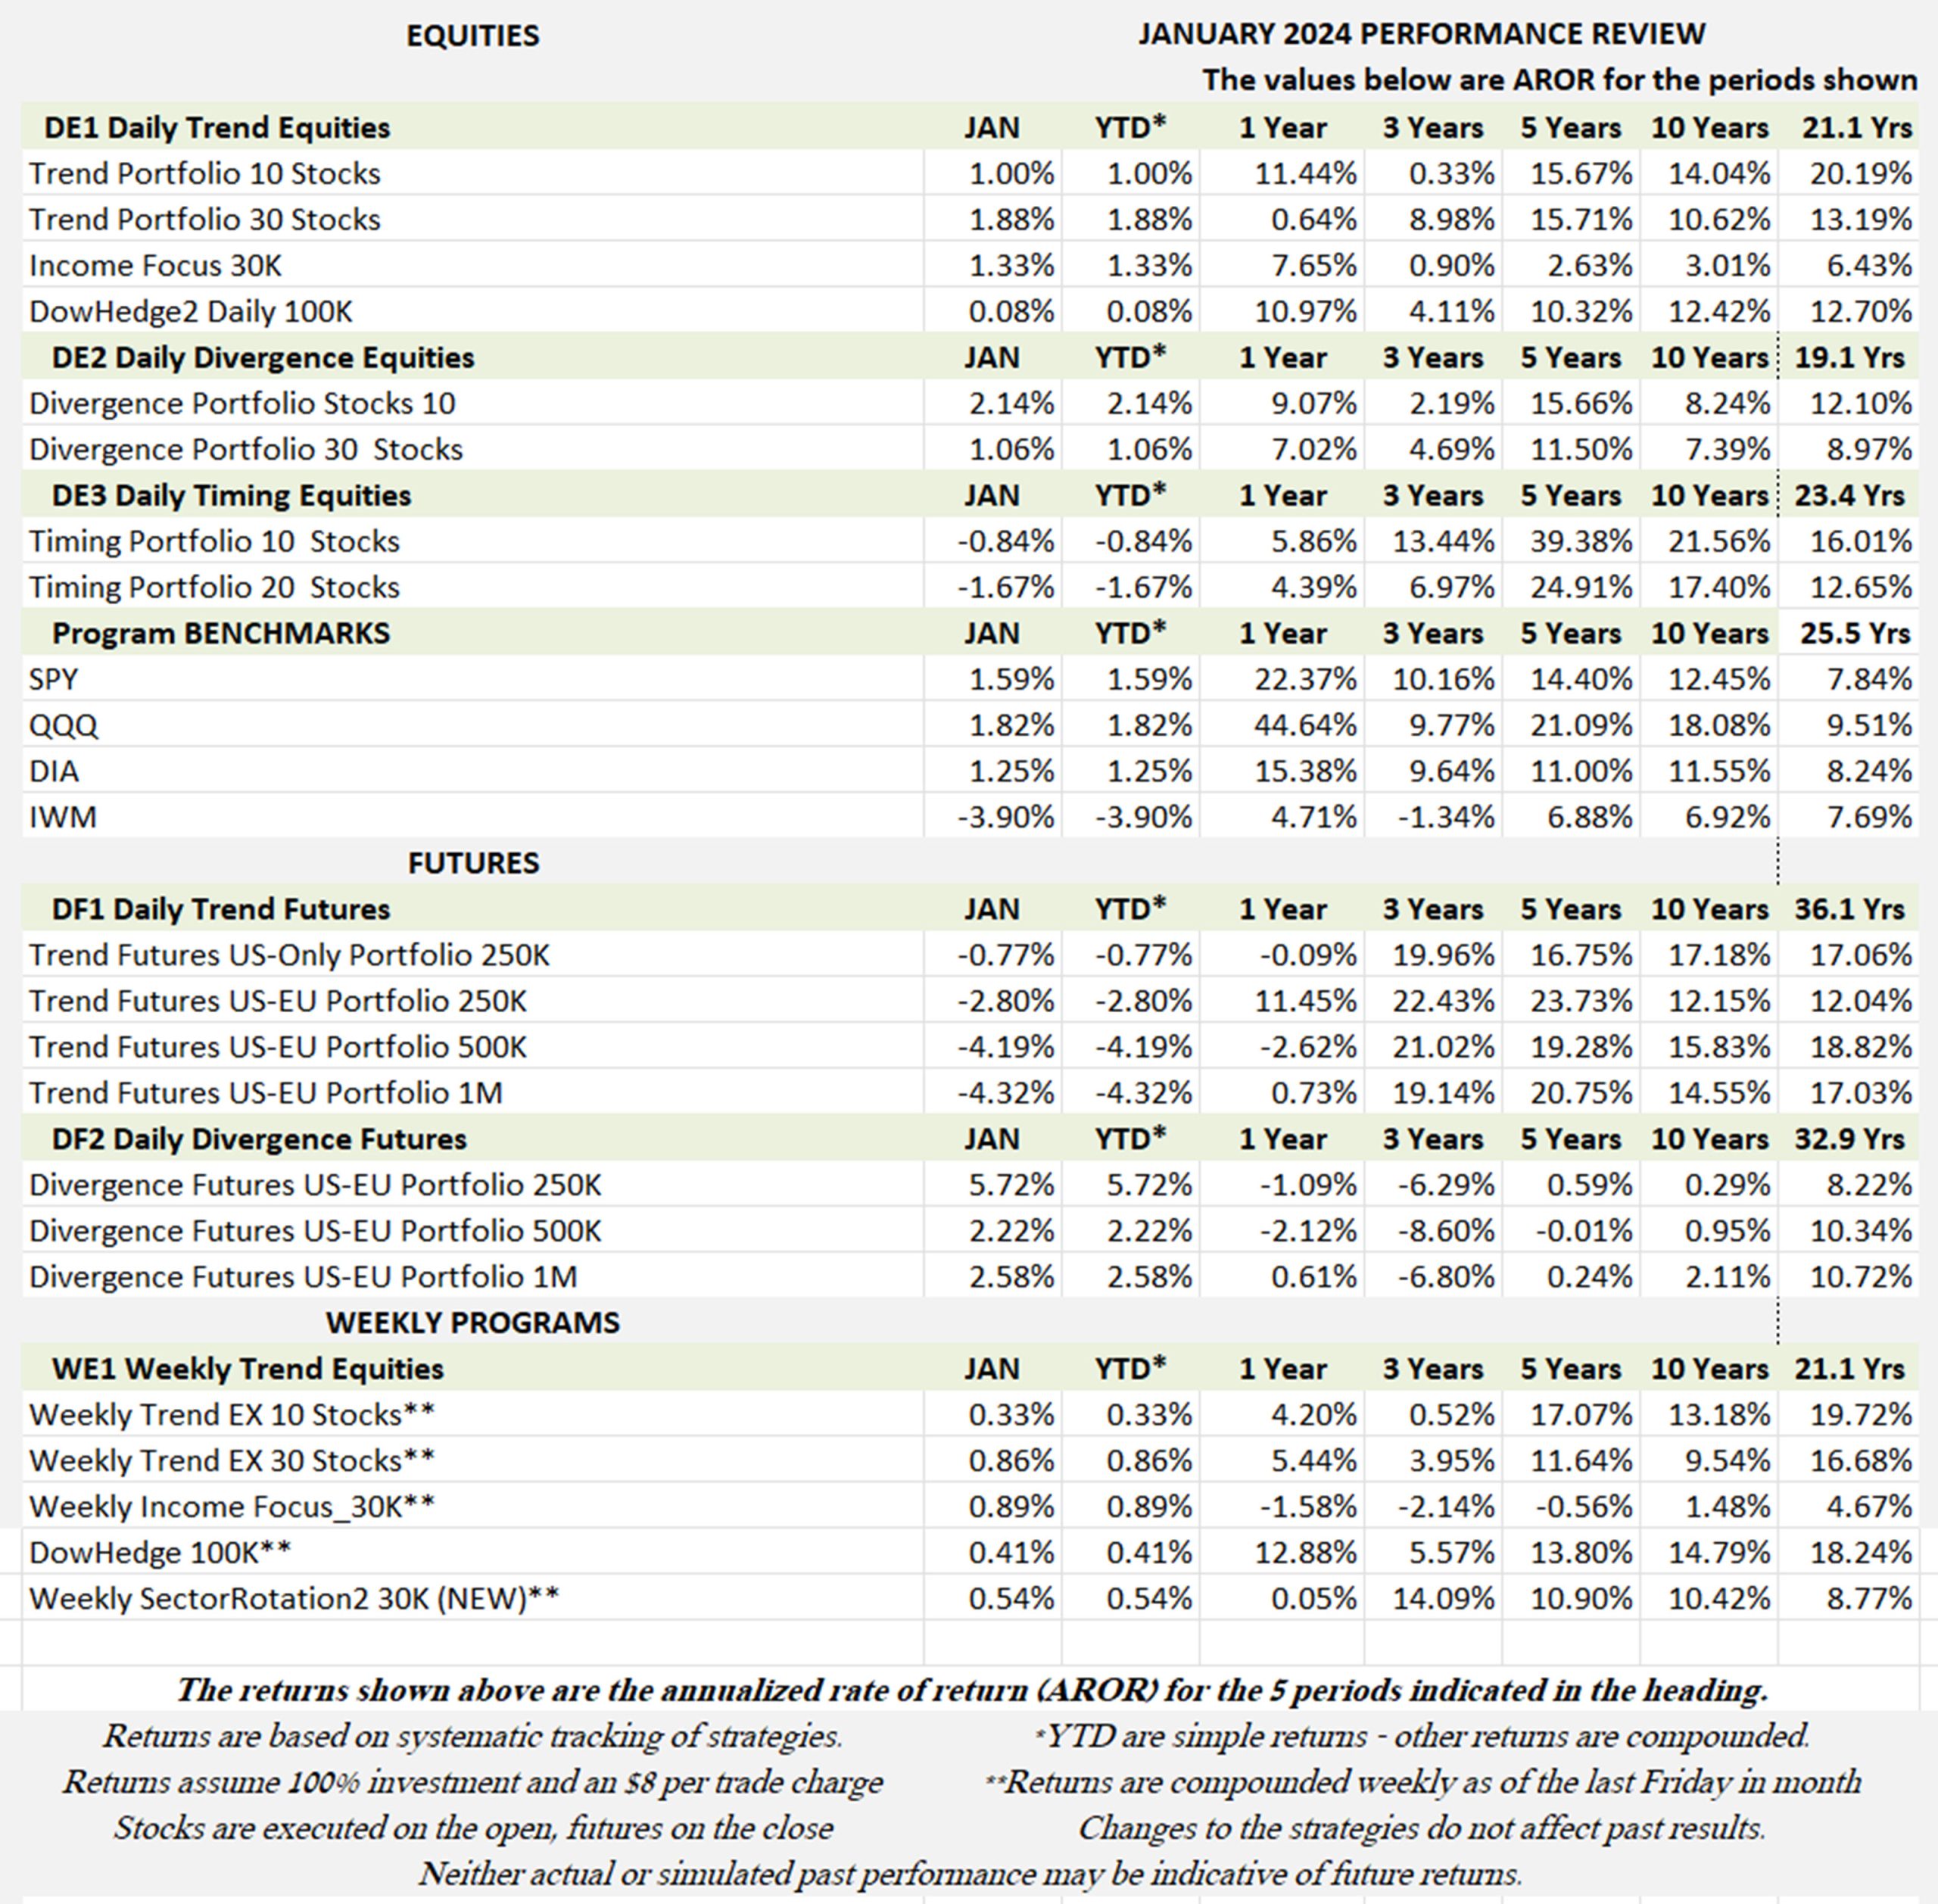
Almost, but not quite new highs. The sell-off on Jan 31 is typically of the January moves. Up, then down, then up. As we said earlier, traders are determined to move prices higher, no matter what the Fed says. Our daily programs made 1% to 2% in January and the Weekly slightly less. We look forward to new highs.
Income Focus and Sector Rotation
I’m not sure that rates are decreasing, but the traders think so. Both programs gained slightly more or less than 1%. It’s been a long wait, but we are expecting a run to the upside. We just don’t know when!
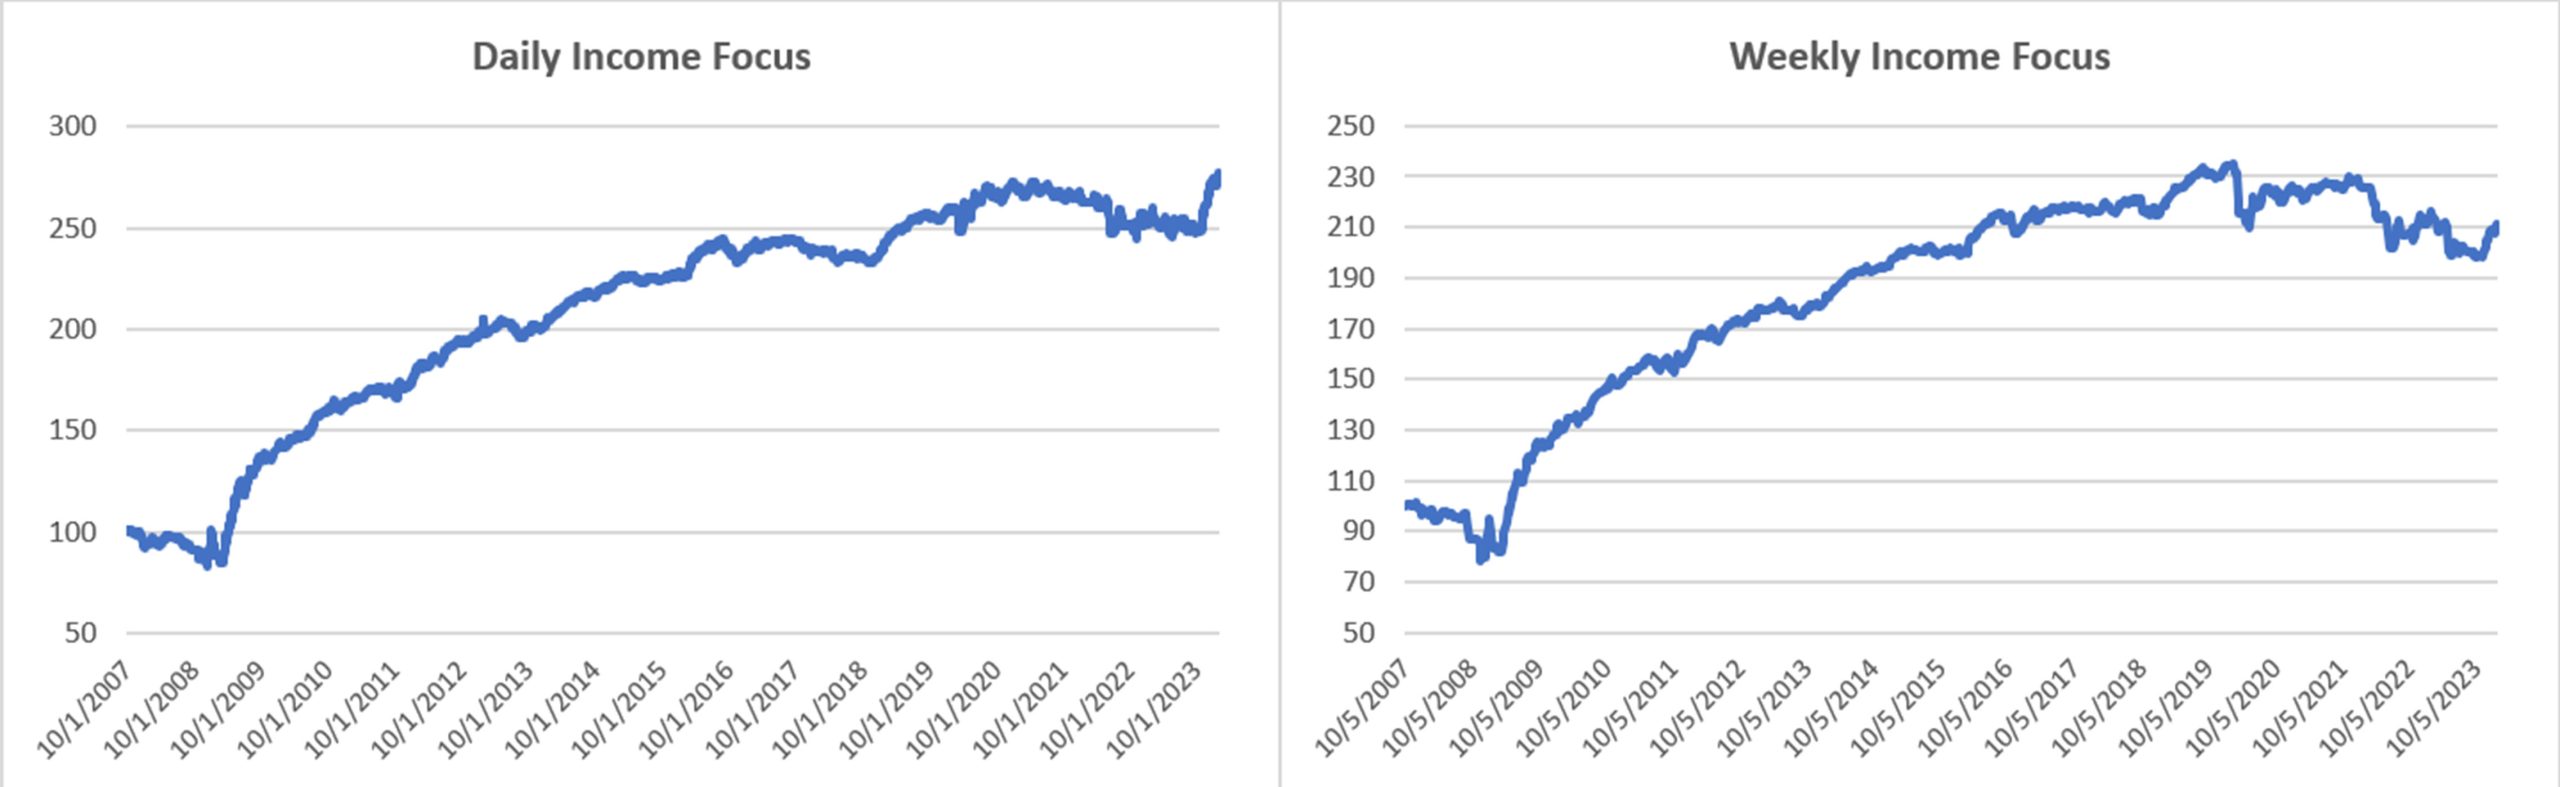
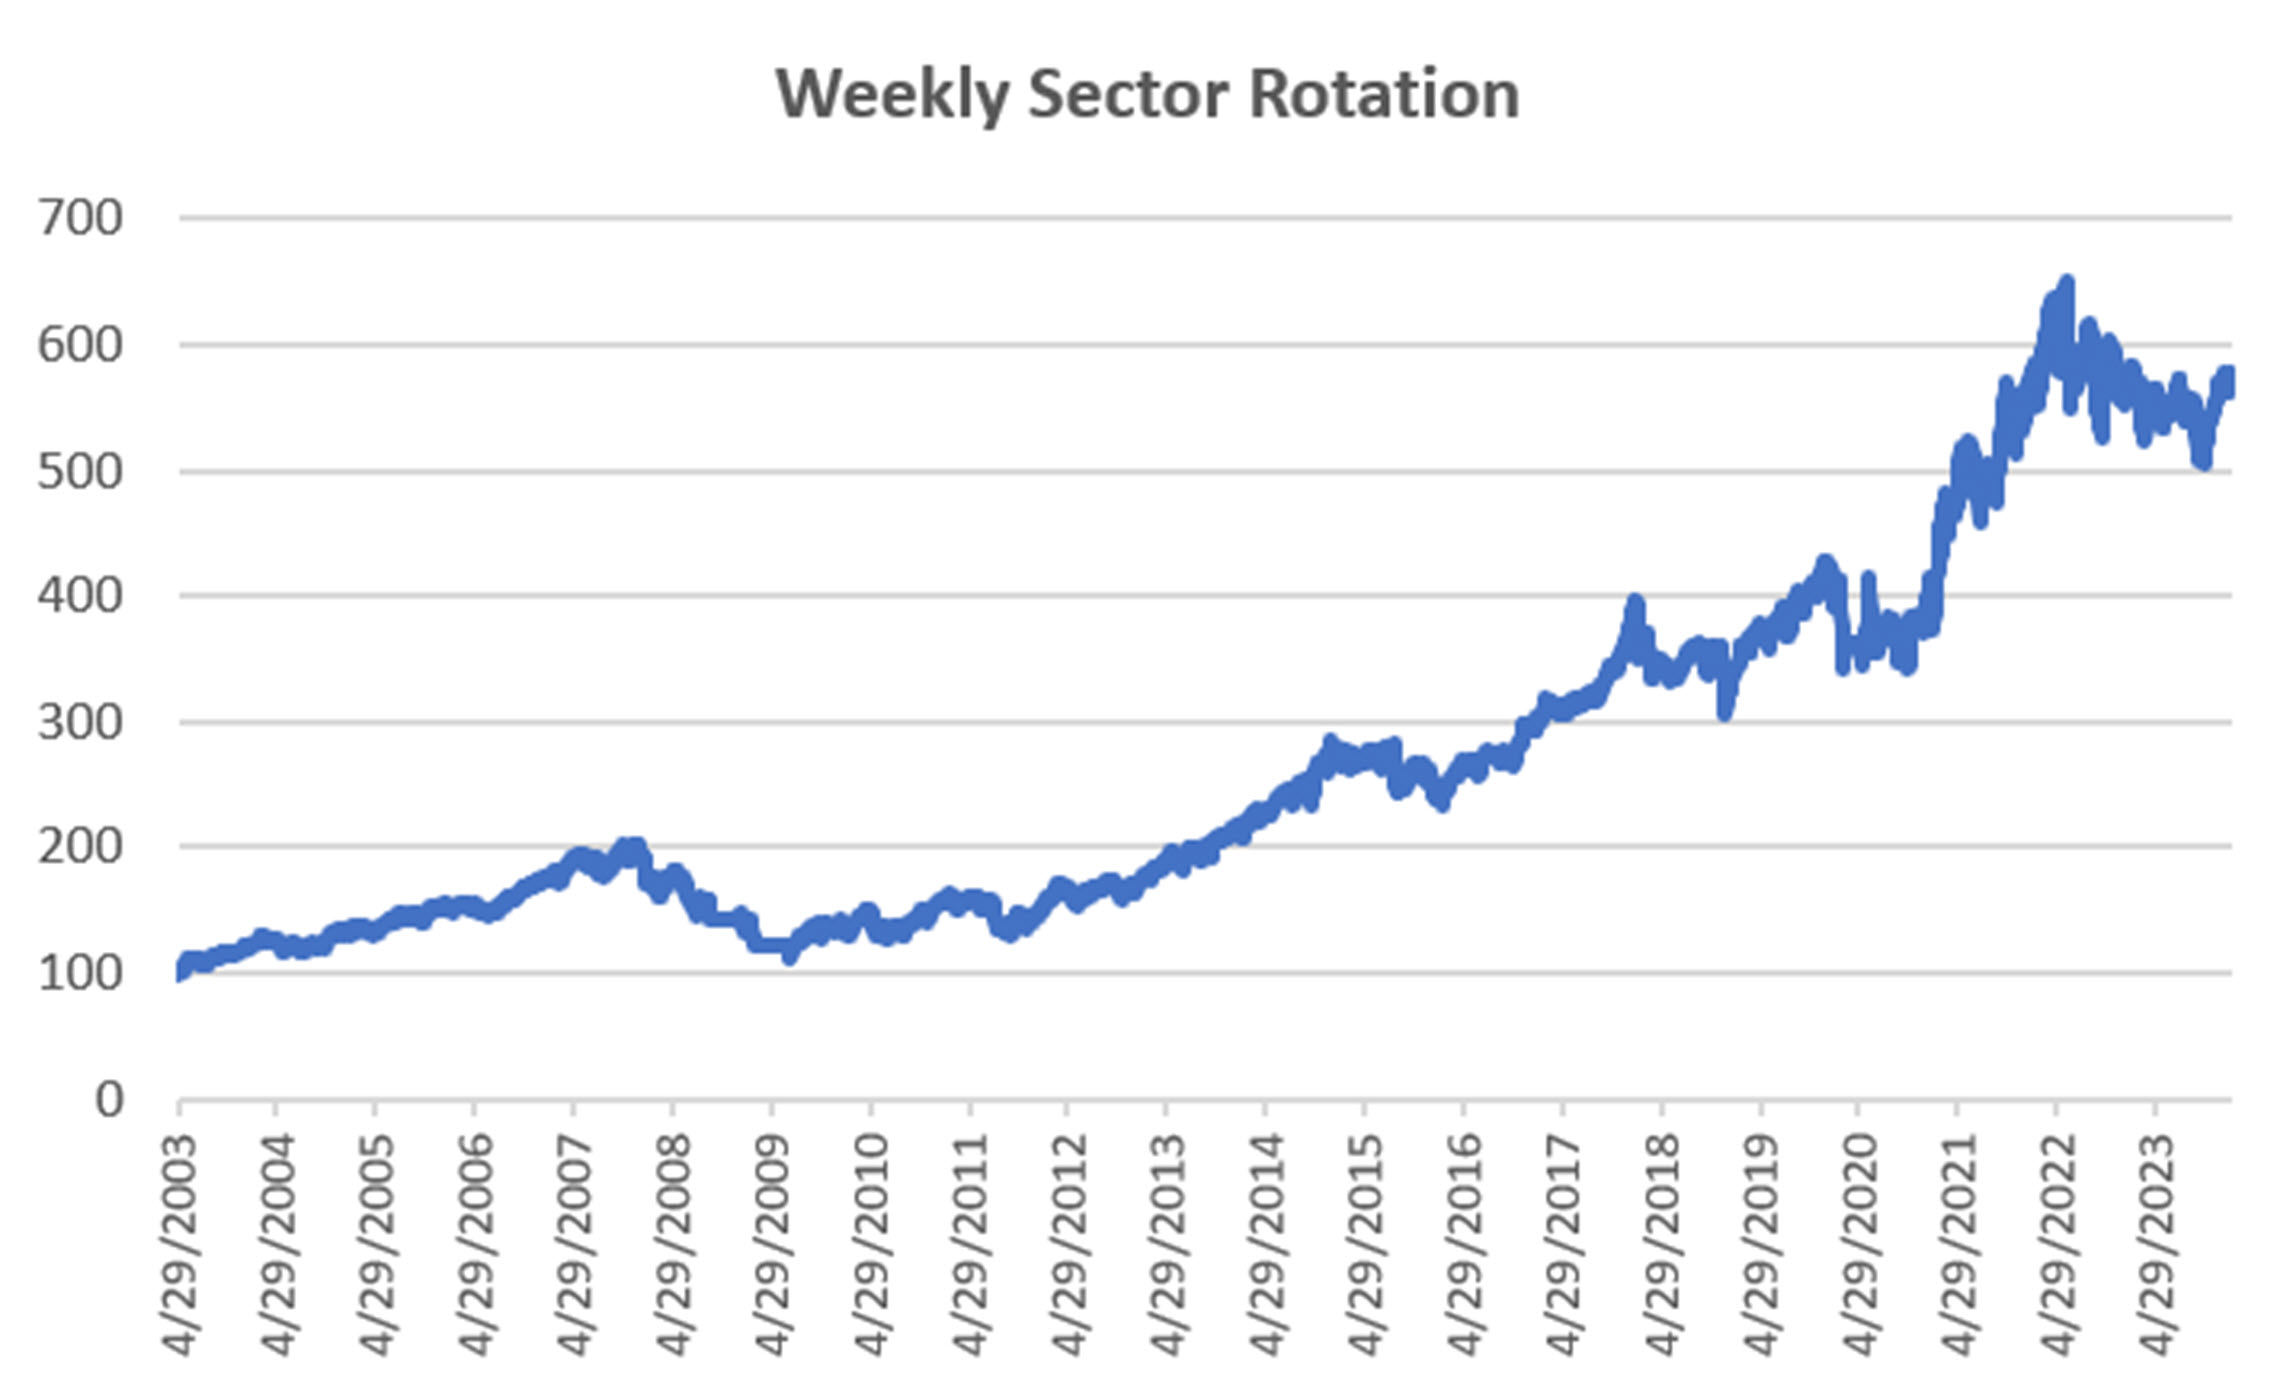
Sector Rotation
Without changing any of its holdings, the Sector Rotation program gain a bit more than 0.54%, none of it technology.
DowHedge Programs
A small gain for both Daily and Weekly DowHedge programs. Much like the S&P, this market was very volatile in January. We consider any gain a good one.

Group DE2: Divergence Program for Stocks
The Divergence program looks for patterns where price and momentum diverge, then takes a position in anticipation of the pattern resolving itself in a predictable direction, often the way prices had moved before the period of uncertainty.
Another sign of a developing trend is when the Divergence program generates a profit. It does that by taking a position in the trend direction when the market pauses. This month the program gained more than 2% in the 10-stock and over 1% in the 30-Stock.

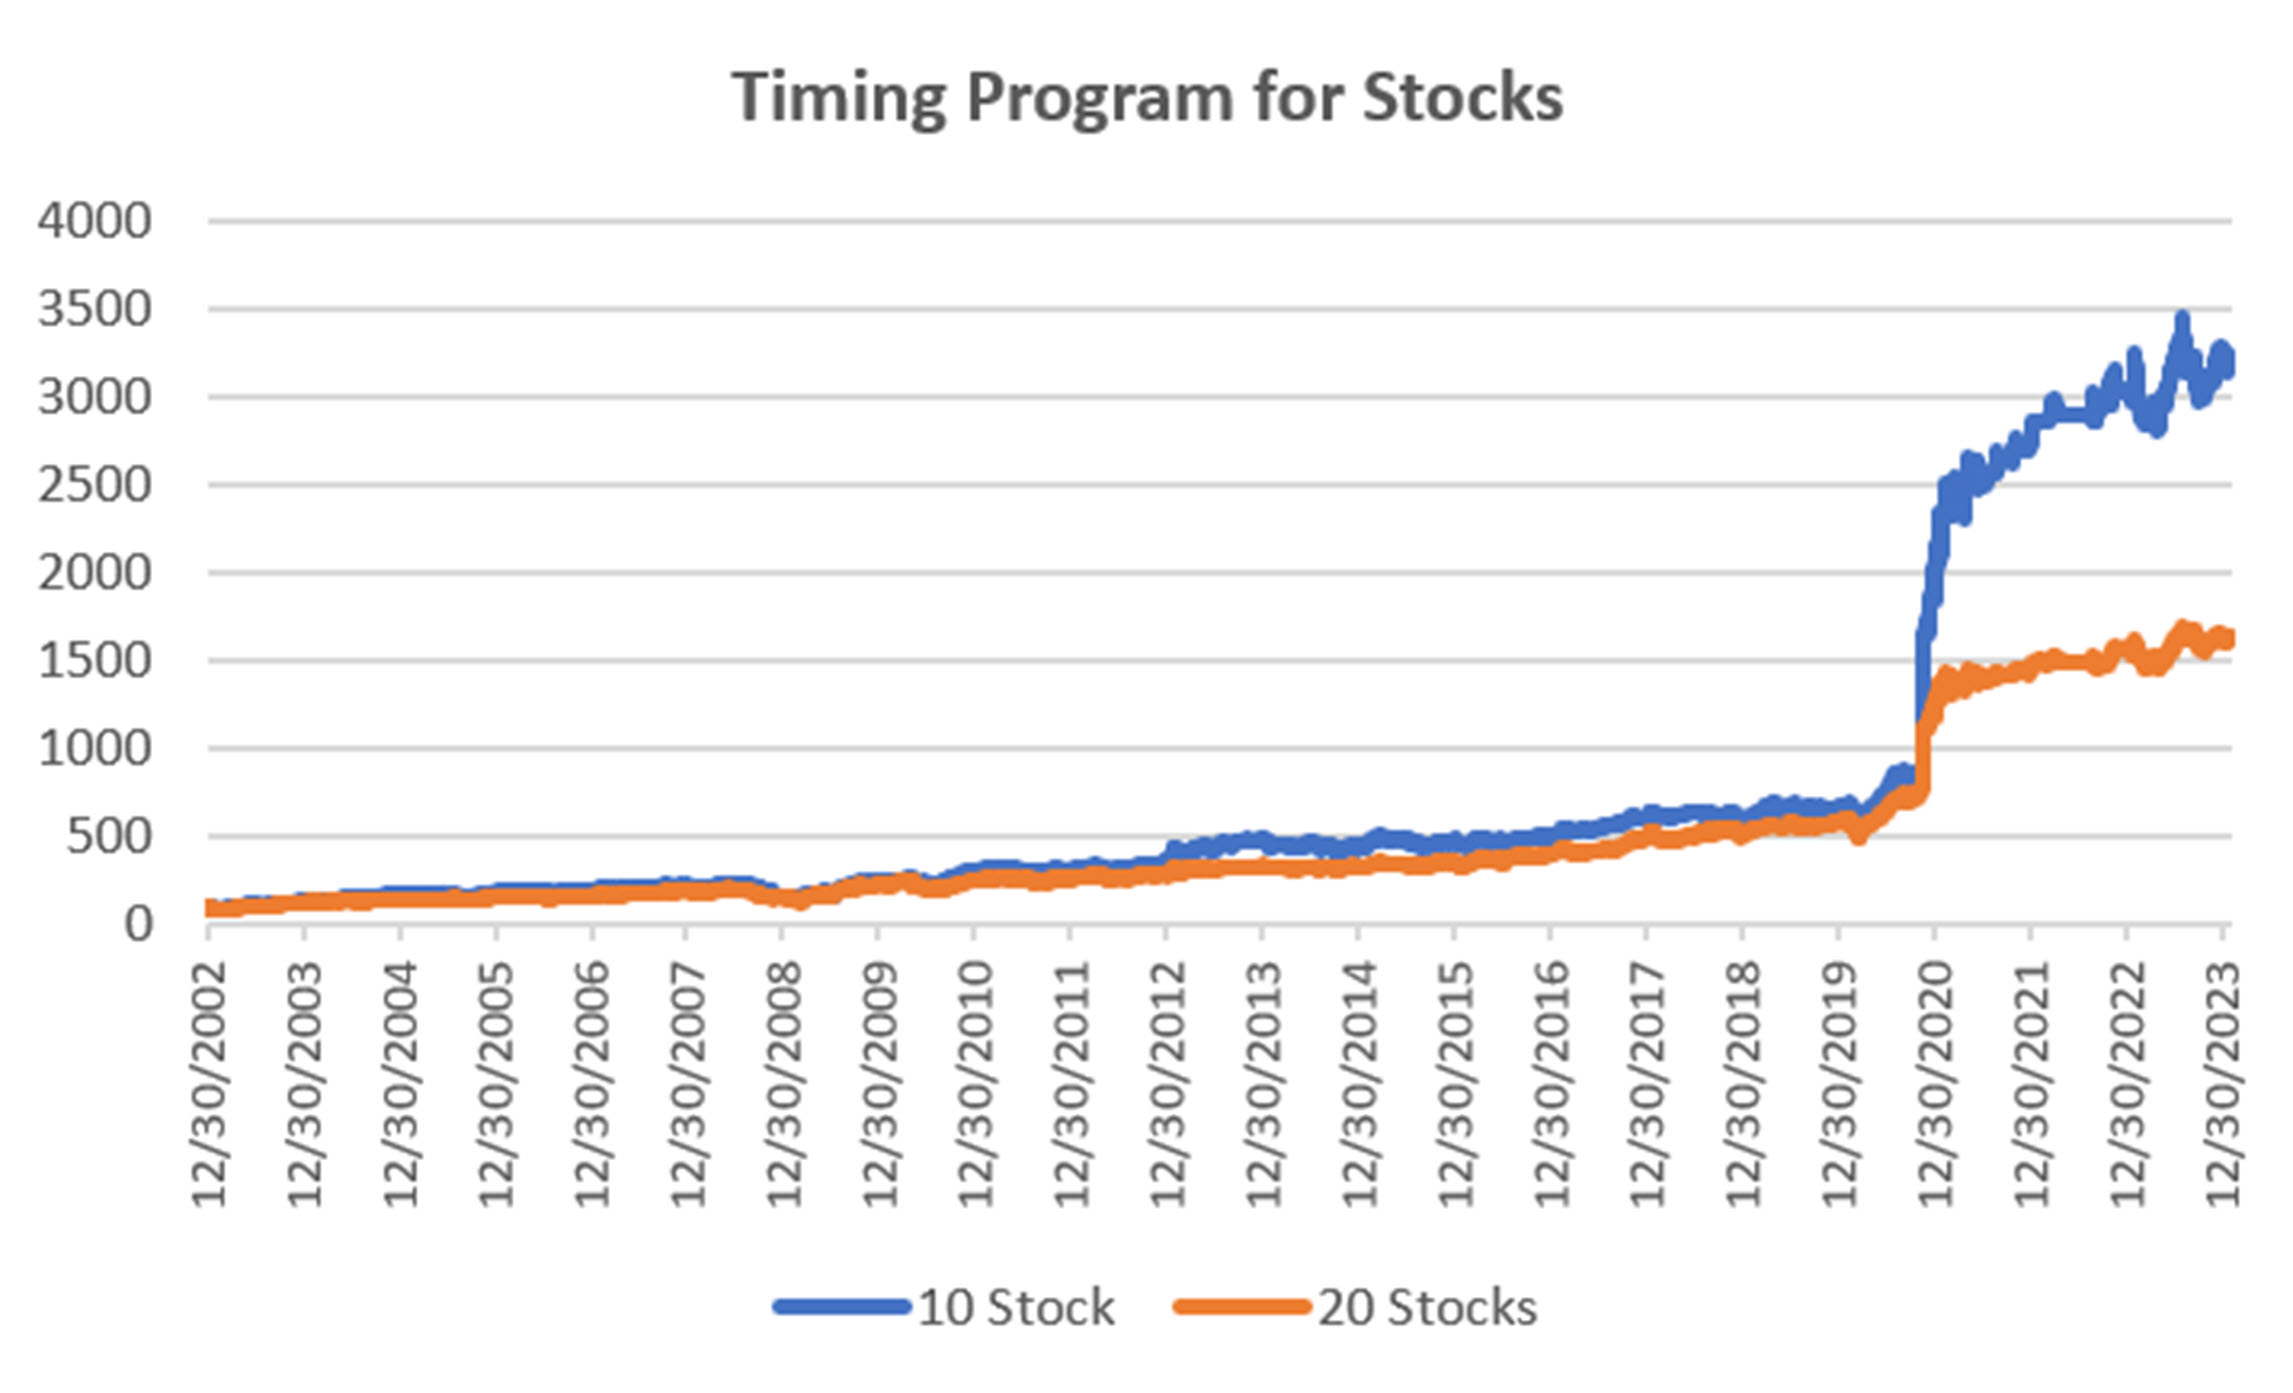
Group DE3: Timing Program for Stocks
The Timing program is a relative-value arbitrage, taking advantage of undervalued stocks relative to its index. It first finds the index that correlates best with a stock, then waits for an oversold indicator within an upwards trend. It exits when the stock price normalizes relative to the index, or the trend turns down. These portfolios are long-only because the upwards bias in stocks and that they are most often used in retirement accounts.
After a good year (relatively speaking) the Timing program had modest losses in January. Its advantage is that it have small drawdowns and small positions until the market starts to move. So far it is doing as expected – waiting.
Futures Programs
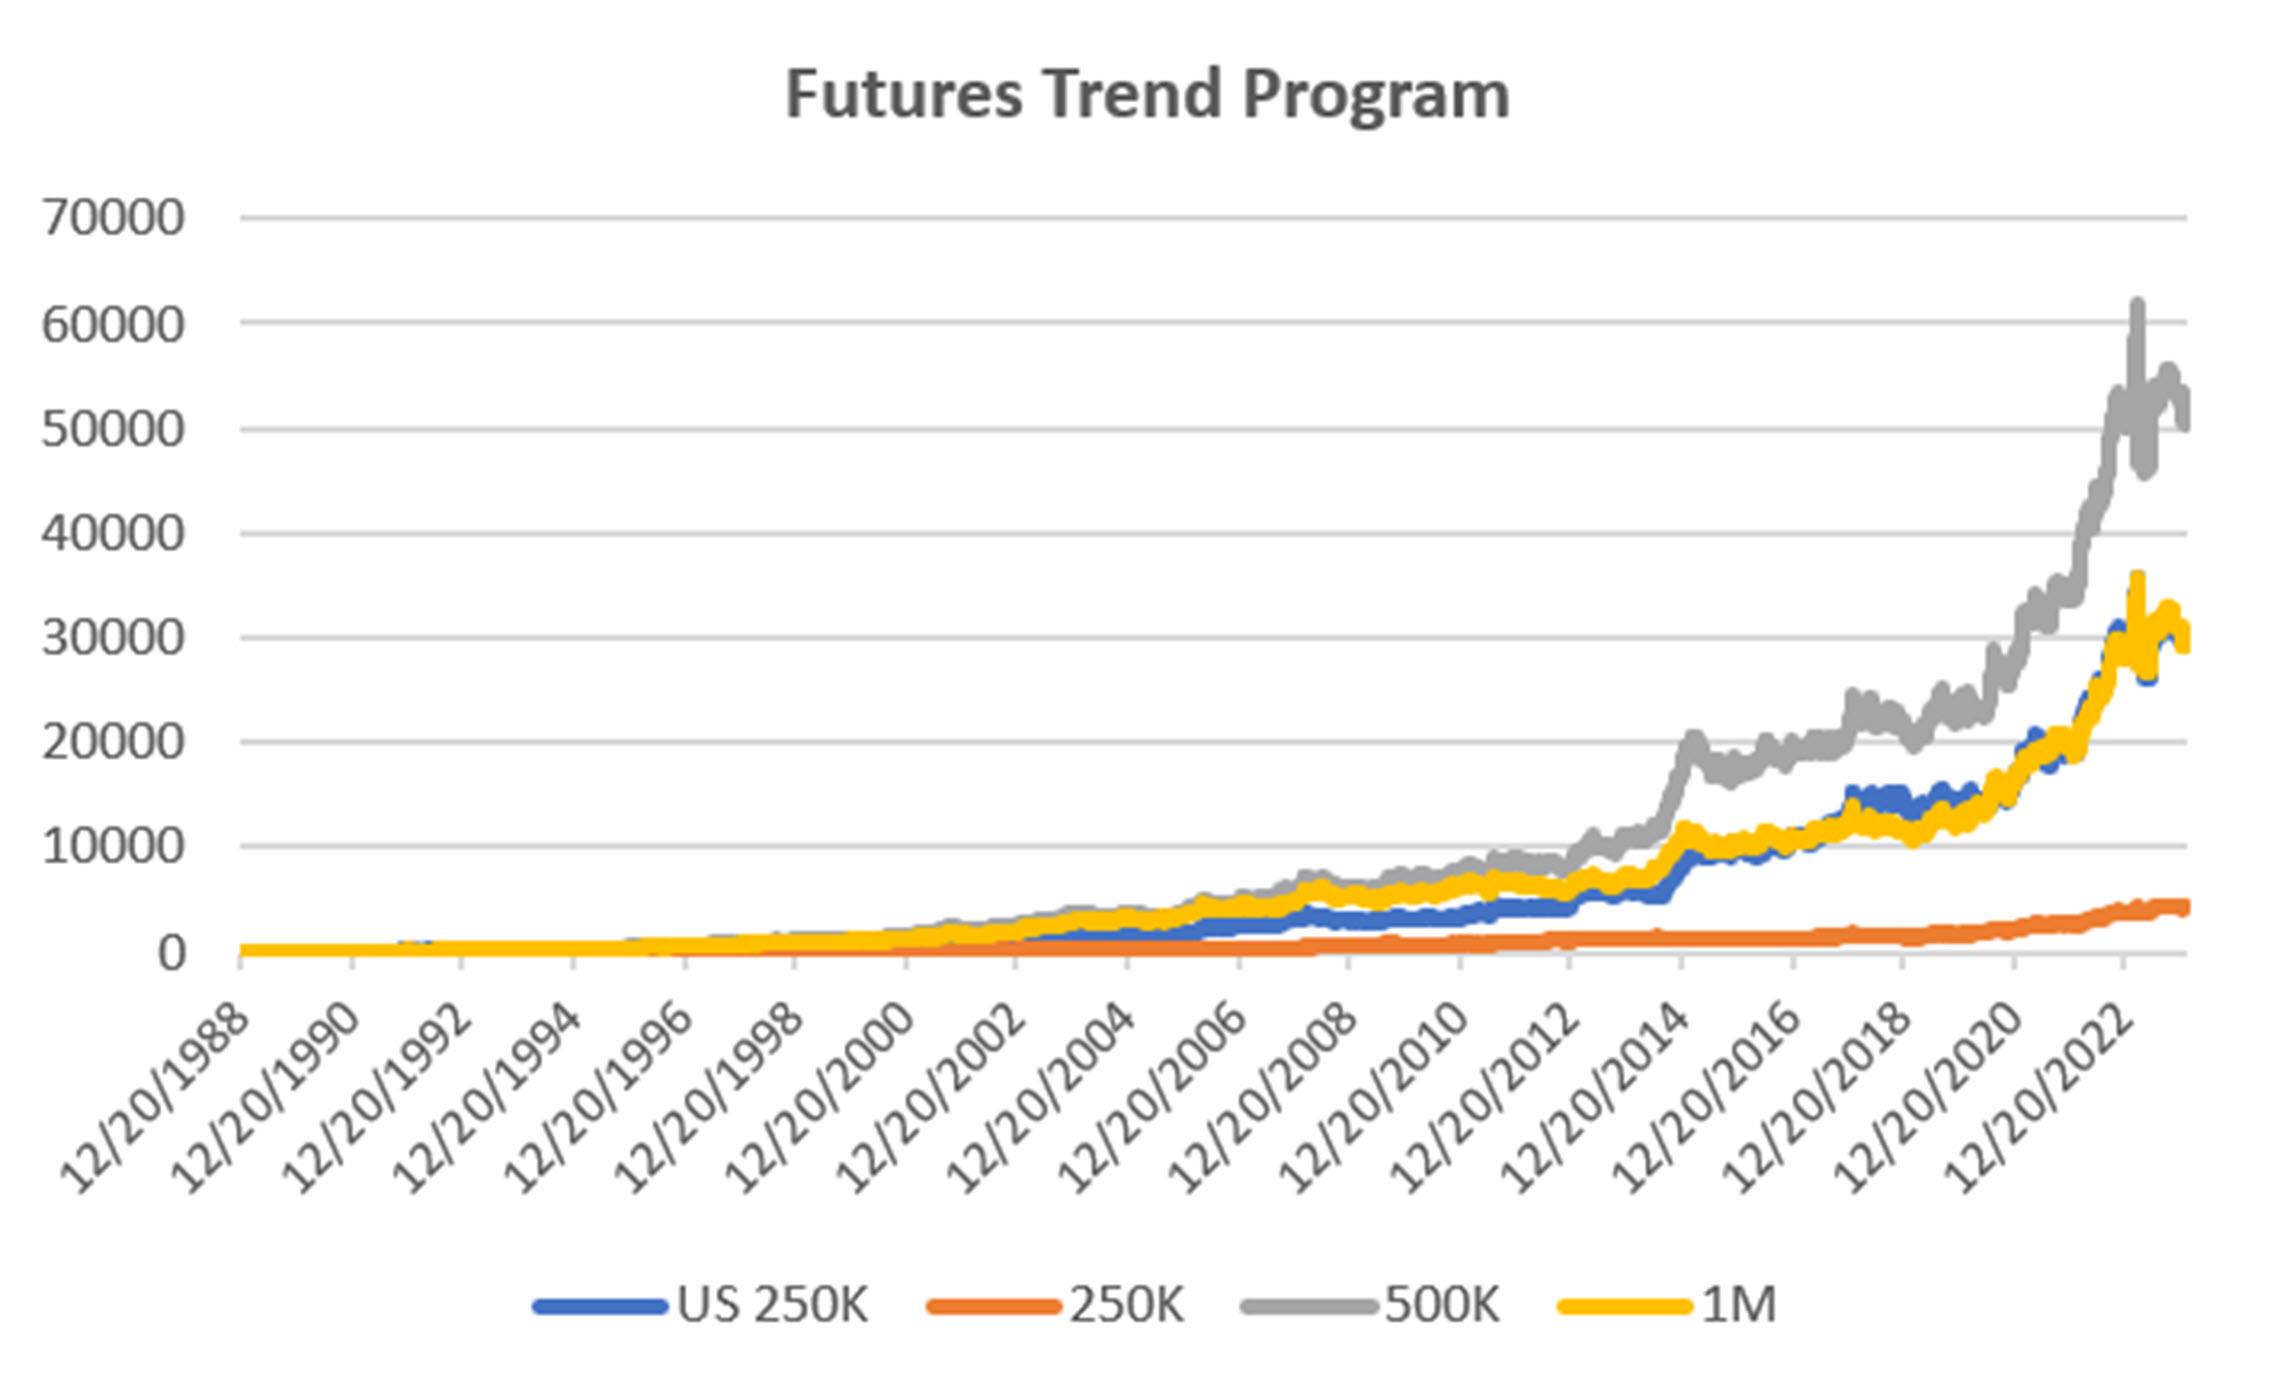
Groups DF1 and WF1: Daily and Weekly Trend Programs for Futures
Futures allow both high leverage and true diversification. The larger portfolios, such as $1million, are diversified into both commodities and world index and interest rate markets, in addition to foreign exchange. Its performance is not expected to track the U.S. stock market and is a hedge in every sense because it is uncorrelated. As the portfolio becomes more diversified its returns are more stable.
The leverage available in futures markets allows us to manage the risk in the portfolio, something not possible to the same degree with stocks. This portfolio targets 14% volatility. Investors interested in lower leverage can simply scale down all positions equally in proportion to their volatility preference. Note that these portfolios do not trade Asian futures, which we believe are more difficult for U.S. investors to execute. The “US 250K” portfolio trades only U.S. futures.
While equities are rallying, futures are languishing. Even at that, the systems have not given up much. Losses ranged from less than 1% to over 4%. As with equities, we expect a decline in interest rates will cause significant trends in both rates, the dollar, and index markets.
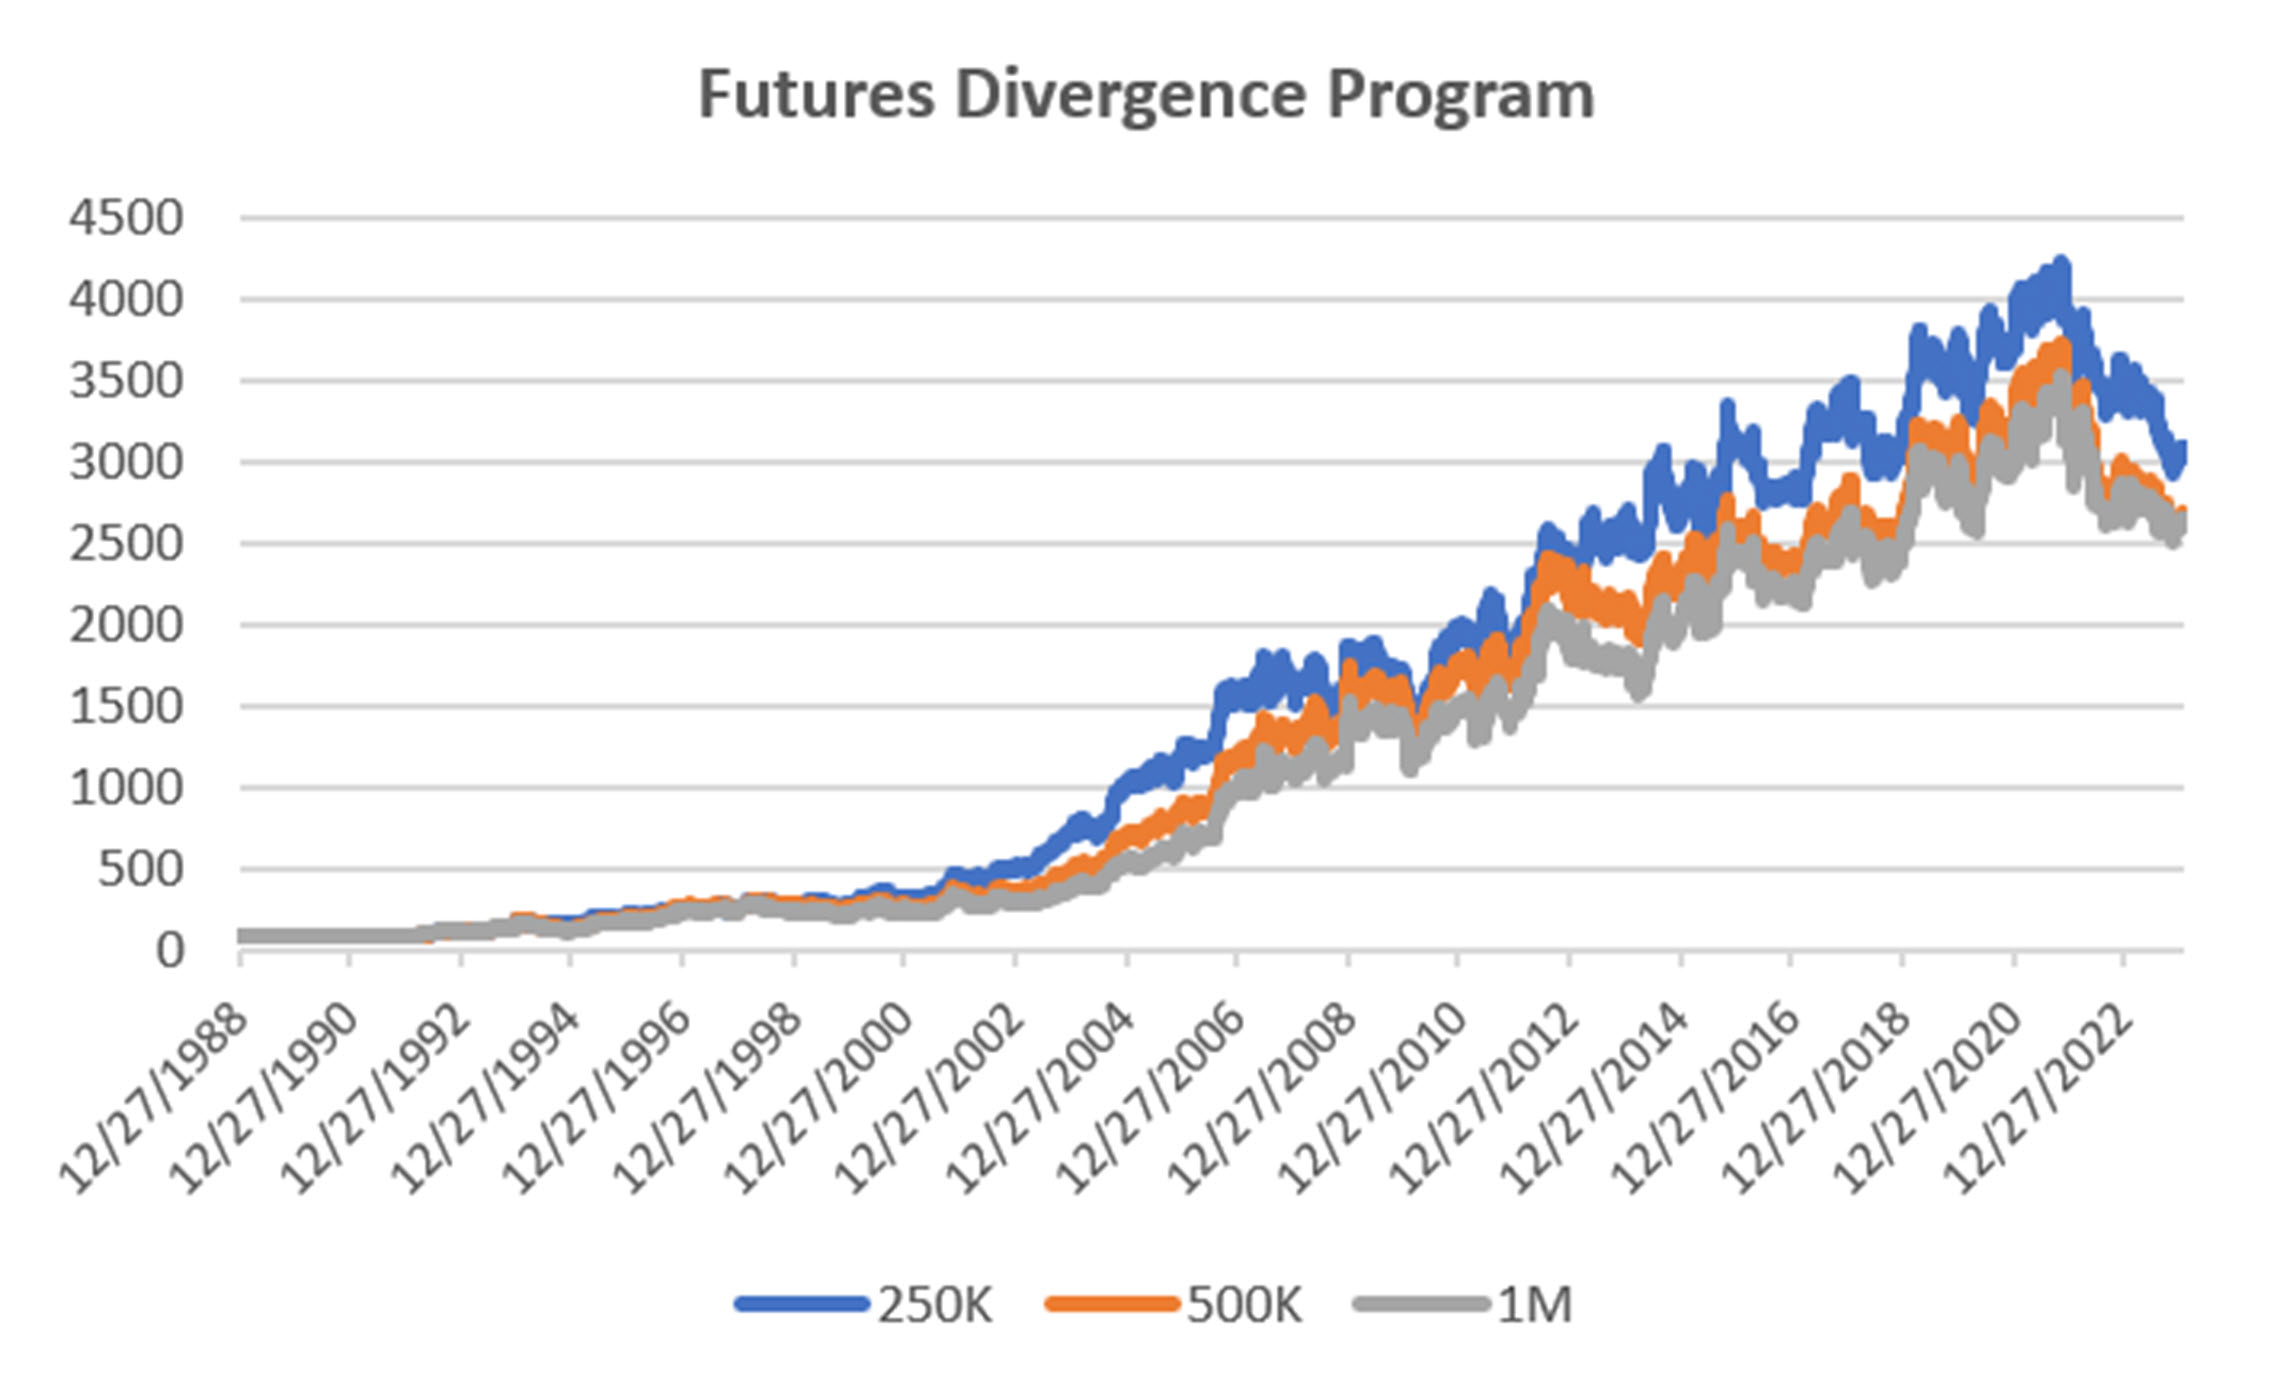
Group DF2: Divergence Portfolio for Futures
It may be difficult to see on the chart, but the Divergence program gained from 2% to over 5%, ending the long decline. Its performance paralleled interest rates, so we hope a rally is in store.
Blogs and Recent Publications
Perry’s books are all available on Amazon or through our website, www.kaufmansignals.com.
January 2024
A new article in February edition of Technical Analysis of Stocks & Commodities, “Crossover Trading: Arbitrating the Physical with the Stock.” A chance at diversification!
Perry posted 3 new articles on Seeking Alpha in December, “Where Do You Take Profits?”, “Is There a Better Day to Enter the Market,” and “Watching January Returns.”
Another article in Technical Analysis of Stocks & Commodities, “Gap Momentum,” another interesting way to identify the trend.
December 2023
Perry posted 3 new articles on Seeking Alpha, “Where Do You Take Profits?”, “Is There a Better Day to Enter the Market,” and “Watching January Returns.”
This month Technical Analysis of Stocks & Commodities published “A Strategy For Trading Seasonal and Non-Seasonal Market.” Turns out that most markets are non-seasonal!
November 2023
Perry posted two articles on Seeking Alpha, “Compression Breakout: Giving a Boost to Your Entries,” and “Volatility: The Second Most Important Indicator.” In addition, he interview Herb Friedman in Technical Analysis of Stocks & Commodities. Herb is a interest rate specialist focusing on low risk investments.
October 2023
In this month’s Technical Analysis of Stocks & Commodities Perry shows how Merger Arb works and how an investor can participate in it. Merger Arb has been the realm of Institutions, but there are opportunities for everyone.
August 2023
Two(!) new articles by Perry in the August issue of Technical Analysis of Stocks & Commodities. The first is a look at how ChatGPT might help traders. It even asks for a computer program to use trend following.
The second article is “Portfolio Risk Dilemma,” where Perry answers the question of whether to let a stock or futures profit run or rebalance, and whether you should do the same for a diversified portfolio.
June 2023
Another article in Technical Analysis, “Protecting Your Wealth While Making a Profit.” It shows that moving money into different world equity markets can take advantage of momentum in both price and exchange rates.
May 2023
A new post on Seeking Alpha, “Profiting From Green Energy – But Not EVs” on May 31. Shows which stocks are best for investing in energy given the moving targets.
April 2023
On April 18th, Perry gave a webinar to the Society of Technical Analysts (London) on how to develop and test a successful trading system. Check their website for more details, https://www.technicalanalysts.com..
The April issue of Technical Analysis of Stocks & Commodities published a new article by Perry, “Repatriation,” an interesting trading pattern used by FX traders but adapted for us “normal traders.”
March 2023
Perry was interviewed by Mark Ursell of Ursell of TradeInform on March 3. You can see it or listen to it on UTube https://www.youtube.com/watch?v=9gIlIIzngCk.
A new article by Perry, “Can Volume Predict Price?” in the March issue of Technical Analysis of Stocks & Commodities. You’ll need to read it to find out!
February 2023
The February 2023 issue of Technical Analysis of Stocks & Commodities published Perry’s article, “Do Small Price Changes Matter?” It tells you whether you should be ignoring those days when prices close up or down by a fraction.
Perry gave a webinar to Eduardo Lopez’ Robotrader students in Spain on Wednesday, February 8, noon (New York).
Older Items of Interest
Perry’s webinar on risk, given to the U.K. Society of Technical Analysts, can be seen using the following link: https://vimeo.com/708691362/04c8fb70ea
For older articles please scan the websites for Technical Analysis of Stocks & Commodities, Modern Trader, Seeking Alpha, ProActive Advisor Magazine, and Forbes. You will also find recorded presentations given by Mr. Kaufman at BetterSystemTrader.com, TalkingTrading.com, FXCM.com, systemtrade.pl, the website for Alex Gerchik, Michael Covel’s website, TrendFollowing.com, and Talking Trading.com.
In May 2021, Mr. Kaufman gave a 30-minute presentation, “Lagged Trends,” for The Money Show on Tuesday, May 11. You can see it using the following link: https://youtu.be/bh2fA8oBwBk
You will also find back copies of our “Close-Up” reports on our website, www.kaufmansignals.com. You can address any questions to perry at kaufmansignalsdaily@gmail.com.
© January 2024, Etna Publishing, LLC. All Rights Reserved.