

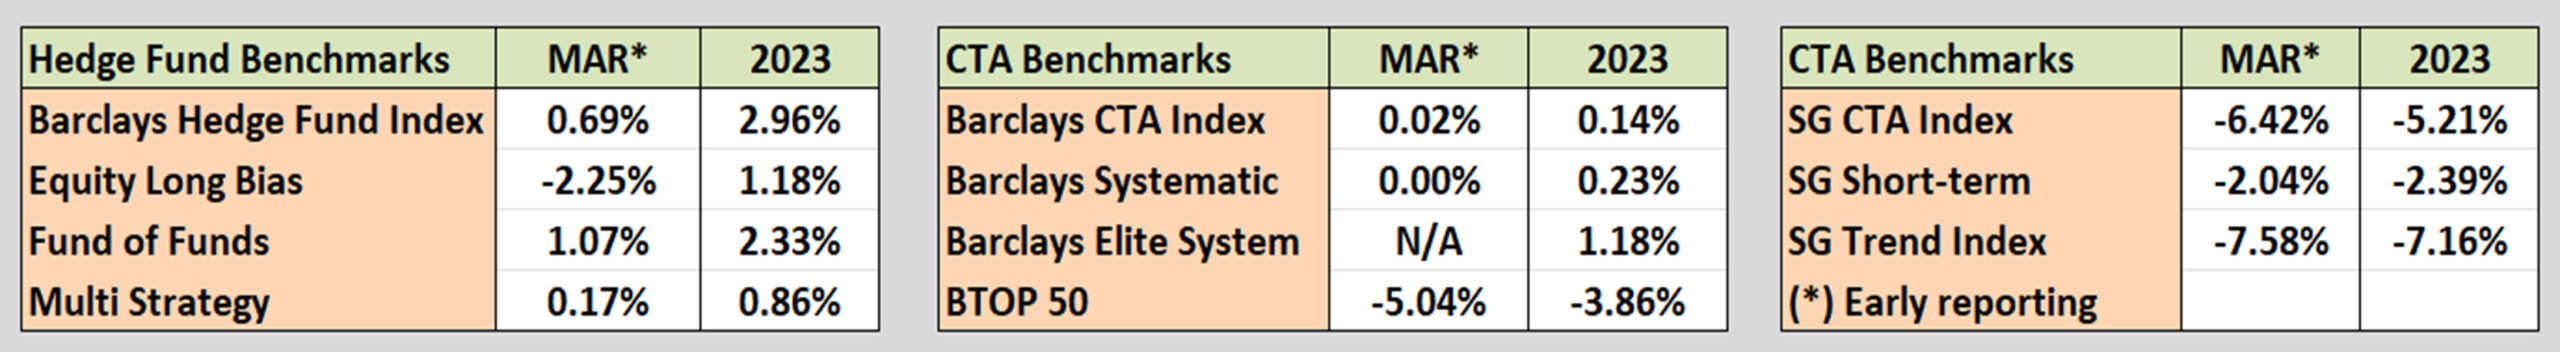
Industry Benchmark Performance
Equities are holding on to small gains through March, while futures show the results of the surprising Fed announcement, at least the BTOP 50 and SG. We expect the other CTAs are dragging their feet before posting their poor returns. We are sympathetic, but it’s time to move on.
Kaufman’s Most Popular Books (available on Amazon)
Trading Systems and Methods, 6th Edition. The complete guide to trading systems, with more than 250 programs and spreadsheets. The most important book for a system developer.
Kaufman Constructs Trading Systems. A step-by-step manual on how to develop, test, and trade an algorithmic system.
Learn To Trade. Written for both serious beginners and practiced traders, this book includes chart formations, trends, indicators, trading rules, risk, and portfolio management. You can find it in color on Amazon.
You can also find these books on our website, www.kaufmansignals.com.
Blogs and Recent Publications
Find Mr. Kaufman’s other recent publications and seminars at the end of this report. We post new interviews, seminars, and reference new articles by Mr. Kaufman each month.
March Performance in Brief
A reversal of February’s returns, with equities doing well and futures taking a big hit on the Fed announcement. There is no way to prepare for a price shock and our program reacted the same way as the other Futures funds. The good news is that we had more than a 10% gain before the report, so the net result is manageable. Funds that were heavily invested in interest rates were not as fortunate. See more detail in the Futures Trend performance further down.
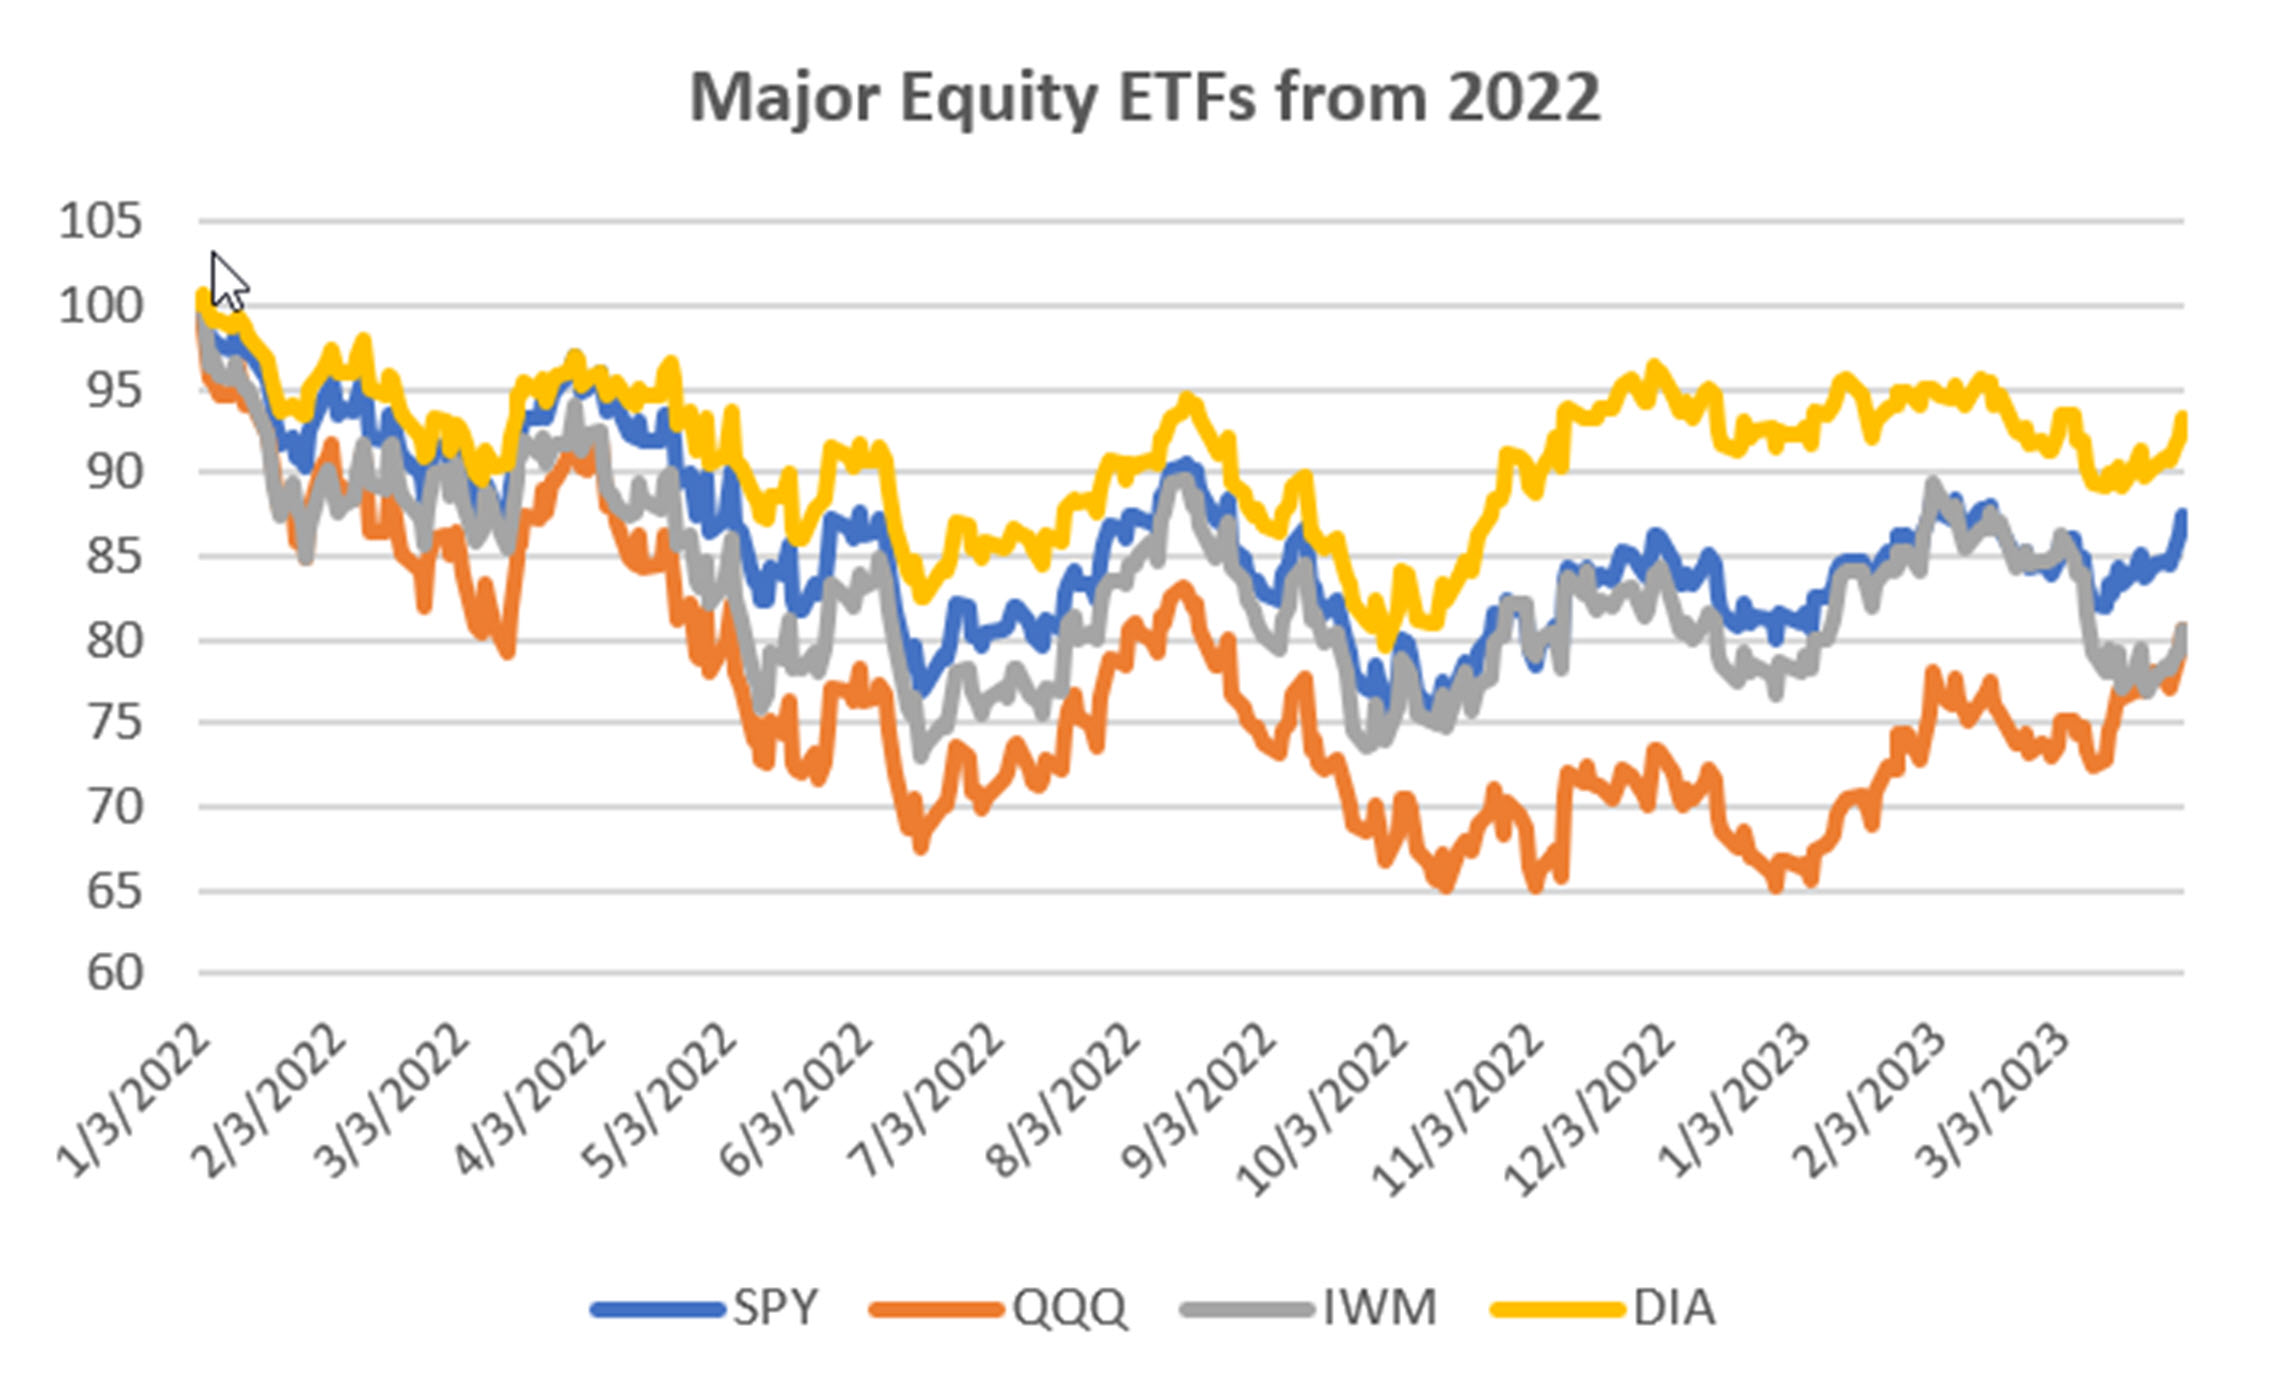
Major Equity ETFs
With all the negative news from the Fed, the equity markets have held above the lows and are suspiciously looking stronger. NASDAQ has been the favorite, having also declined the most. Only the small caps, IWM, have not rallied as much. We would like to see the S&P up another 5% to confirm that something serious is happening.
CLOSE-UP: The Best Trend Rules
We can get into the habit of using a trend signal without thinking about them carefully. There are two cases in point:
- Do you enter a trend signal when the price crosses the moving average trendline or do you enter when the trendline itself changes direction?
- Is it better to get an upward breakout signal when the high goes above the N-day high or when the close goes above the N-day high?
These choices can make the difference between profits and losses — a good trading signal or a false one. I have had my own opinion for years, but never tested it. I’ll correct that here. In this month’s study, we will look at the moving average. Next month we will review the breakout.
Moving Average Entry Rules
I have always used the moving average trendline to decide whether I should go long or short. My reasoning is that, if we are going to create a trendline to get rid of the noise, then it should be used to decide the direction of prices.
Also, I have been concerned that prices could get caught at a trendline, going above and below each day and causing a series of false signals and a lot of unnecessary trading. But without proof, it’s just a guess.
The Tests of Moving Average Entry Signals
I chose a few stocks and futures markets to test these rules. They were chosen as an interesting sample and not because they worked well. The intention was to have some popular markets with different patterns. The data started in January 2000. I will show results for both long and short trades.
The stocks chosen are Apple (AAPL), Amazon (AMZN), and Micron (MU), plus the ETFs SPY (the S&P 500), and QQQ (NASDAQ). The futures markets are the S&P 500 (ES), 10-Year Notes (TY), and gold (GC). I will put the tests side-by-side so that we can compare the results. At the end, there will be a table to help us draw conclusions.
S&P 500
Starting with the S&P, probably the most popular market, Chart 1 shows the long and short returns for futures. On the left is the entry rule where the price crosses the trendline, and on the right the rule using the direction of the trend change.
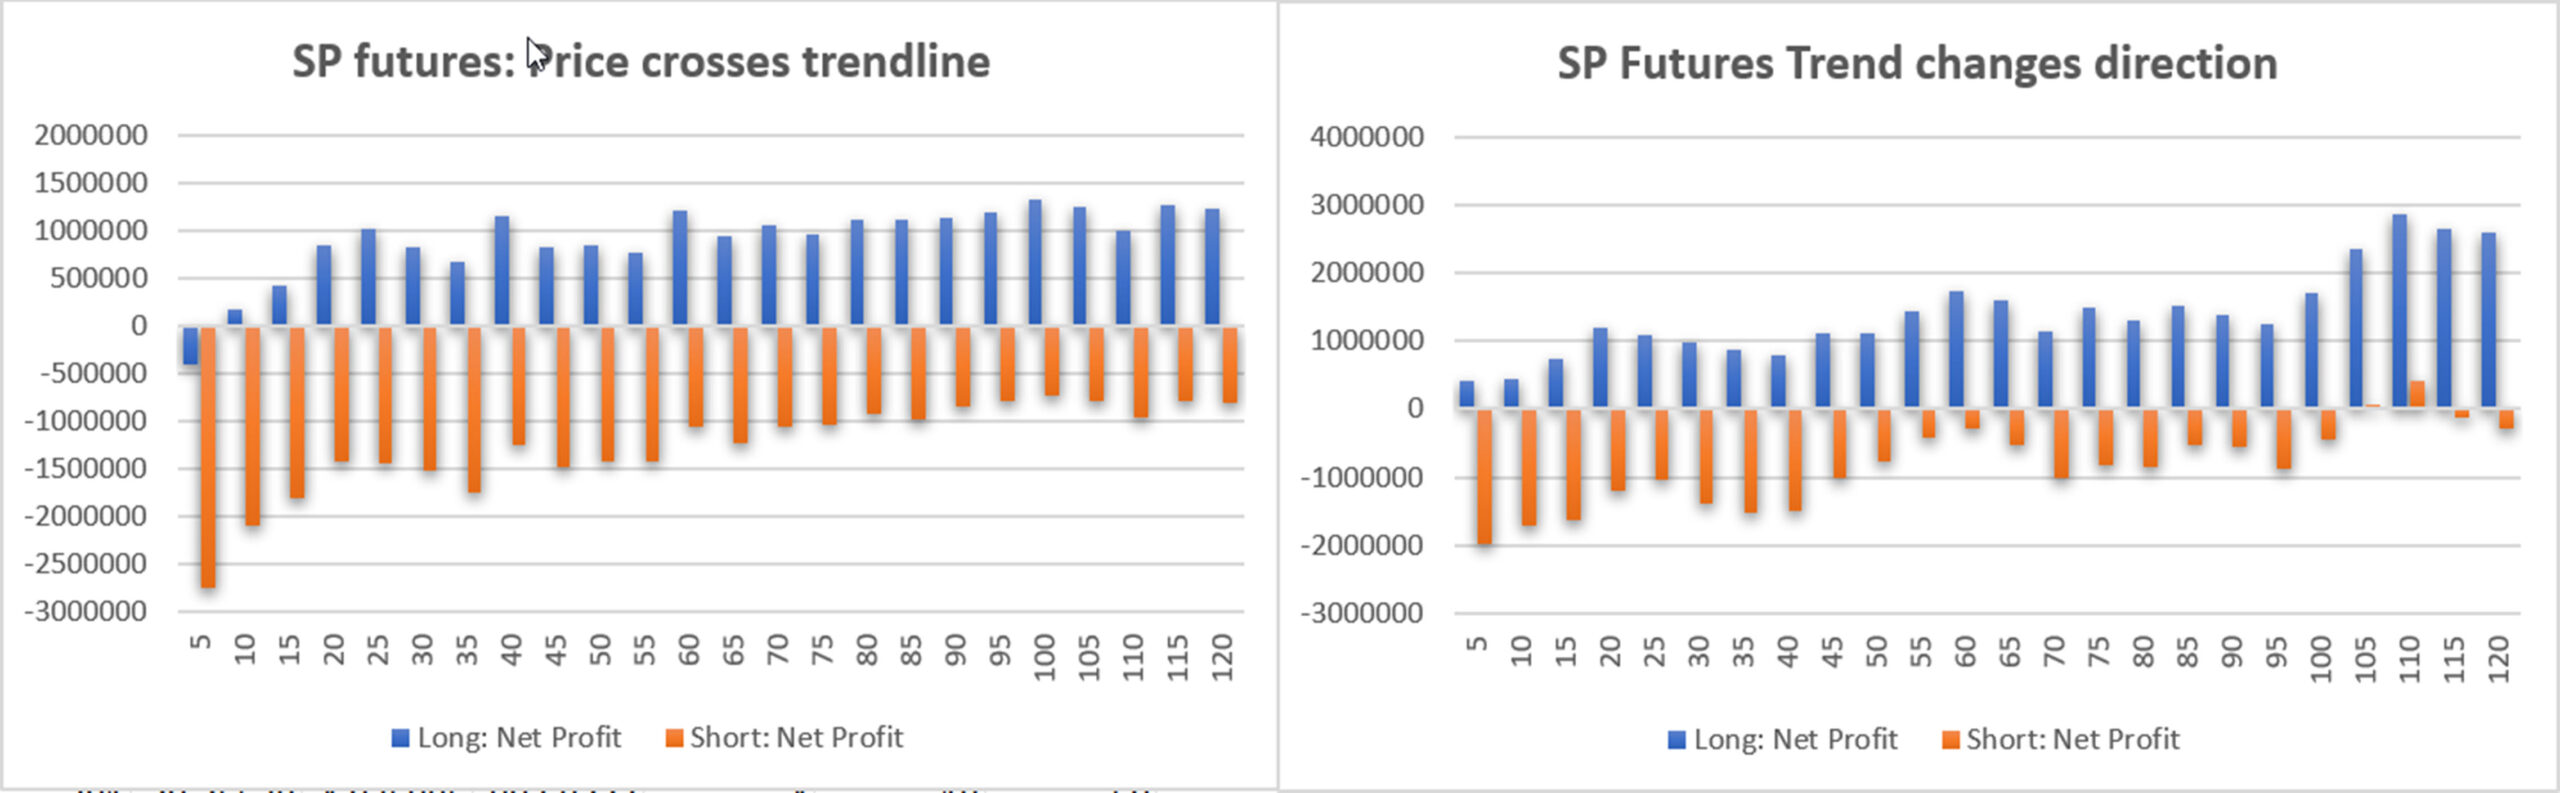
Chart 1. S&P 500 futures. (Left) Enter when the price crosses the trendline. (Right) Enter when the trendline changes direction.
Right away, these results make it difficult to decide which is best. The one thing that is clear is that short sales lose money everywhere. That is a valuable piece of information. The profits on the left (the blue bars) look more uniform than those on the right, but the long-term trends on the right peak at nearly $3 million while the left tops at about $1.25 million.
My personal expectation is that faster trends would benefit from entering sooner, which would be the chart on the left, and slower trends would be best following the trendline. The chart on the right does better for both profits and short sales for longer calculation periods.
The S&P ETF SPY
Now let’s look at the S&P ETF, which does not have the advantage of leverage. We get almost the opposite pattern in Chart 2 than we saw in Chart 1. The price crossing the trendline (left) is less uniform but has more profit and smaller short sale losses. Short sales still lose in every calculation period and there are profits everywhere on the long side. This makes it difficult to choose which entry method is best.
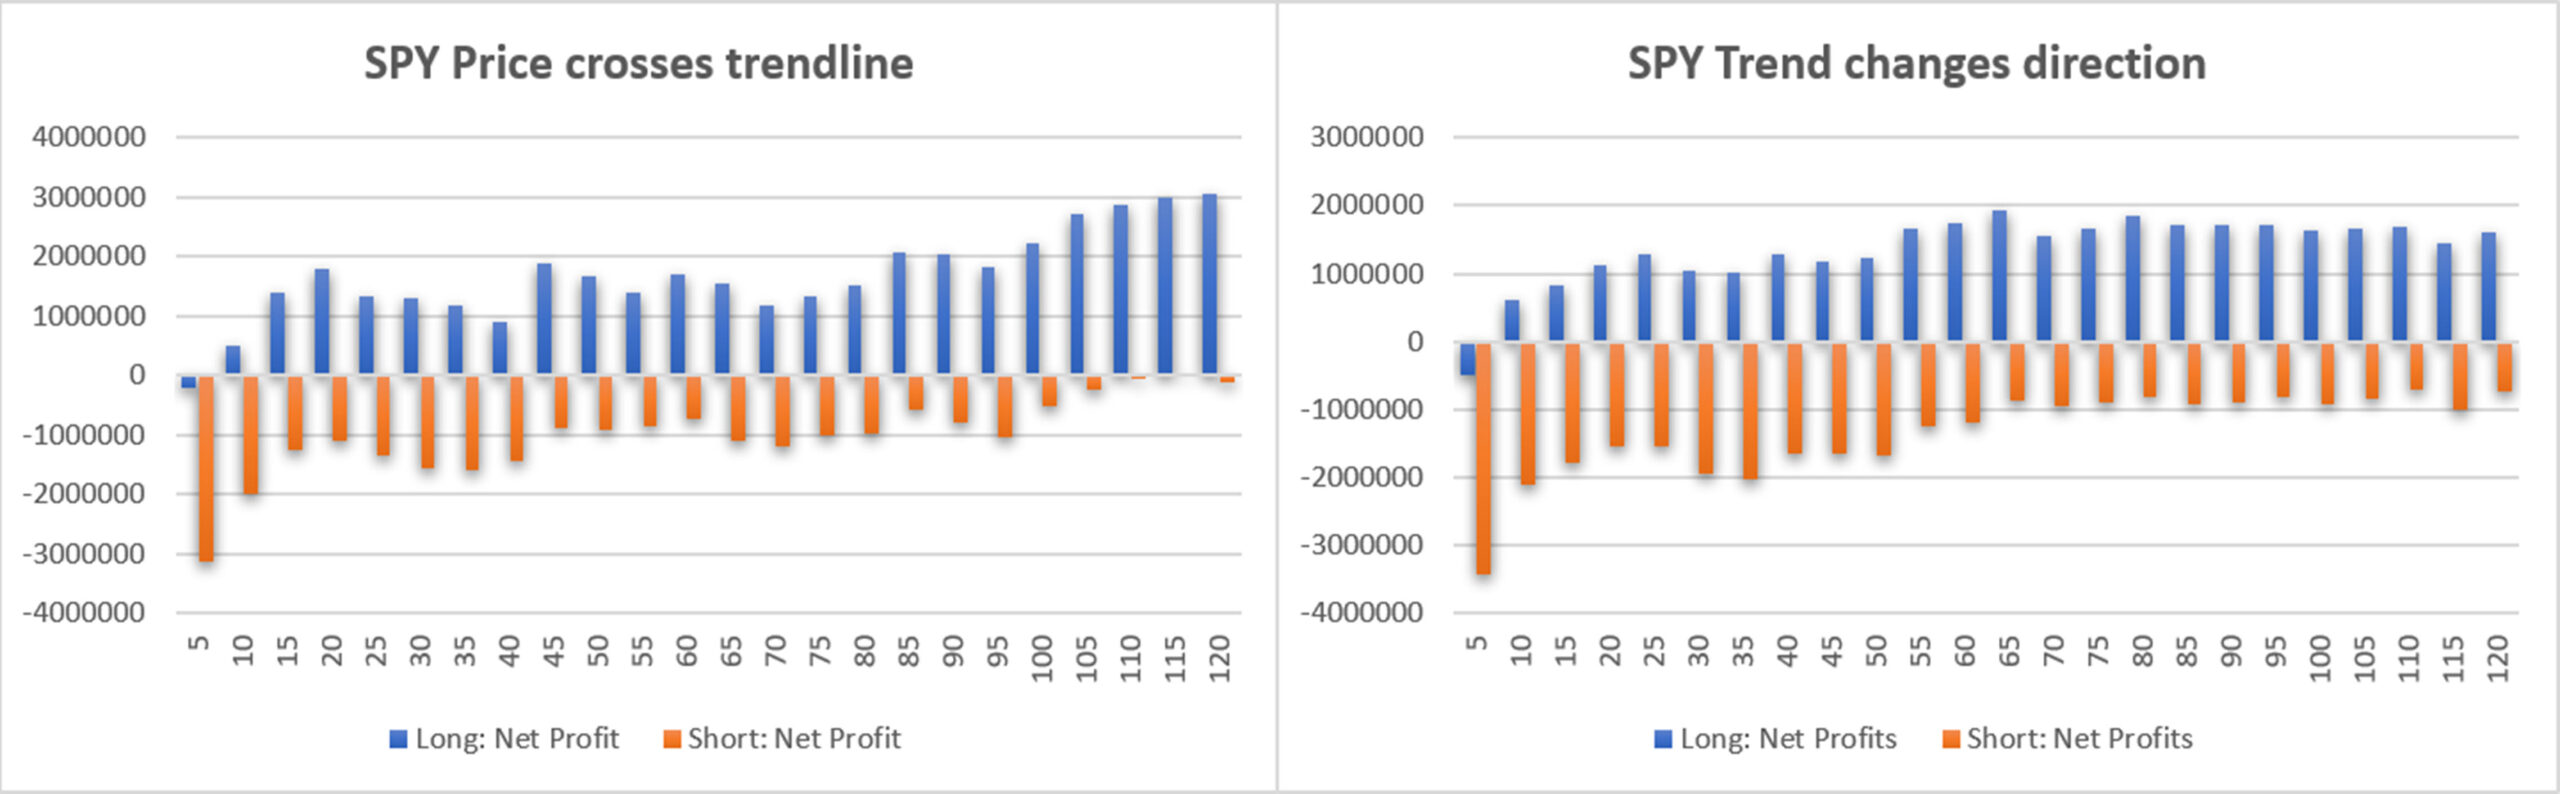
Chart 2. SPY tests. (Left) Enter when the price crosses the trendline. (Right) Enter when the trendline changes direction.
10-Year Treasury Notes
Staying with futures, Chart 3 shows the tests of 10-Year Treasure Notes. The first thing to note is that the short sales all lose. That means we should trade T-Notes only when interest rates are declining, even though we are now in a period of sharply rising rates. If we consider history, rates spend far more time declining than rising. Higher rates are short-lived. Even when rates are low, the roll of futures into a new delivery month adjusts rates higher so that they continue to decline steadily towards delivery. They produce small but steady profits.

Chart 3. 20-Year Treasure Note futures. (Left) Price cross trendline. (Right) Trendline changes direction.
While the chart on the left has a smoother pattern, the chart on the right has a higher average return, if we consider all calculation periods. We will need that information for our final conclusion.
Gold
Out last futures market is gold, which had a spectacular run to $2,000 and has been wandering around ever since. Chart 4 shows that the price crossing the trendline is more uniform, but the trendline entry has higher profits – except for the shorts, which again lose money everywhere.

Chart 4. Gold futures. (Left) Price cross trendline. (Right) Trendline changes direction.
Apple (AAPL)
Switching to stocks, we start with Apple, which has held up well during this market sell-off. Chart 5 shows that the patterns are similar, although the right (the trendline direction) is slightly higher. Shorts again lose money everywhere.

Chart 5. Apple (AAPL). (Left) Price cross trendline. (Right) Trendline changes direction.
AMZN
Next is Amazon (AMZN) which has not held up as well as Apple but is still a formidable stock. Chart 6 shows that both entry choices give similar results, although the left chart does better on the 5-day average, and the right chart does better on the 120-day average. Draw your own conclusions, if any.

Chart 6. Amazon (AMZN). (Left) Price cross trendline. (Right) Trendline changes direction.
Micron
Micron is one of the premier chip makers and suffered along with other manufacturers when deliveries where delayed and the economy slumped. Chart 7 has interesting patterns. Both entry methods are weak up to the 40- to 60-day calculation periods. The left chart looks more uniform, but the right has higher returns. The price crossing the trendline, left, shows better profits for the faster trends.
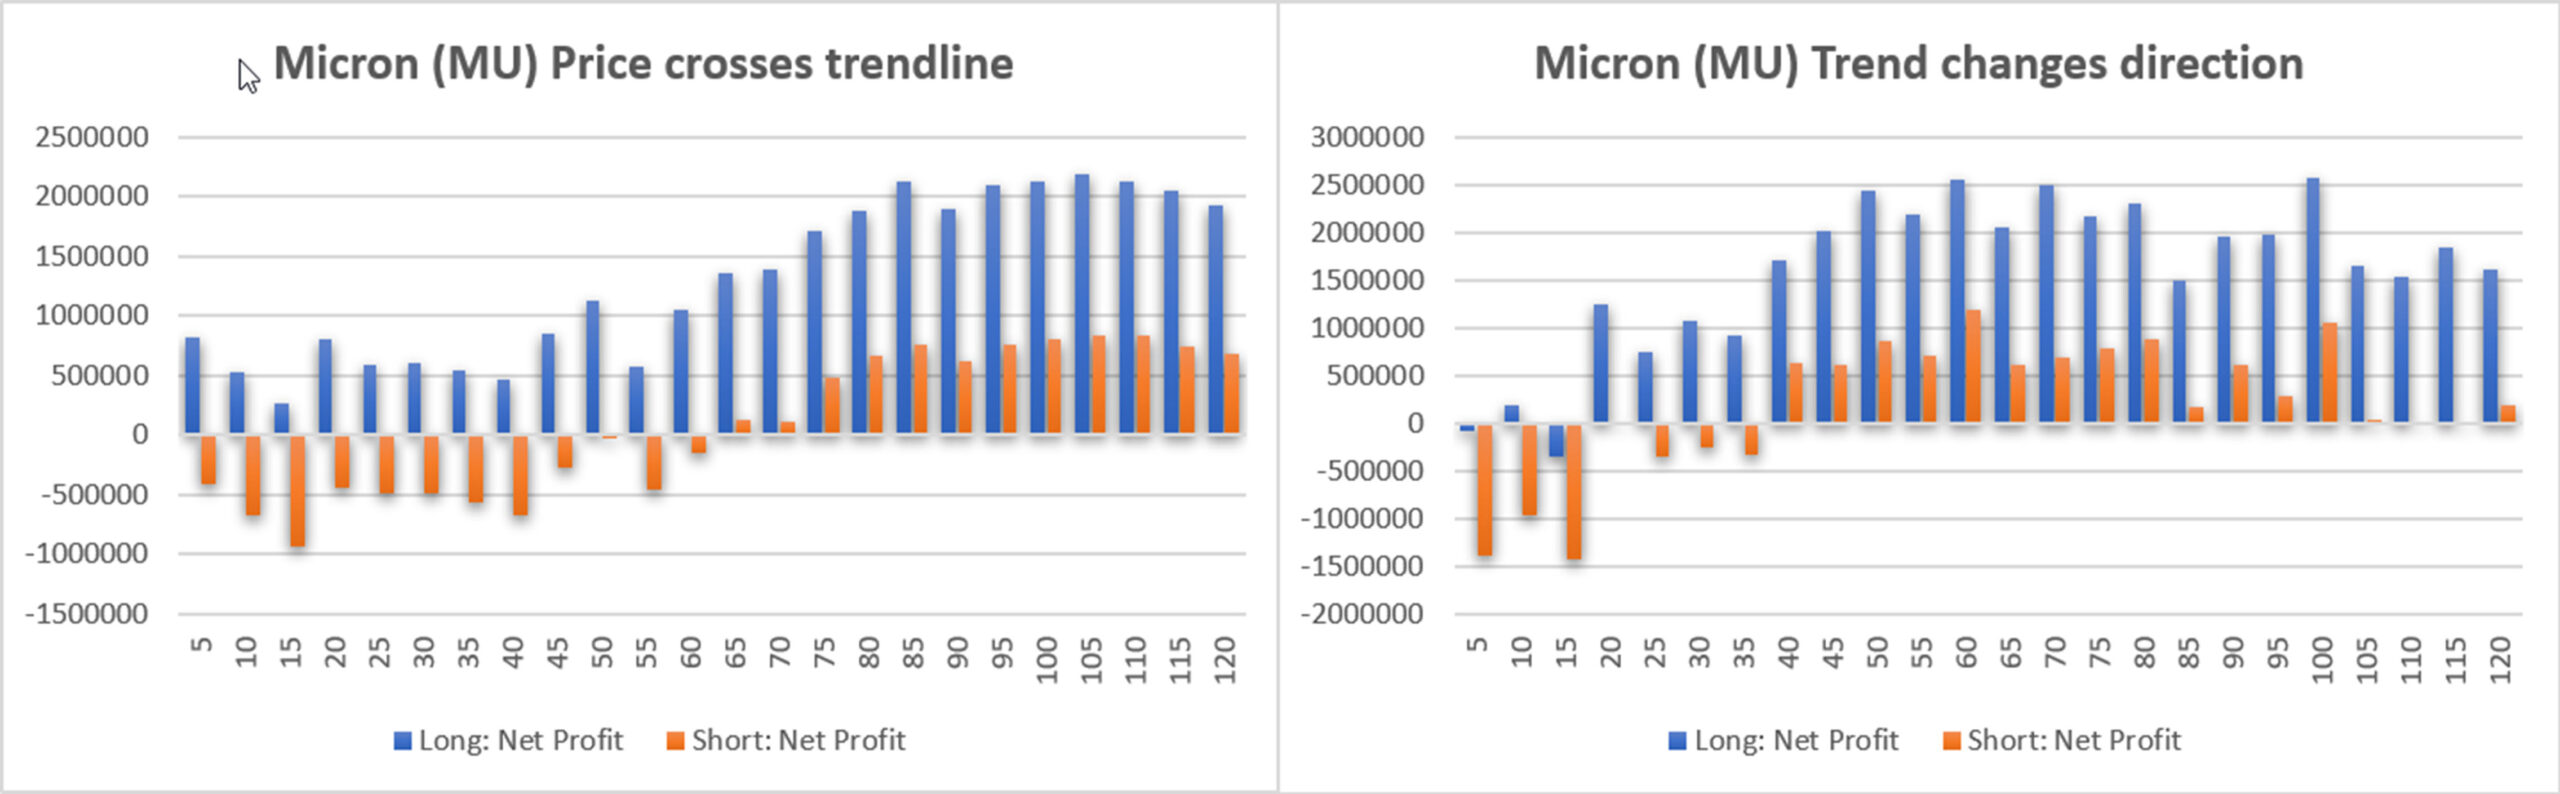
Chart 7. Micron (MU). (Left) Price cross trendline. (Right) Trendline changes direction.
Summary of Moving Average Tests
It may not be easy to decide which rules is best, so I created a table of profits and trades. For me, the choice becomes clear. The average of all the tests shows that using the direction of the trendline has higher profits and smaller losses, even though the differences are not large (Table 1). The deciding factor are the number of trades. As expected, using the price crossing the trendline results in substantially more trades. More trades means more slippage and more cost.

Table 1. (Left) Average of all returns. (Right) Average number of trades.
There is still the lurking feeling that using the price crossing the trendline would be better for fast trading because it has less lag. Table 2 shows the results of the 10-day trend.
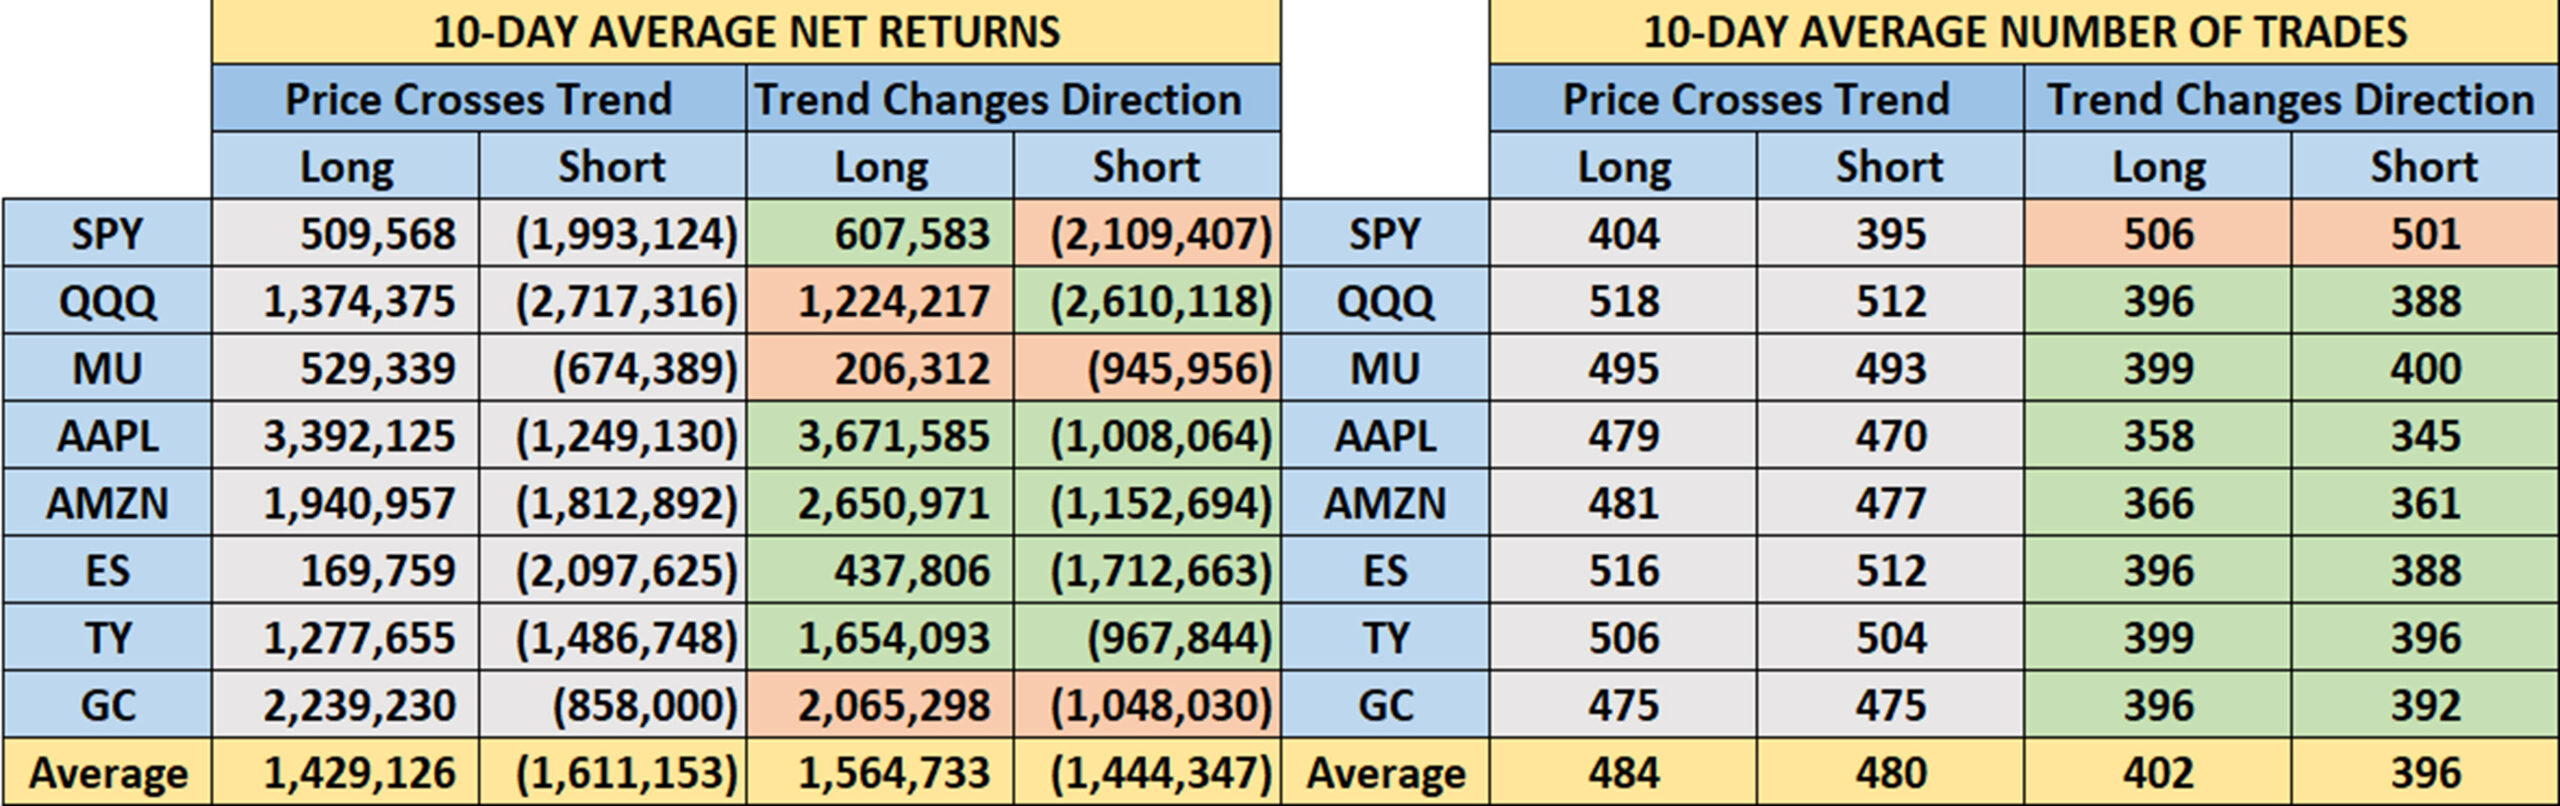
Table 2. 10-Day Trend Results. (Left) Average of all returns. (Right) Average number of trades.
Contrary to my thinking, the change in the trend direction is a better choice even for a fast moving average. It shows higher returns and significantly fewer trades. The highlighted red boxes show where the price crossing the trendline was better, but I go with the average results.
A Standing Note on Short Sales
Note that the “All Signals” reports show short sales in stocks and ETFs, even though short positions are not executed in the equity portfolios. Our work over the years shows that downturns in the stock market are most often short-lived and it is difficult to capture with a longer-term trend. The upwards bias also works against shorter-term systems unless using futures, which allows leverage. Our decision has been to take only long positions in equities and control the risk by exiting many of the portfolios when there is extreme volatility and/or an indication of a severe downturn.
PORTFOLIO METHODOLOGY IN BRIEF
Both equity and futures programs use the same basic portfolio technology. They all exploit the persistence of performance, that is, they seek those markets with good long-term and short-term returns on the specific system, rank them, then choose the best, subject to liquidity, an existing current signal, with limitations on how many can be chosen from each sector. If there are not enough stocks or futures markets that satisfy all the conditions, then the portfolio holds fewer assets. In general, these portfolios are high beta, showing higher returns and higher risk, but have had a history of consistently outperforming the broad market index in all traditional measures.
PERFORMANCE BY GROUP
NOTE that the charts show below represent performance “tracking,” that is, the oldest results since are simulated but the returns from 2013 are the systematic daily performance added day by day. Any changes to the strategies do not affect the past performance, unless noted. The system assumes 100% investment and stocks are executed on the open, futures on the close of the trading day following the signals. From time to time we make logic changes to the strategies and show how the new model performs.
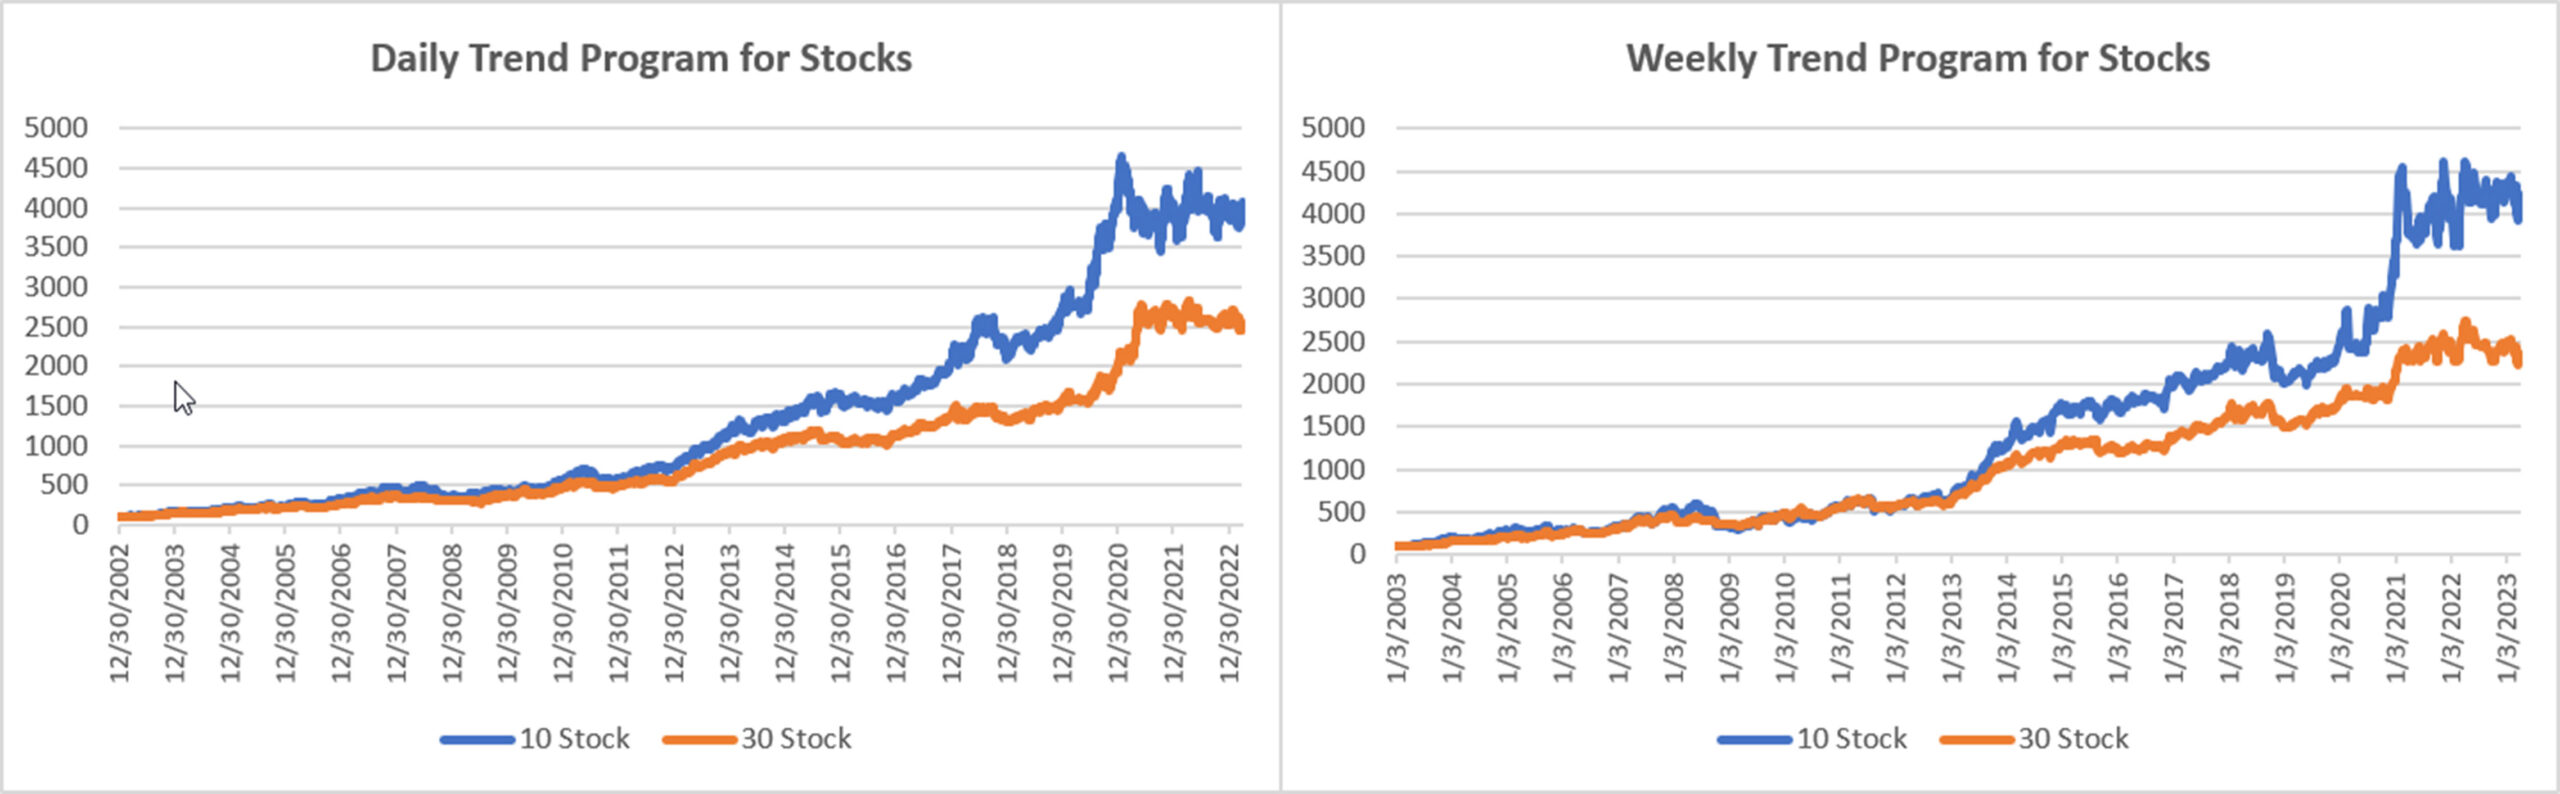
Groups DE1 and WE1: Daily and Weekly Trend Program for Stocks, including Income Focus, and DowHedge, and the new Sector Rotation
The Trend program seeks long-term directional changes in markets and the portfolios choose stocks that have realized profitable performance over many years combined with good short-term returns. It will hold fewer stocks when they do not meet our condition and exit the entire portfolio when there is extreme risk or a significant downturn.
A good recovery from February’s loss, putting the 10-Stock portfolio ahead for the year. The 30-Stock and the Weekly 10-Stock are marginally lower. It’s been a long struggle to find upwards trends while the Fed is raising rates, but the strategy seems to be holding steady. We remain optimistic that the end of the Fed cycle is near and markets will anticipate that with a rally.
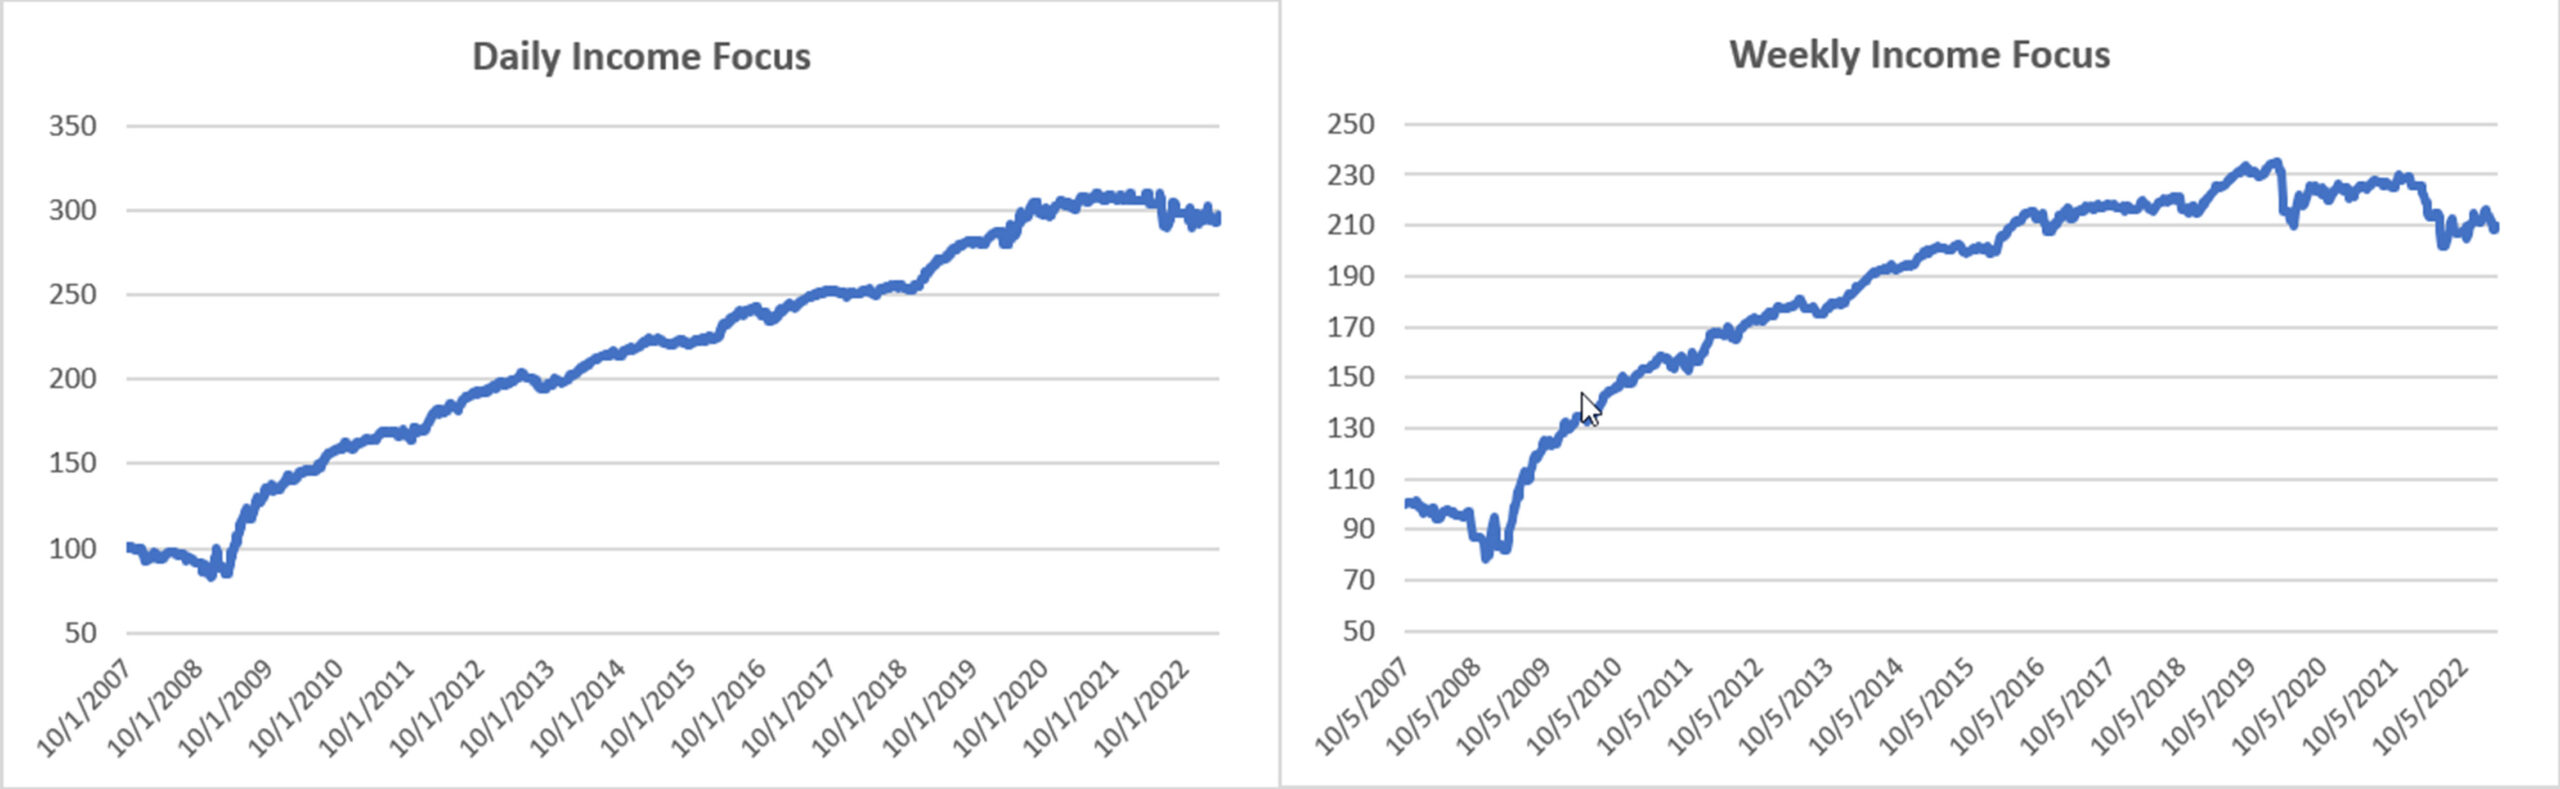
Income Focus and Sector Rotation
The Daily Income Focus portfolio is edging out the Weekly with a modest gain for the month and the year. Both portfolios are holding steady in the face of Fed rate hikes. This program will be back on track once we are sure that the Fed is done with raising rates.
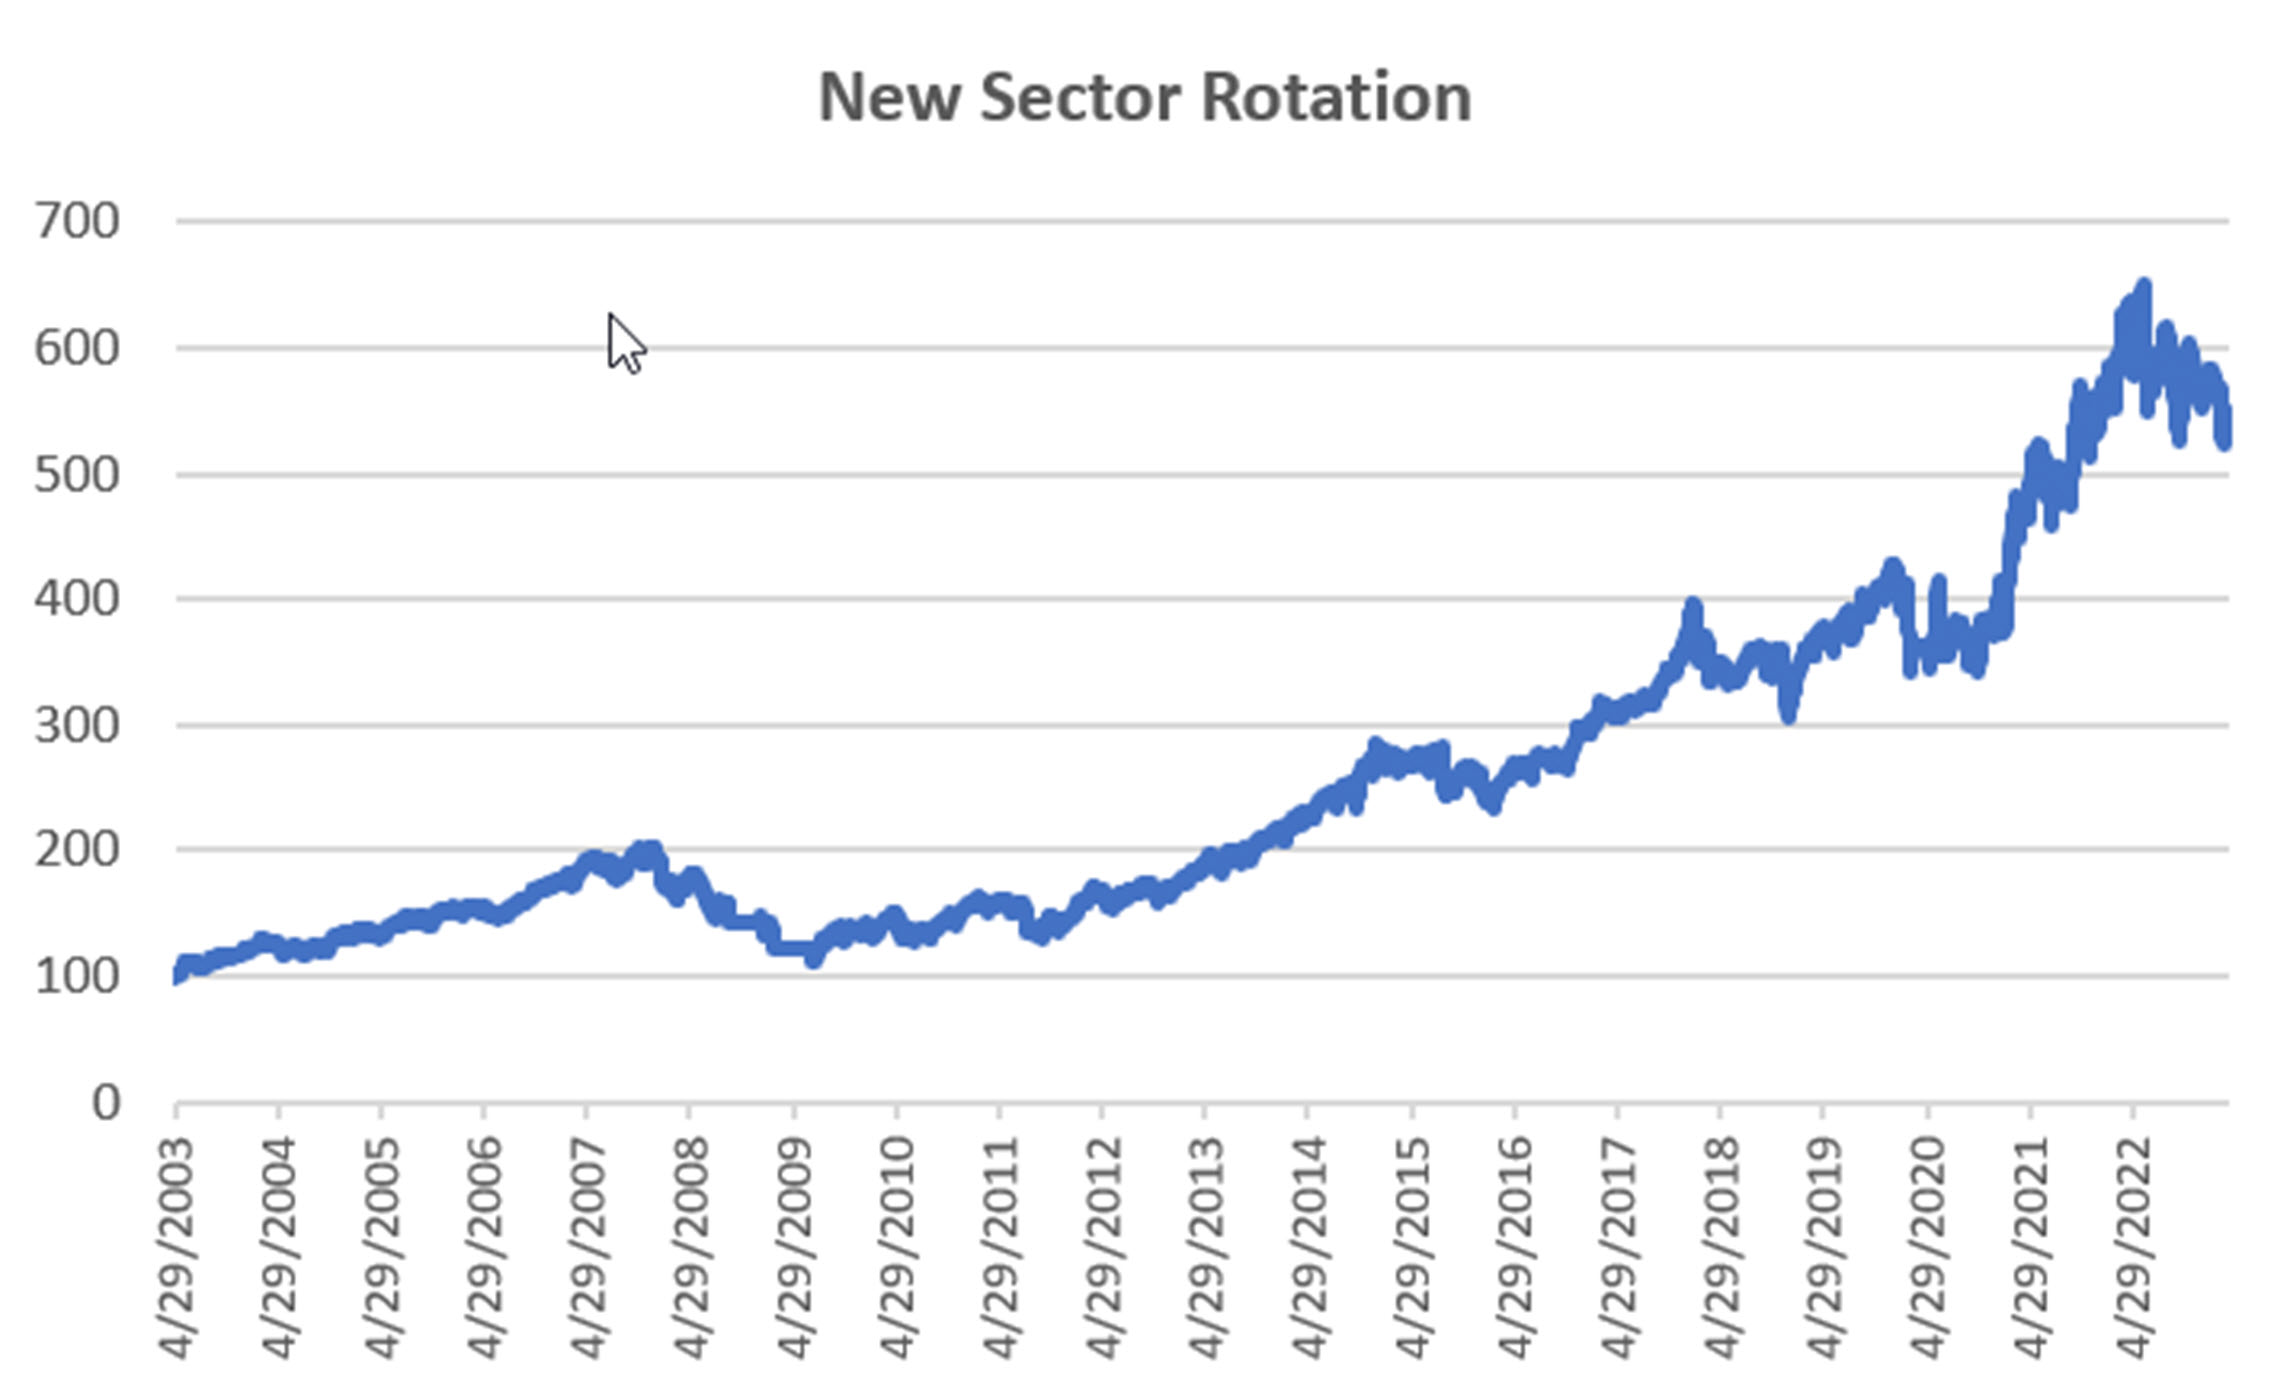
NEW Sector Rotation
The Sector Rotation program continues to hold the same ETFs: Financials, Staples, and Utilities, clearly a defensive position. When it switches to Technology (XLK) we will be looking for big gains. Meanwhile, the program lost more than 1% in March as the market flounders around.
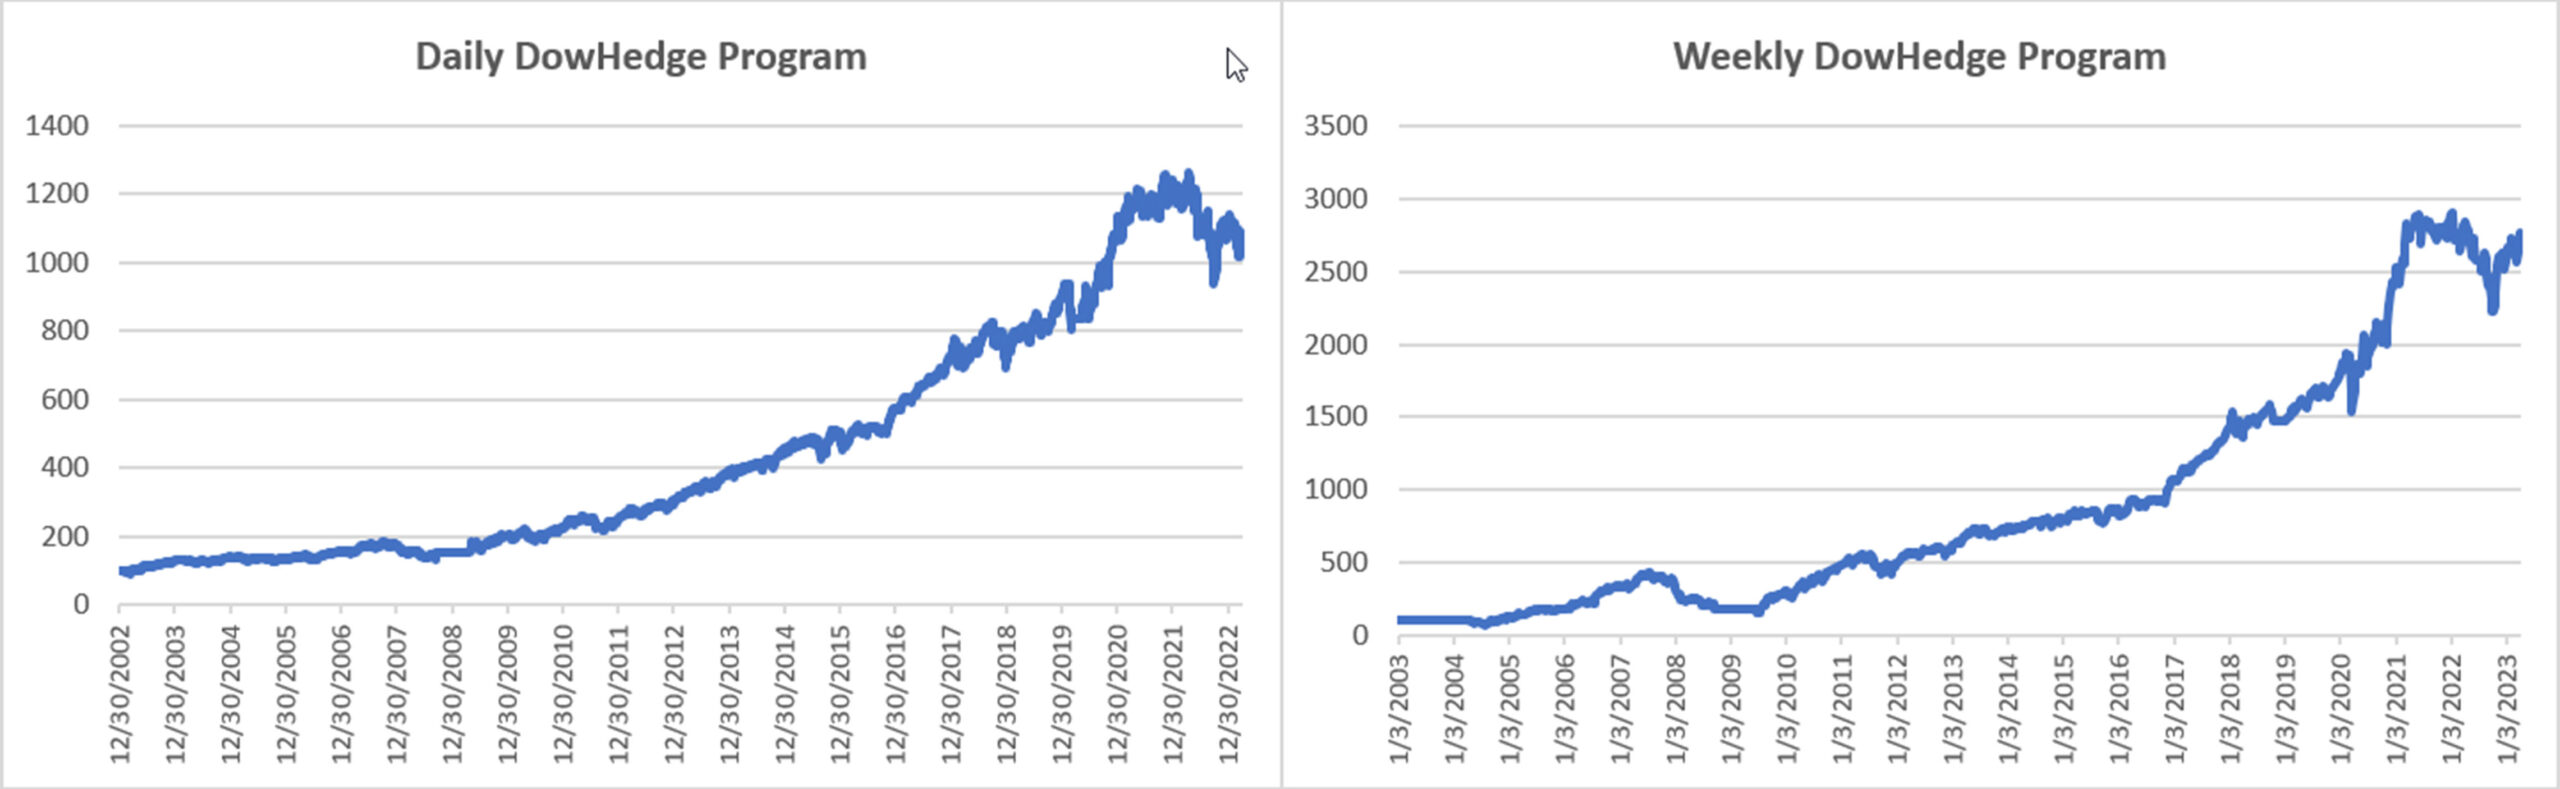
DowHedge Programs
A nice recovery for both the Daily and Weekly DowHedge, with the Weekly looking strong, now ahead by nearly 8% for this year, similar to the S&P. We remain optimistic that the market, and our equity, have seen the lows.
Group DE2: Divergence Program for Stocks
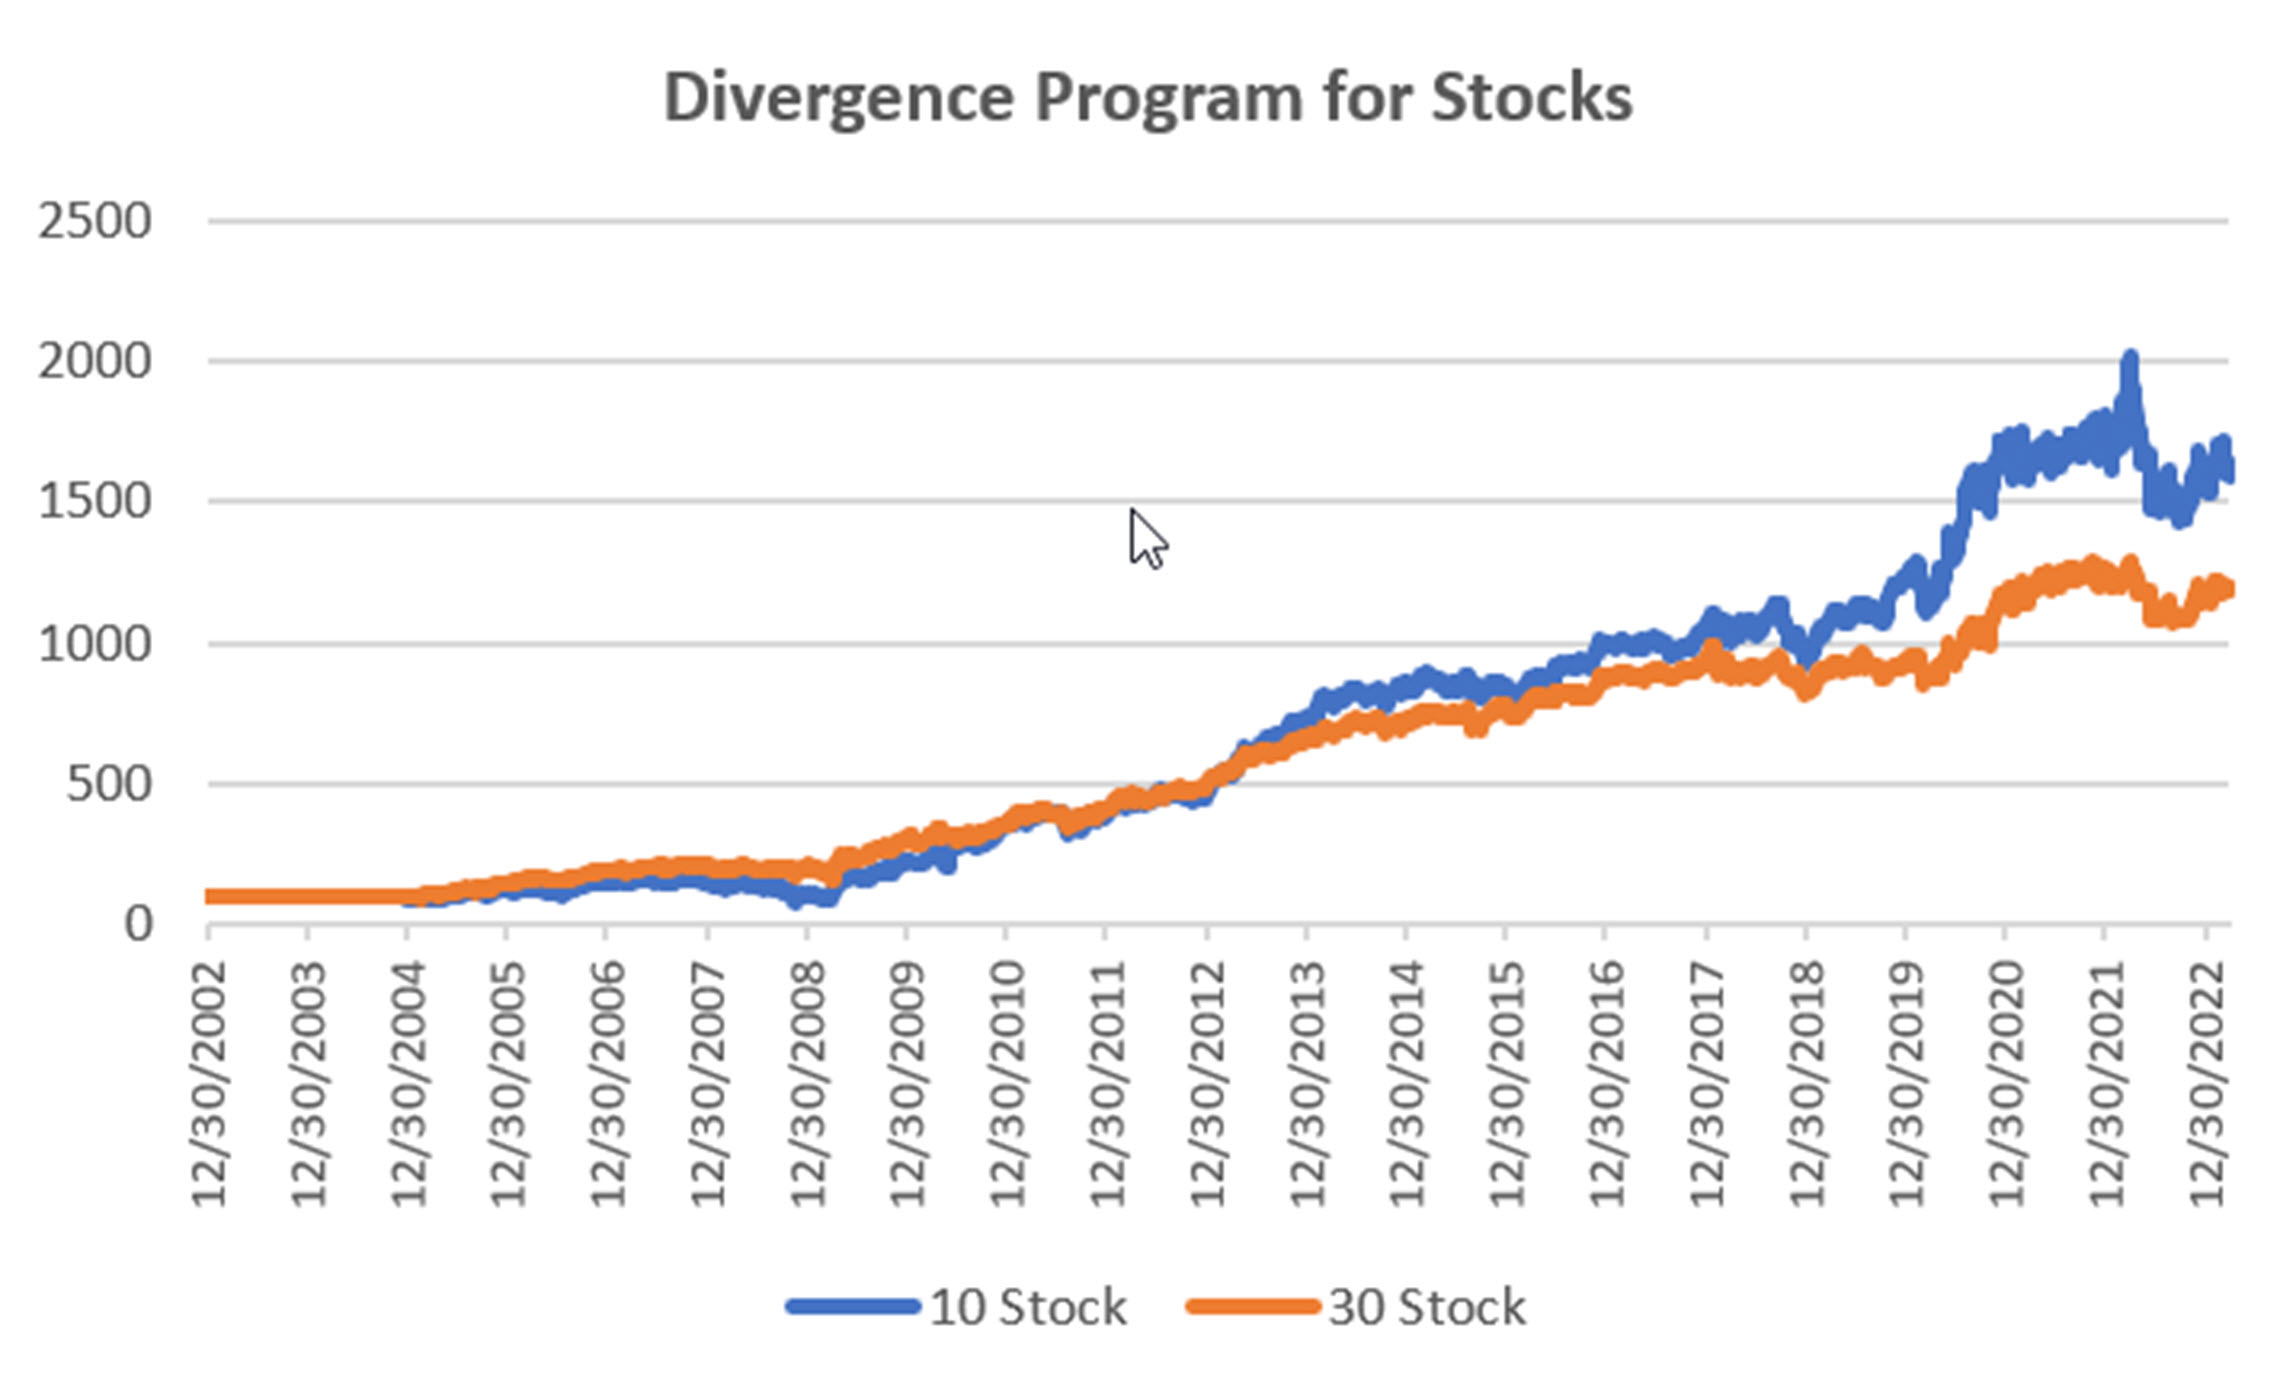
The Divergence program looks for patterns where price and momentum diverge, then takes a position in anticipation of the pattern resolving itself in a predictable direction, often the way prices had moved before the period of uncertainty.
The 10-Stock portfolio lost 4% while the 30-Stock gained a fraction, but both portfolios remain ahead for the year. We think that any gain in 2023 is good, with high expectations for the rest of the year. The chart below shows that both portfolios are now trending higher.
Group DE3: Timing Program for Stocks
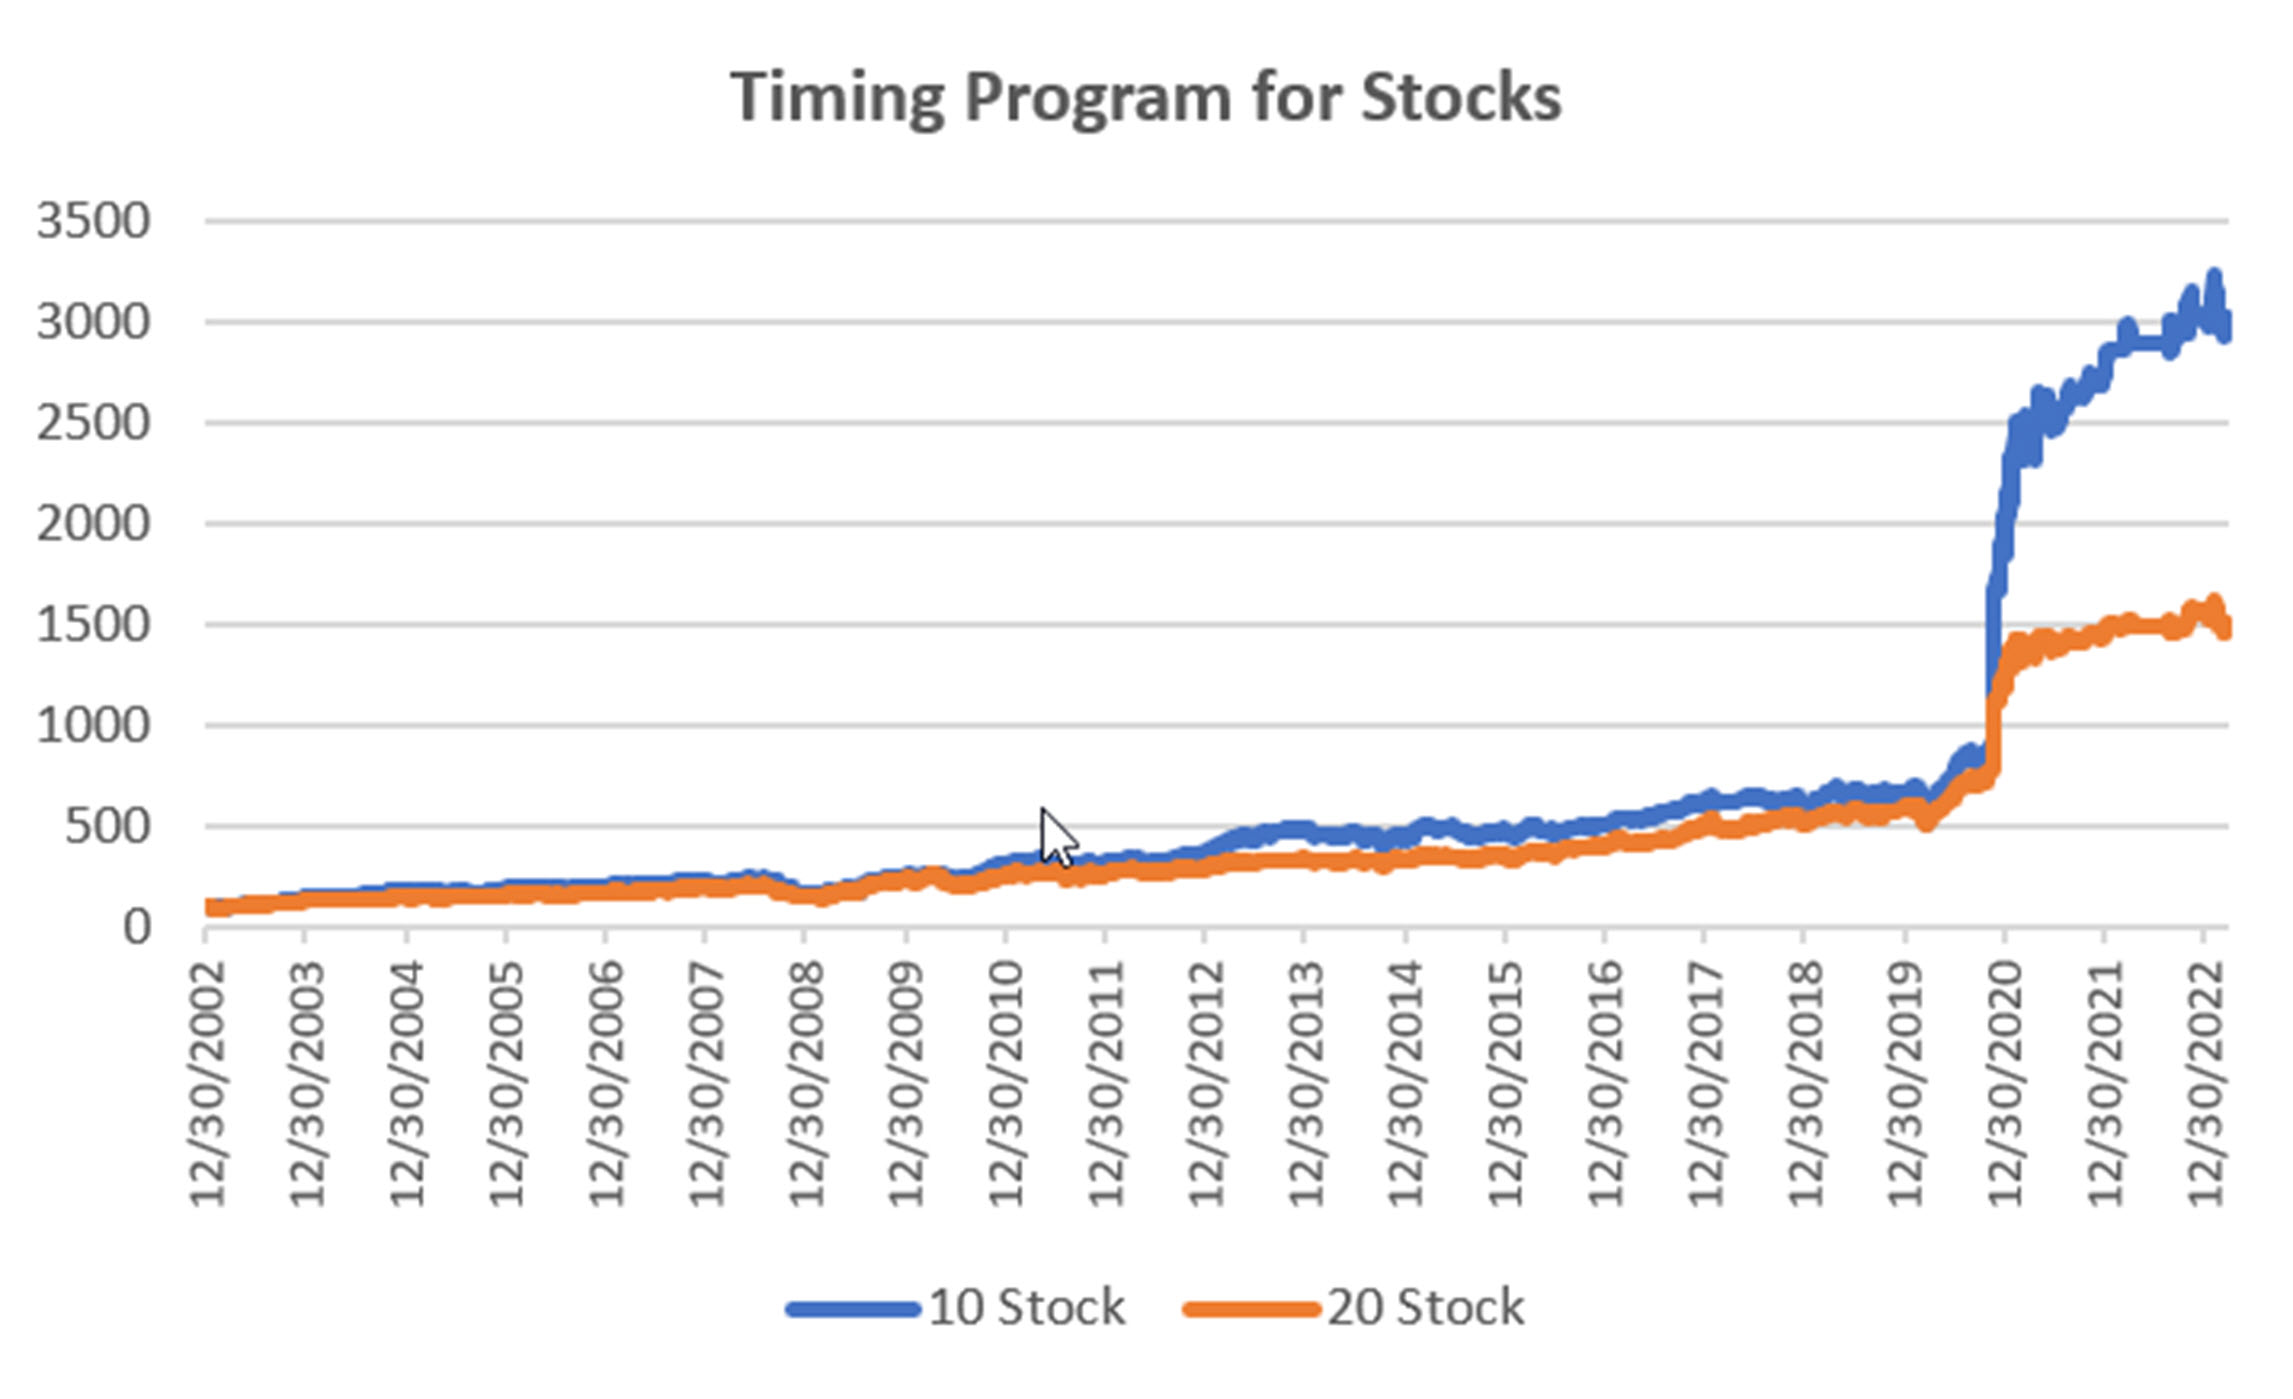
The Timing program is a relative-value arbitrage, taking advantage of undervalued stocks relative to its index. It first finds the index that correlates best with a stock, then waits for an oversold indicator within an upwards trend. It exits when the stock price normalizes relative to the index, or the trend turns down. These portfolios are long-only because the upwards bias in stocks and that they are most often used in retirement accounts.
After being down to one or two positions, the Timing Program is starting to build back up. It needs a clear upwards trend and a pullback, which has been hard to come by. Both portfolios gains more than 2% in March and are near flat for the year. They have had very low volatility during the past months of uncertainty.
Futures Programs
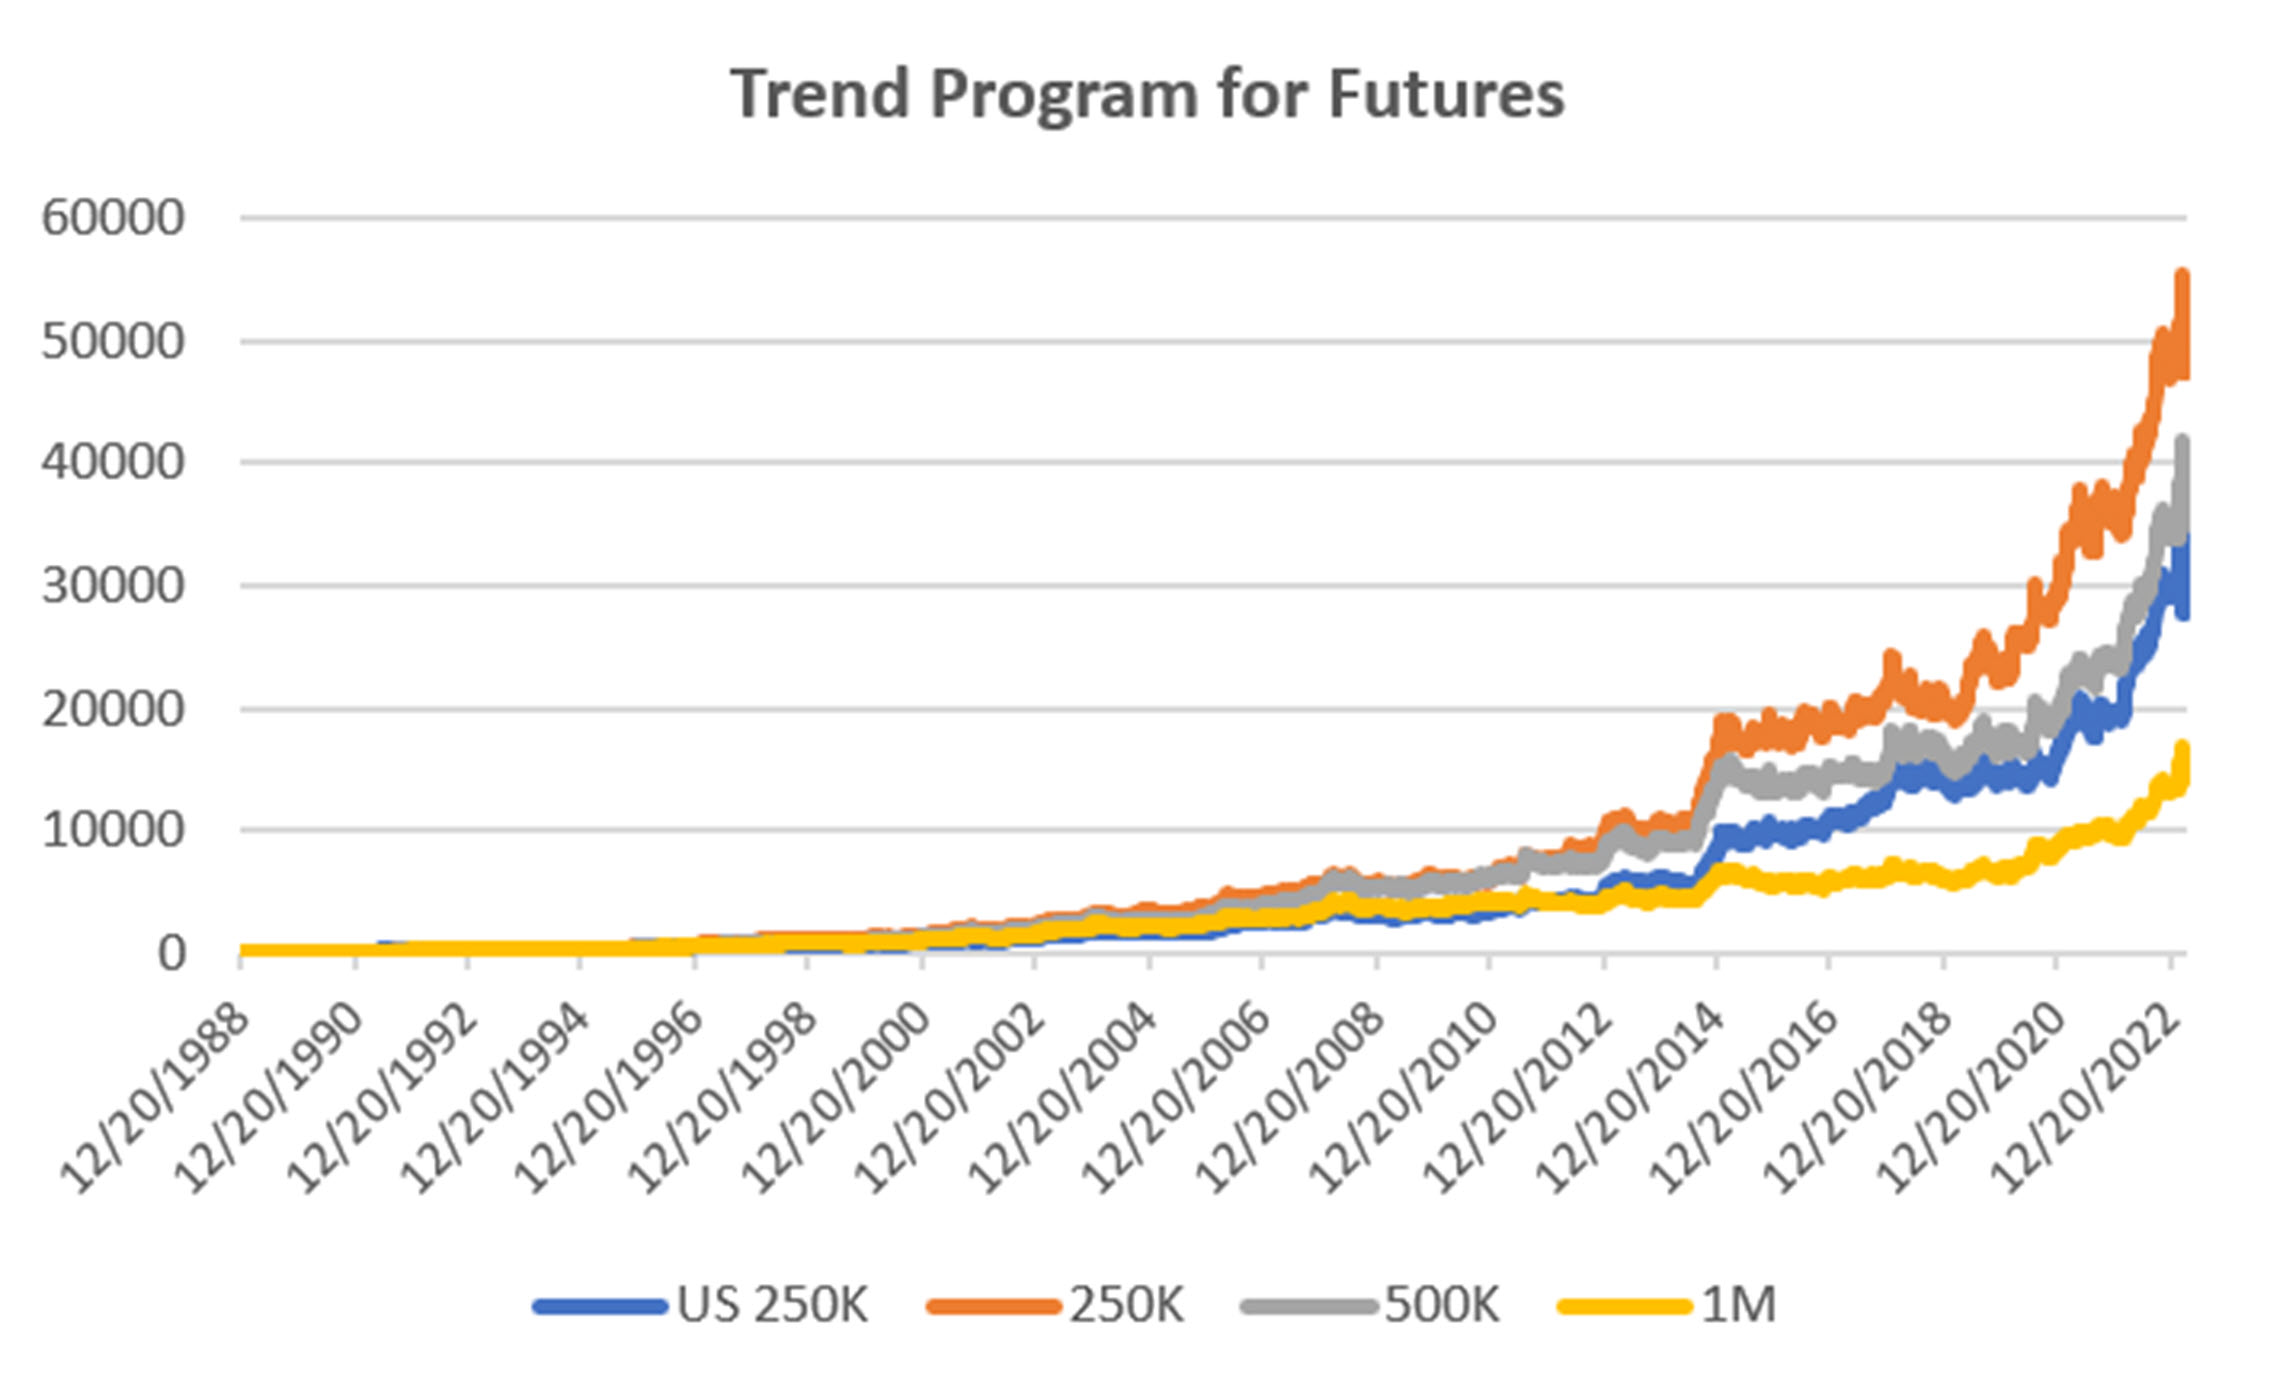
Groups DF1 and WF1: Daily and Weekly Trend Programs for Futures
Futures allow both high leverage and true diversification. The larger portfolios, such as $1million, are diversified into both commodities and world index and interest rate markets, in addition to foreign exchange. Its performance is not expected to track the U.S. stock market and is a hedge in every sense because it is uncorrelated. As the portfolio becomes more diversified its returns are more stable.
The leverage available in futures markets allows us to manage the risk in the portfolio, something not possible to the same degree with stocks. This portfolio targets 14% volatility. Investors interested in lower leverage can simply scale down all positions equally in proportion to their volatility preference. Note that these portfolios do not trade Asian futures, which we believe are more difficult for U.S. investors to execute. The “US 250K” portfolio trades only U.S. futures.
It does not look as bad on the chart as it felt in real life! The market took the Fed announcement as a surprise, even though, given the bank failures and declining inflation, the market should have expected some moderation by the Fed. The sudden rally (lower rates) produced large losses for all the futures funds. As you can see in the 5-Year chart, there was low volatility before the announcement, which causes funds to leverage up their positions. Then the 50 bp increase at the Fed meeting put a stop to the rally. While prices may decline a bit more, it now seems unlikely that we will see another low in futures.
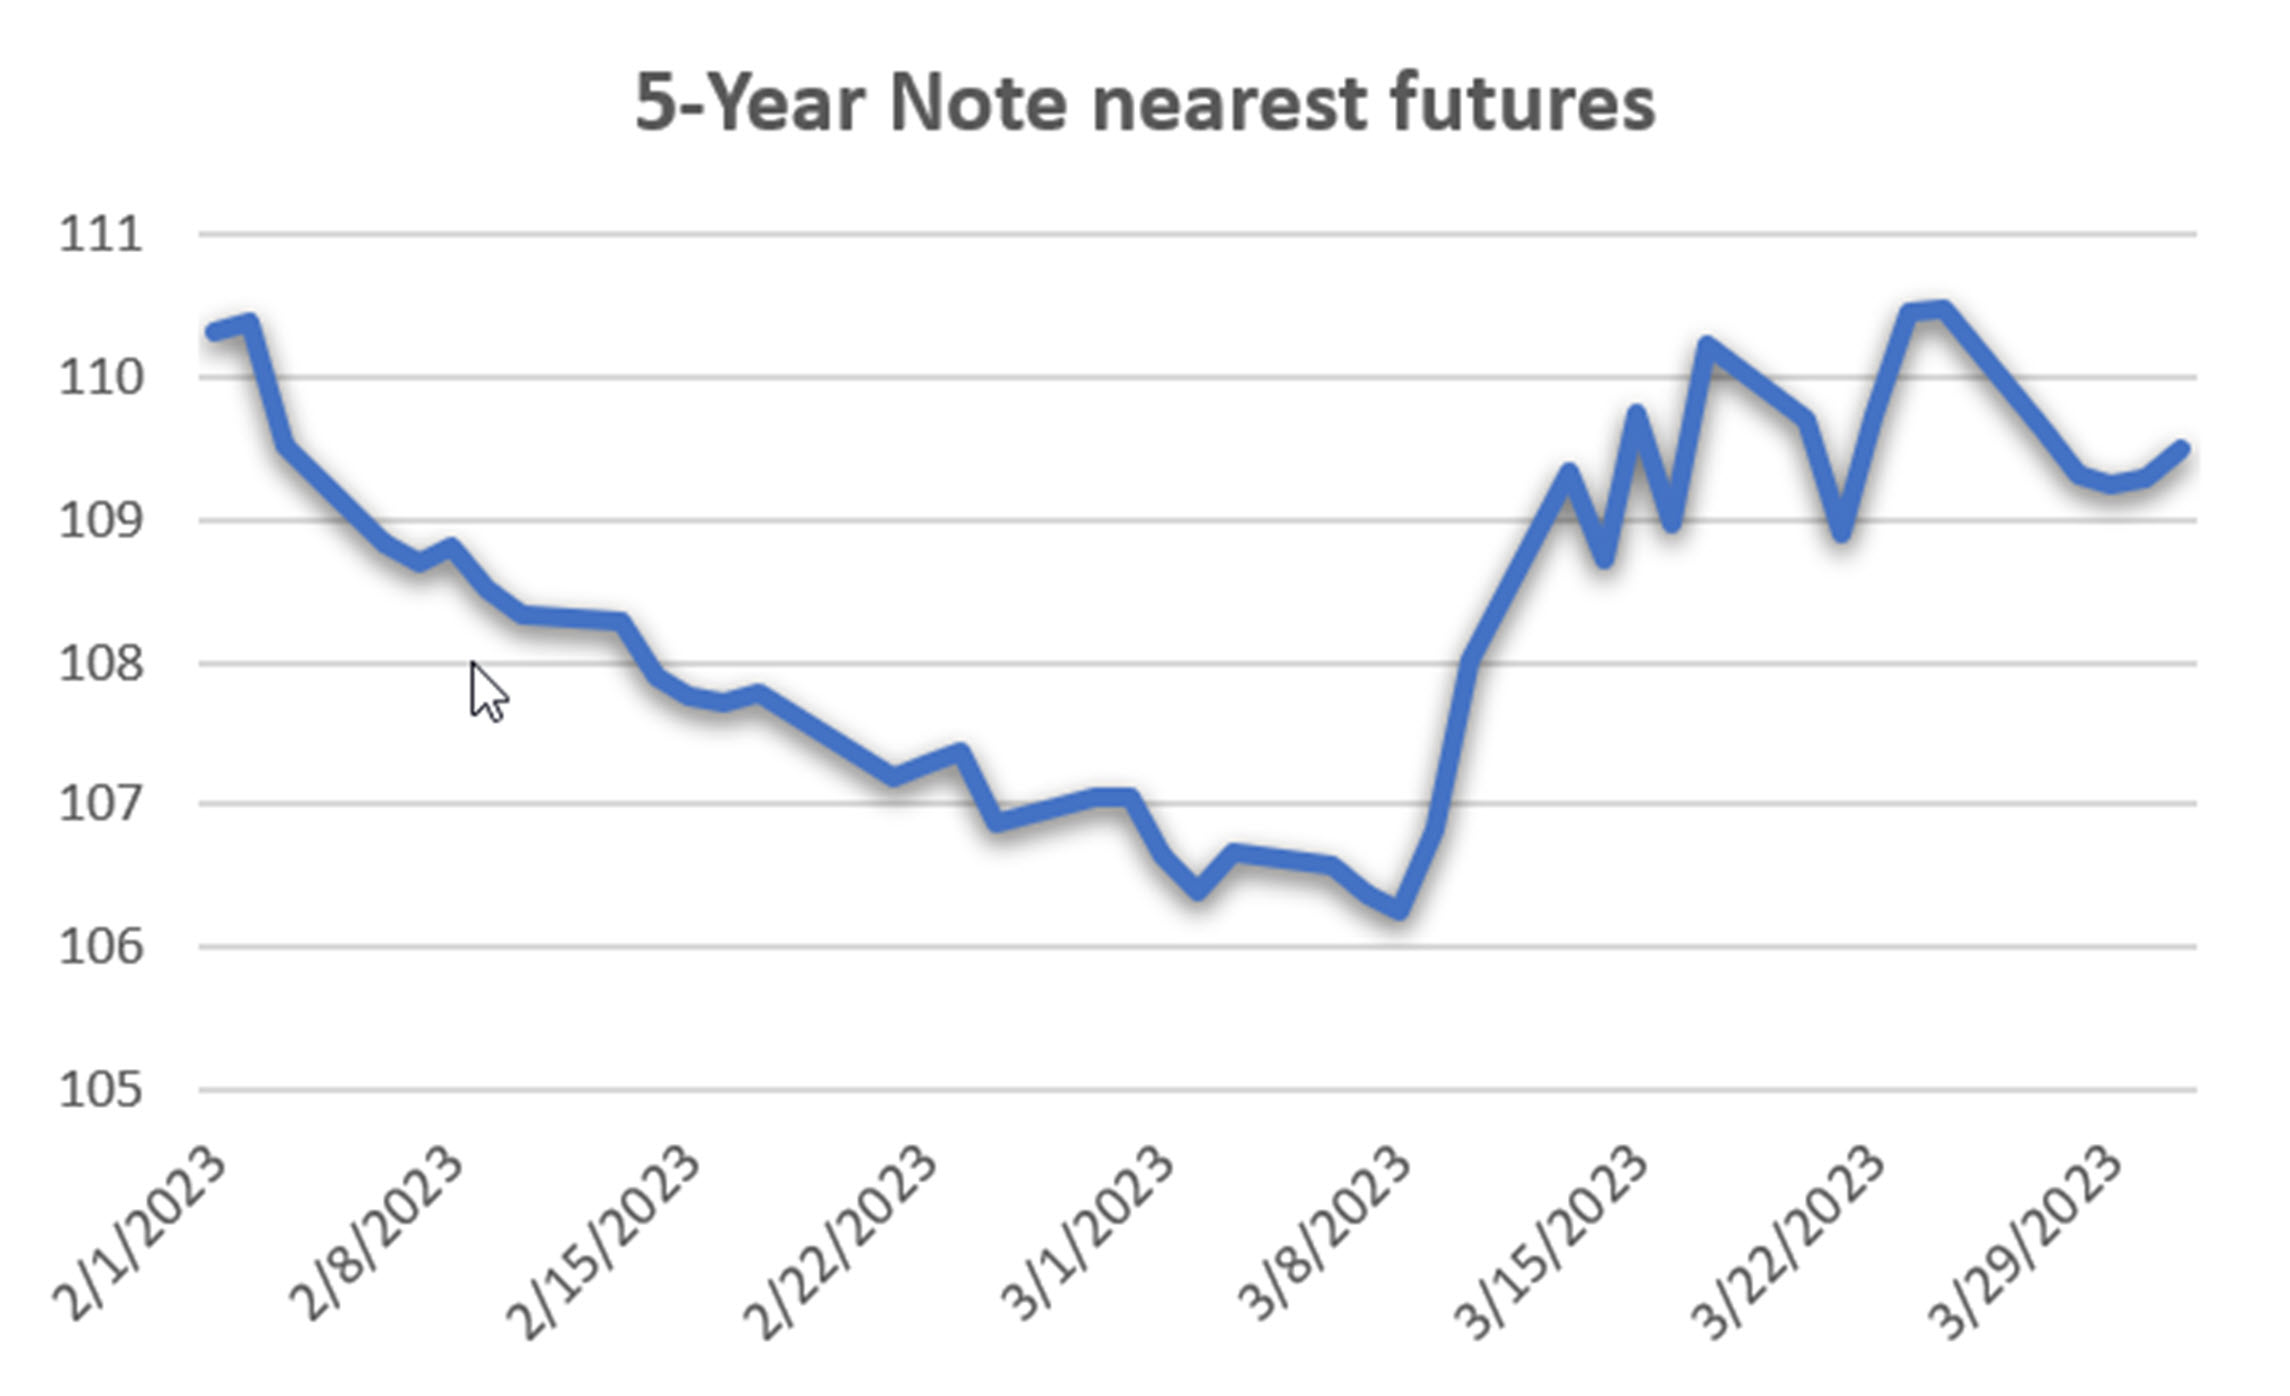
5-Year Note nearest futures, February and March 2023.
The Futures portolios now have the smallest exposure in years, waiting for the interest rates to decide which direction they will go. Unitl then, it seems to be fine just holding the Mexican peso and gaining a few bips each day.
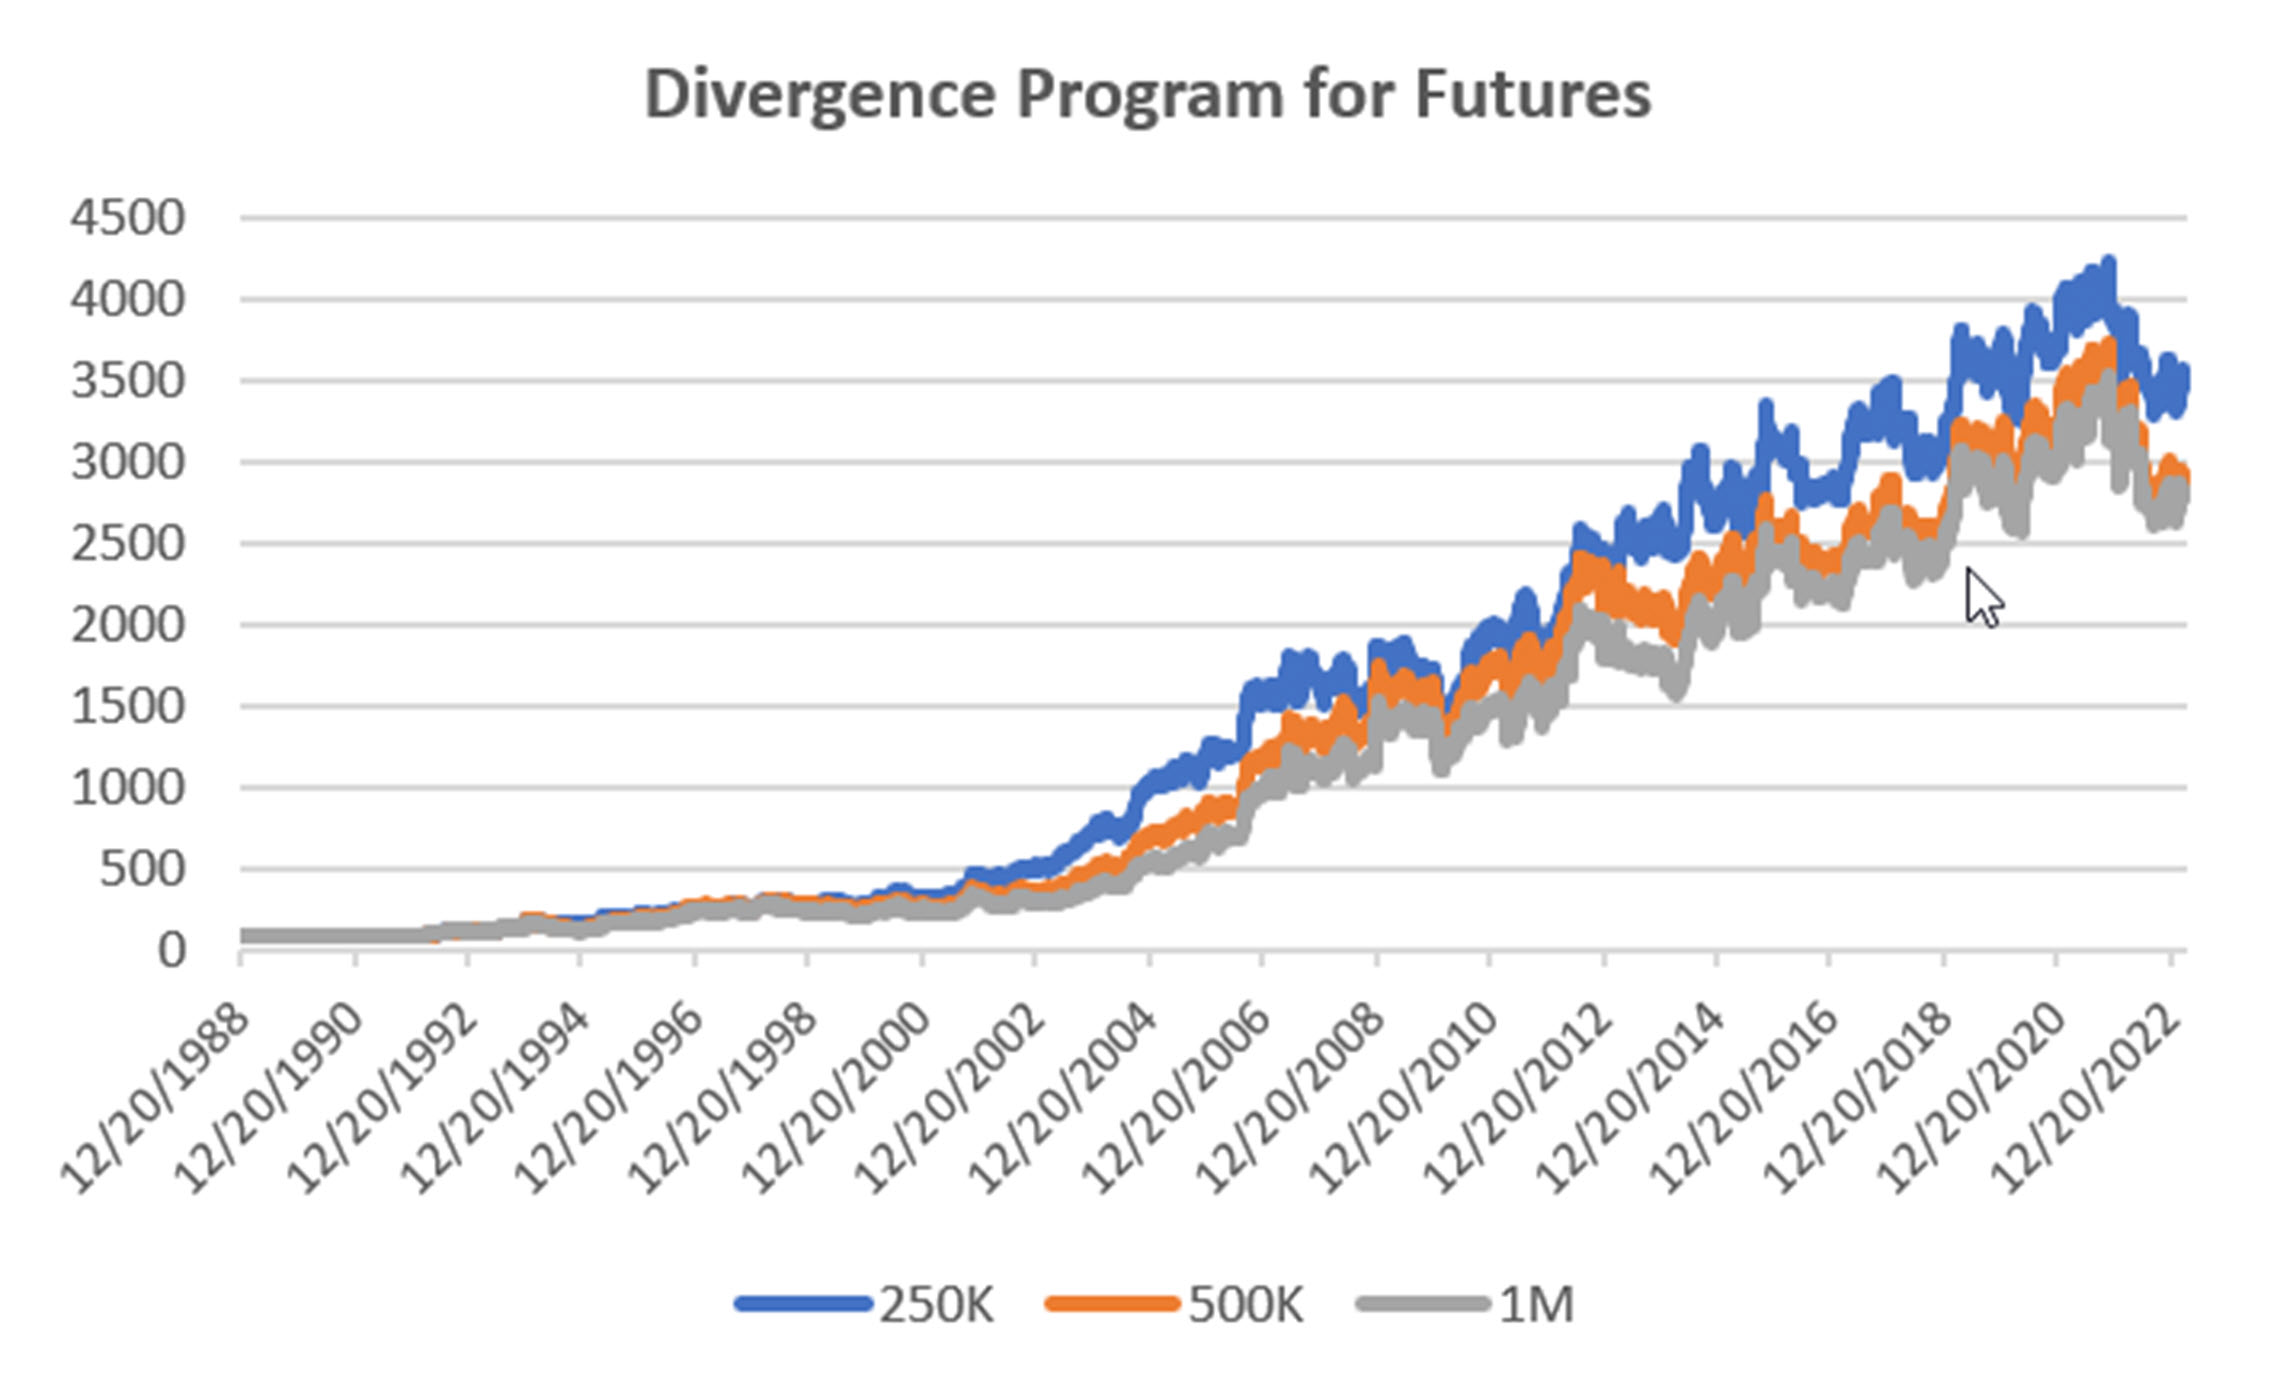
Group DF2: Daily Divergence Portfolio for Futures
While the Futures Trend program took a beating, the Futures Divergence Program gained fractionally in March and remains position in all portfolios for the year. Waiting for a specific set-up turned out to be an advantage in March.
Blogs and Recent Publications
Perry’s books are all available on Amazon or through our website, www.kaufmansignals.com.
April 2023
On April 18th, about mid-day in New York, Perry will present to the Society of Technical Analysts (London) on how to develop and test a successful trading system. Check their website for more details, https://www.technicalanalysts.com..
The April issue of Technical Analysis of Stocks & Commodities published a new article by Perry, “Repatriation,” an interesting trading pattern used by FX traders but adapted for us “normal traders.”
March 2023
Perry was interviewed by Mark Ursell of Ursell of TradeInform on March 3. You can see it or listen to it on UTube https://www.youtube.com/watch?v=9gIlIIzngCk.
A new article by Perry, “Can Volume Predict Price?” in the March issue of Technical Analysis of Stocks & Commodities. You’ll need to read it to find out!
February 2023
The February 2023 issue of Technical Analysis of Stocks & Commodities published Perry’s article, “Do Small Price Changes Matter?” It tells you whether you should be ignoring those days when prices close up or down by a fraction.
Perry gave a webinar to Eduardo Lopez’ Robotrader students in Spain on Wednesday, February 8, noon (New York).
January 2023
Another year! Technical Analysis of Stocks & Commodities published “Matching the Markets to the Strategy” in the January issue. It is a look at why certain markets do best with specific strategies and why that can materially improve results.
Alejandro de Luis will publish Perry’s article “Living Off Profits,” translated into Spanish, in the January issue of his magazine, Hispatrading. It’s a good way to practice your Spanish!
Seeking Alpha posted Perry’s article, “How To Hedge Your Equity Portfolio,” showing a way to follow the Fed action.
October 2022
An interview with Perry was featured in the October anniversary issue of Technical Analysis of Stocks & Commodities. The interviewer is his wife, Barbara Diamond, giving a different perspective on his career.
September 2022
“The Real Risk of System Trading” can be found in the September issue of Technical Analysis of Stocks & Commodities. It summarizes the many way we can measure risk and suggests ways that will help you.
July 2022
The basis for this month’s Close-Up was posted on Seeking Alpha June 16. This month, Perry posted “3 Ways to Reduce Risk and 2 Ways to Increase Profits.”
June 2022
The July issue of Technical Analysis of Stocks & Commodities has Perry’s latest article, “Is It Too Volatile to Trade?” It is important to understand when the risk is greater than the reward.
Perry posted “How To Tell When the Bear Market Has Ended” on Seeking Alpha. You might find it useful if you are thinking about getting back in.
May 2022
Perry’s webinar on risk, given to the U.K. Society of Technical Analysts, can be seen using the following link: https://vimeo.com/708691362/04c8fb70ea
The presentation for MetaStock is available on Youtube using the link:
The May issue of Technical Analysis of Stocks & Commodities has a new article by Perry, “In-Sample Test Data, Out-of-Sample Data – Does It Really Matter?” It is a different look at testing.
Older Items of Interest
For older articles please scan the websites for Technical Analysis of Stocks & Commodities, Modern Trader, Seeking Alpha, ProActive Advisor Magazine, and Forbes. You will also find recorded presentations given by Mr. Kaufman at BetterSystemTrader.com, TalkingTrading.com, FXCM.com, systemtrade.pl, the website for Alex Gerchik, Michael Covel’s website, TrendFollowing.com, and Talking Trading.com.
In May 2021, Mr. Kaufman gave a 30-minute presentation, “Lagged Trends,” for The Money Show on Tuesday, May 11. You can see it using the following link: https://youtu.be/bh2fA8oBwBk
November 1, 2020, Mr Kaufman taped a session with Andrew Swanscott’s BetterSystemTrader.com.
“The 1st and 2nd Cross” has been very popular with readers. It was published in Technical Analysis of Stocks & Commodities in the March 2020 issue. It is based on an idea of Linda Raschke and captures small but reliable pieces of a trending move. You can find it online.
You will also find back copies of our “Close-Up” reports on our website, www.kaufmansignals.com. You can address any questions to perry@kaufmansignalsdaily.com.
© March 2023, Etna Publishing, LLC. All Rights Reserved.