
Industry Benchmark Performance
As of June 2, very few funds have posted returns. The chart below is accurate through April, but June returns are minimal.
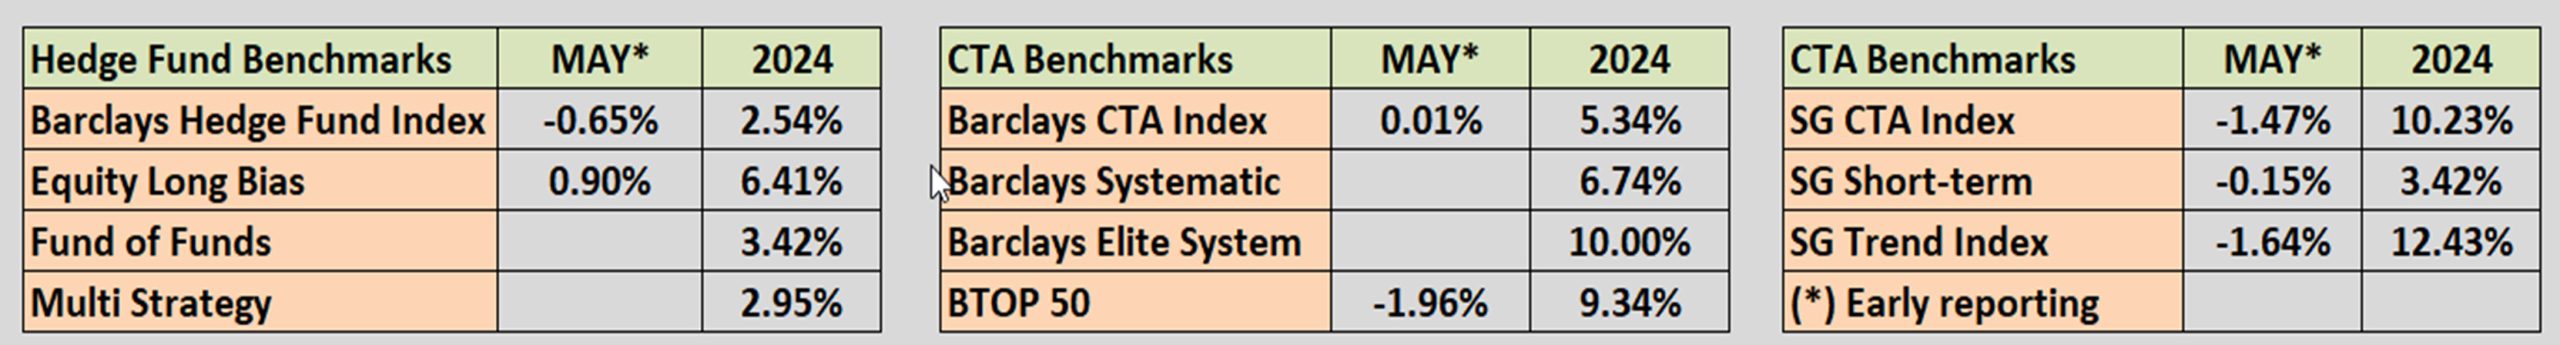
Source: BarclayHedge Indices.
Kaufman’sMost Popular Books (available on Amazon)
Trading Systems and Methods, 6th Edition. The complete guide to trading systems, with more than 250 programs and spreadsheets. The most important book for a system developer.
Kaufman Constructs Trading Systems. A step-by-step manual on how to develop, test, and trade an algorithmic system.
Learn To Trade. Written for both serious beginners and practiced traders, this book includes chart formations, trends, indicators, trading rules, risk, and portfolio management. You can find it in color on Amazon.
You can also find these books on our website, www.kaufmansignals.com.
Blogs and Recent Publications
Find Mr. Kaufman’s other recent publications and seminars at the end of this report. We post new interviews, seminars, and reference new articles by Mr. Kaufman each month.
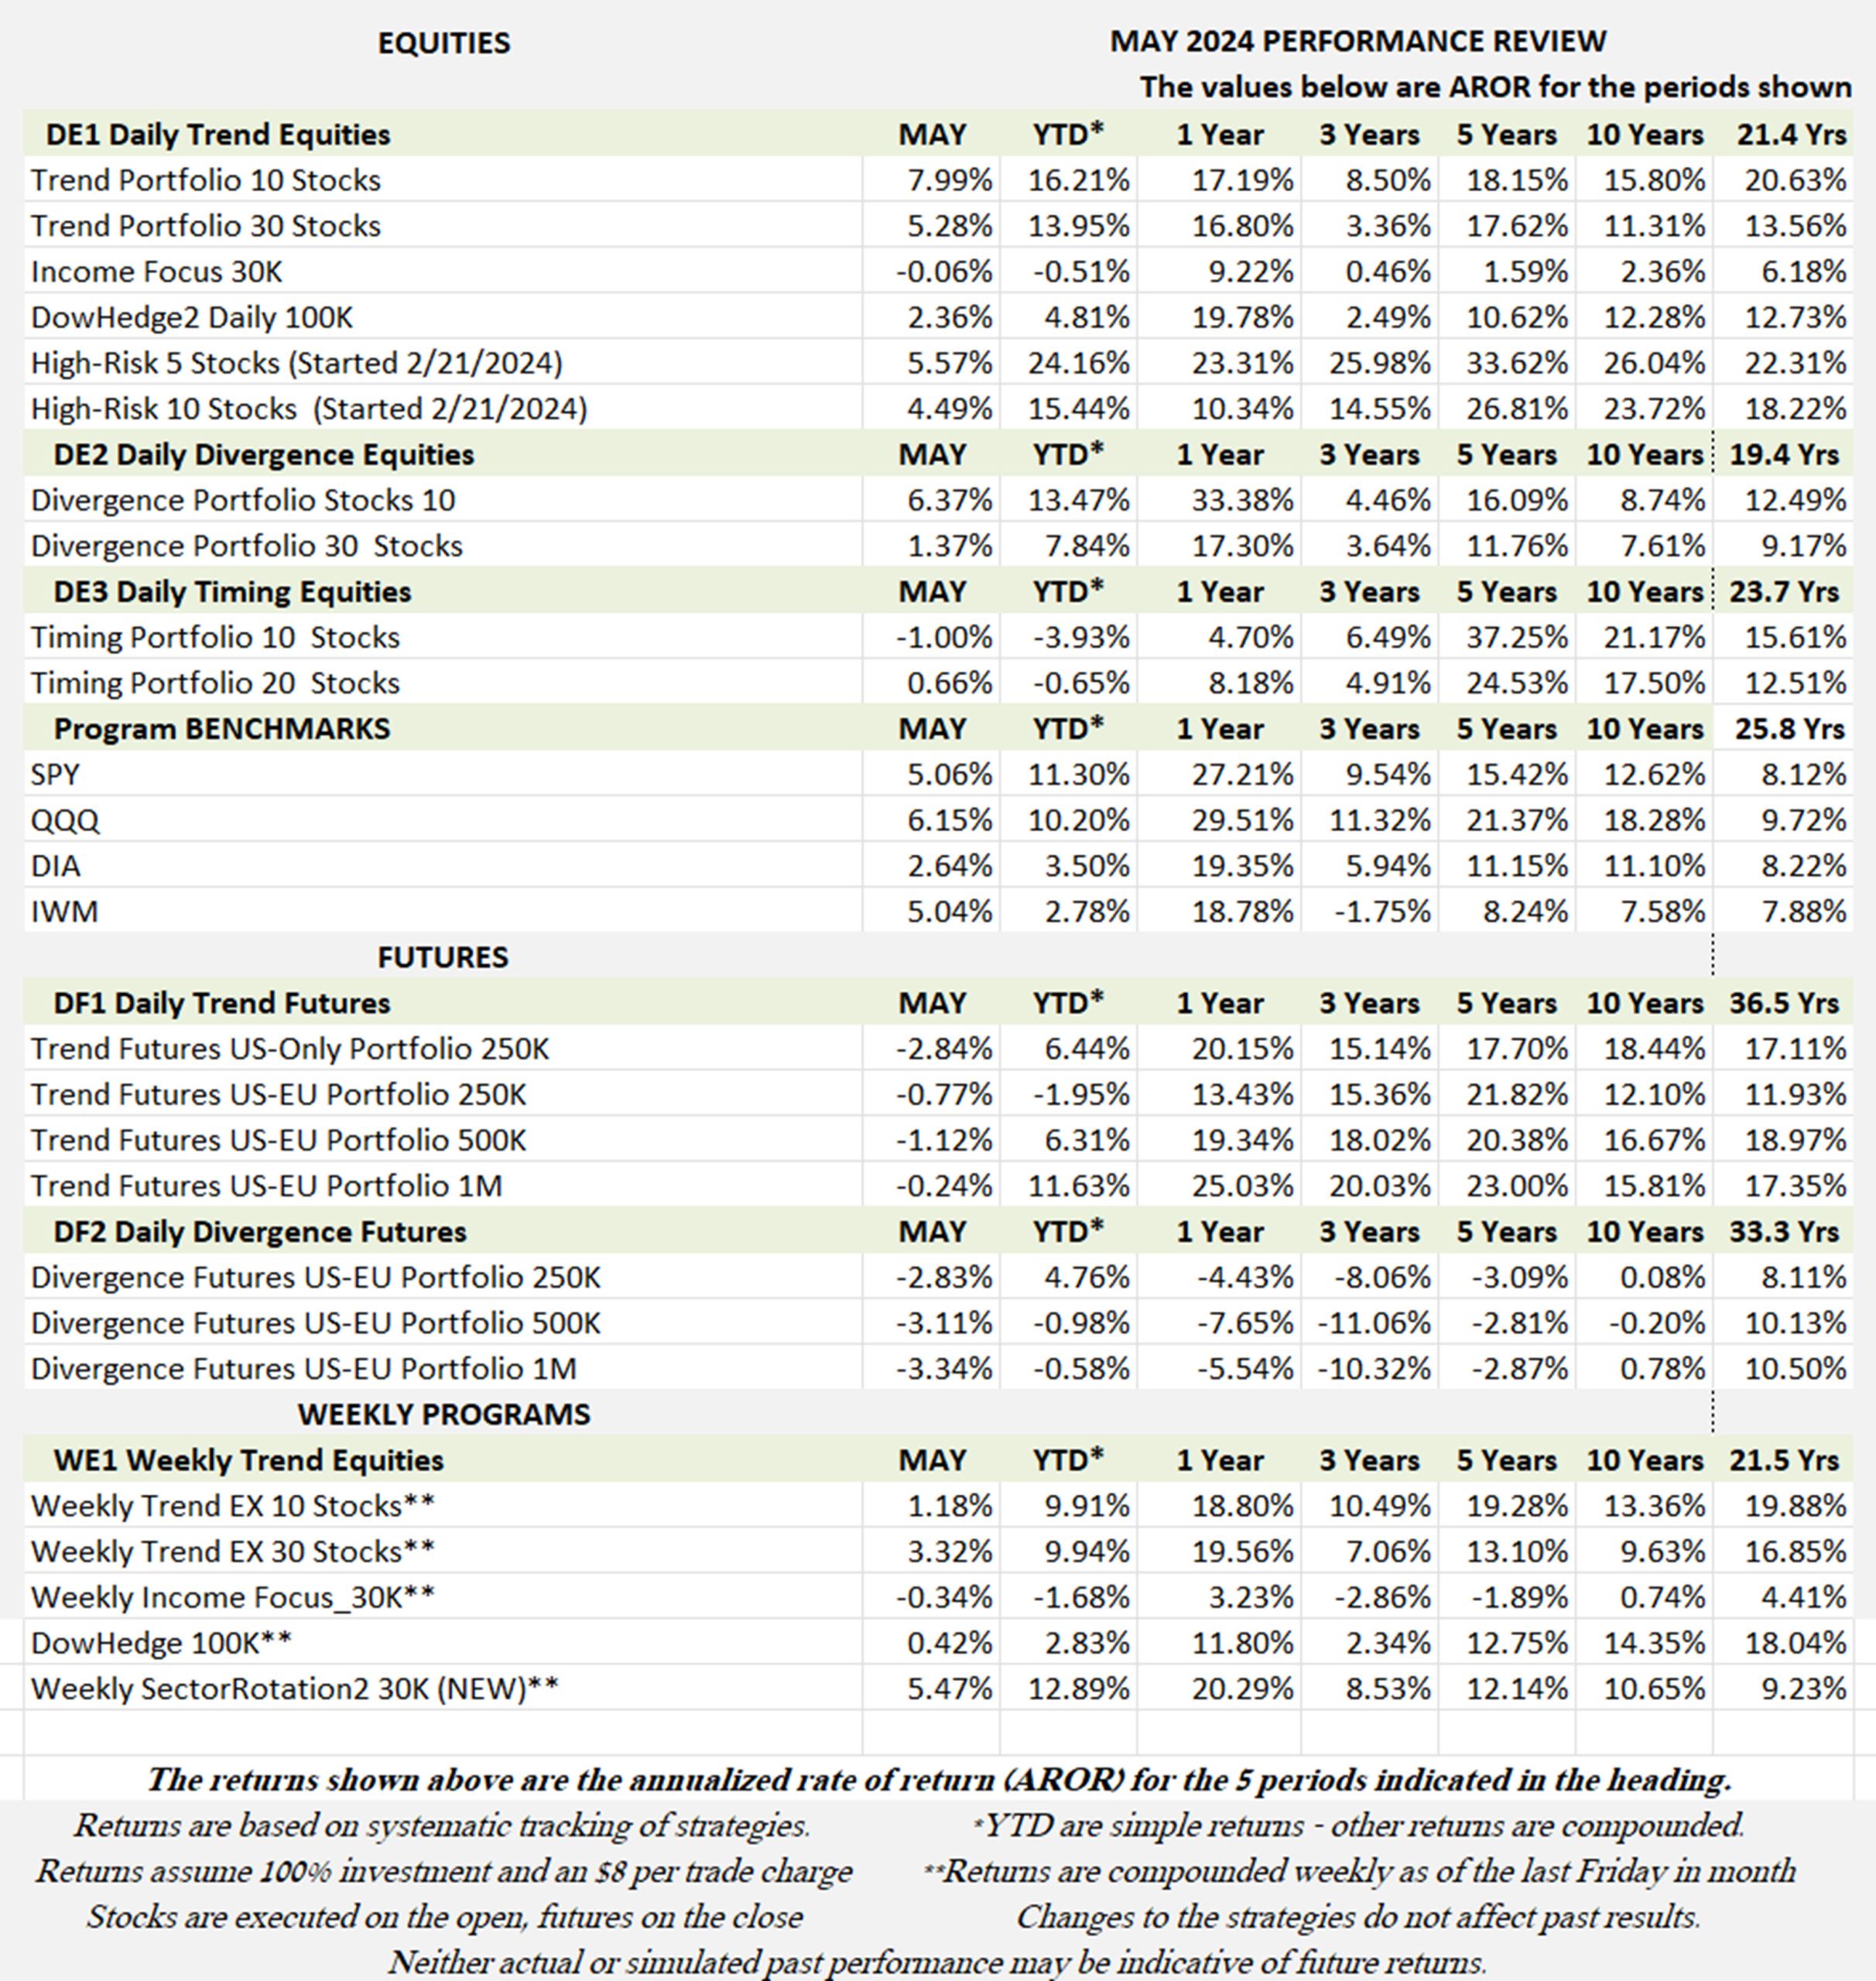
May Performance in Brief
A good month for stocks, especially given the certainty of “higher for longer.” Gains were not limited to tech/semi stocks, which are still holding onto gains but have been very volatile. GE and LLY seem to be the favorite non-tech stocks, although Micron, Qualcomm, and Taiwan Semi are still in the running.
Our “high-risk” portfolio returned less than the benchmark trend program, but still had a decent gain for May. The Timing program took a big hit this past week, trading Kohls (KSS). Futures had small losses but are mostly higher for the year. The usually profitable markets, interest rates and FX are stuck waiting for the Fed to do something new.
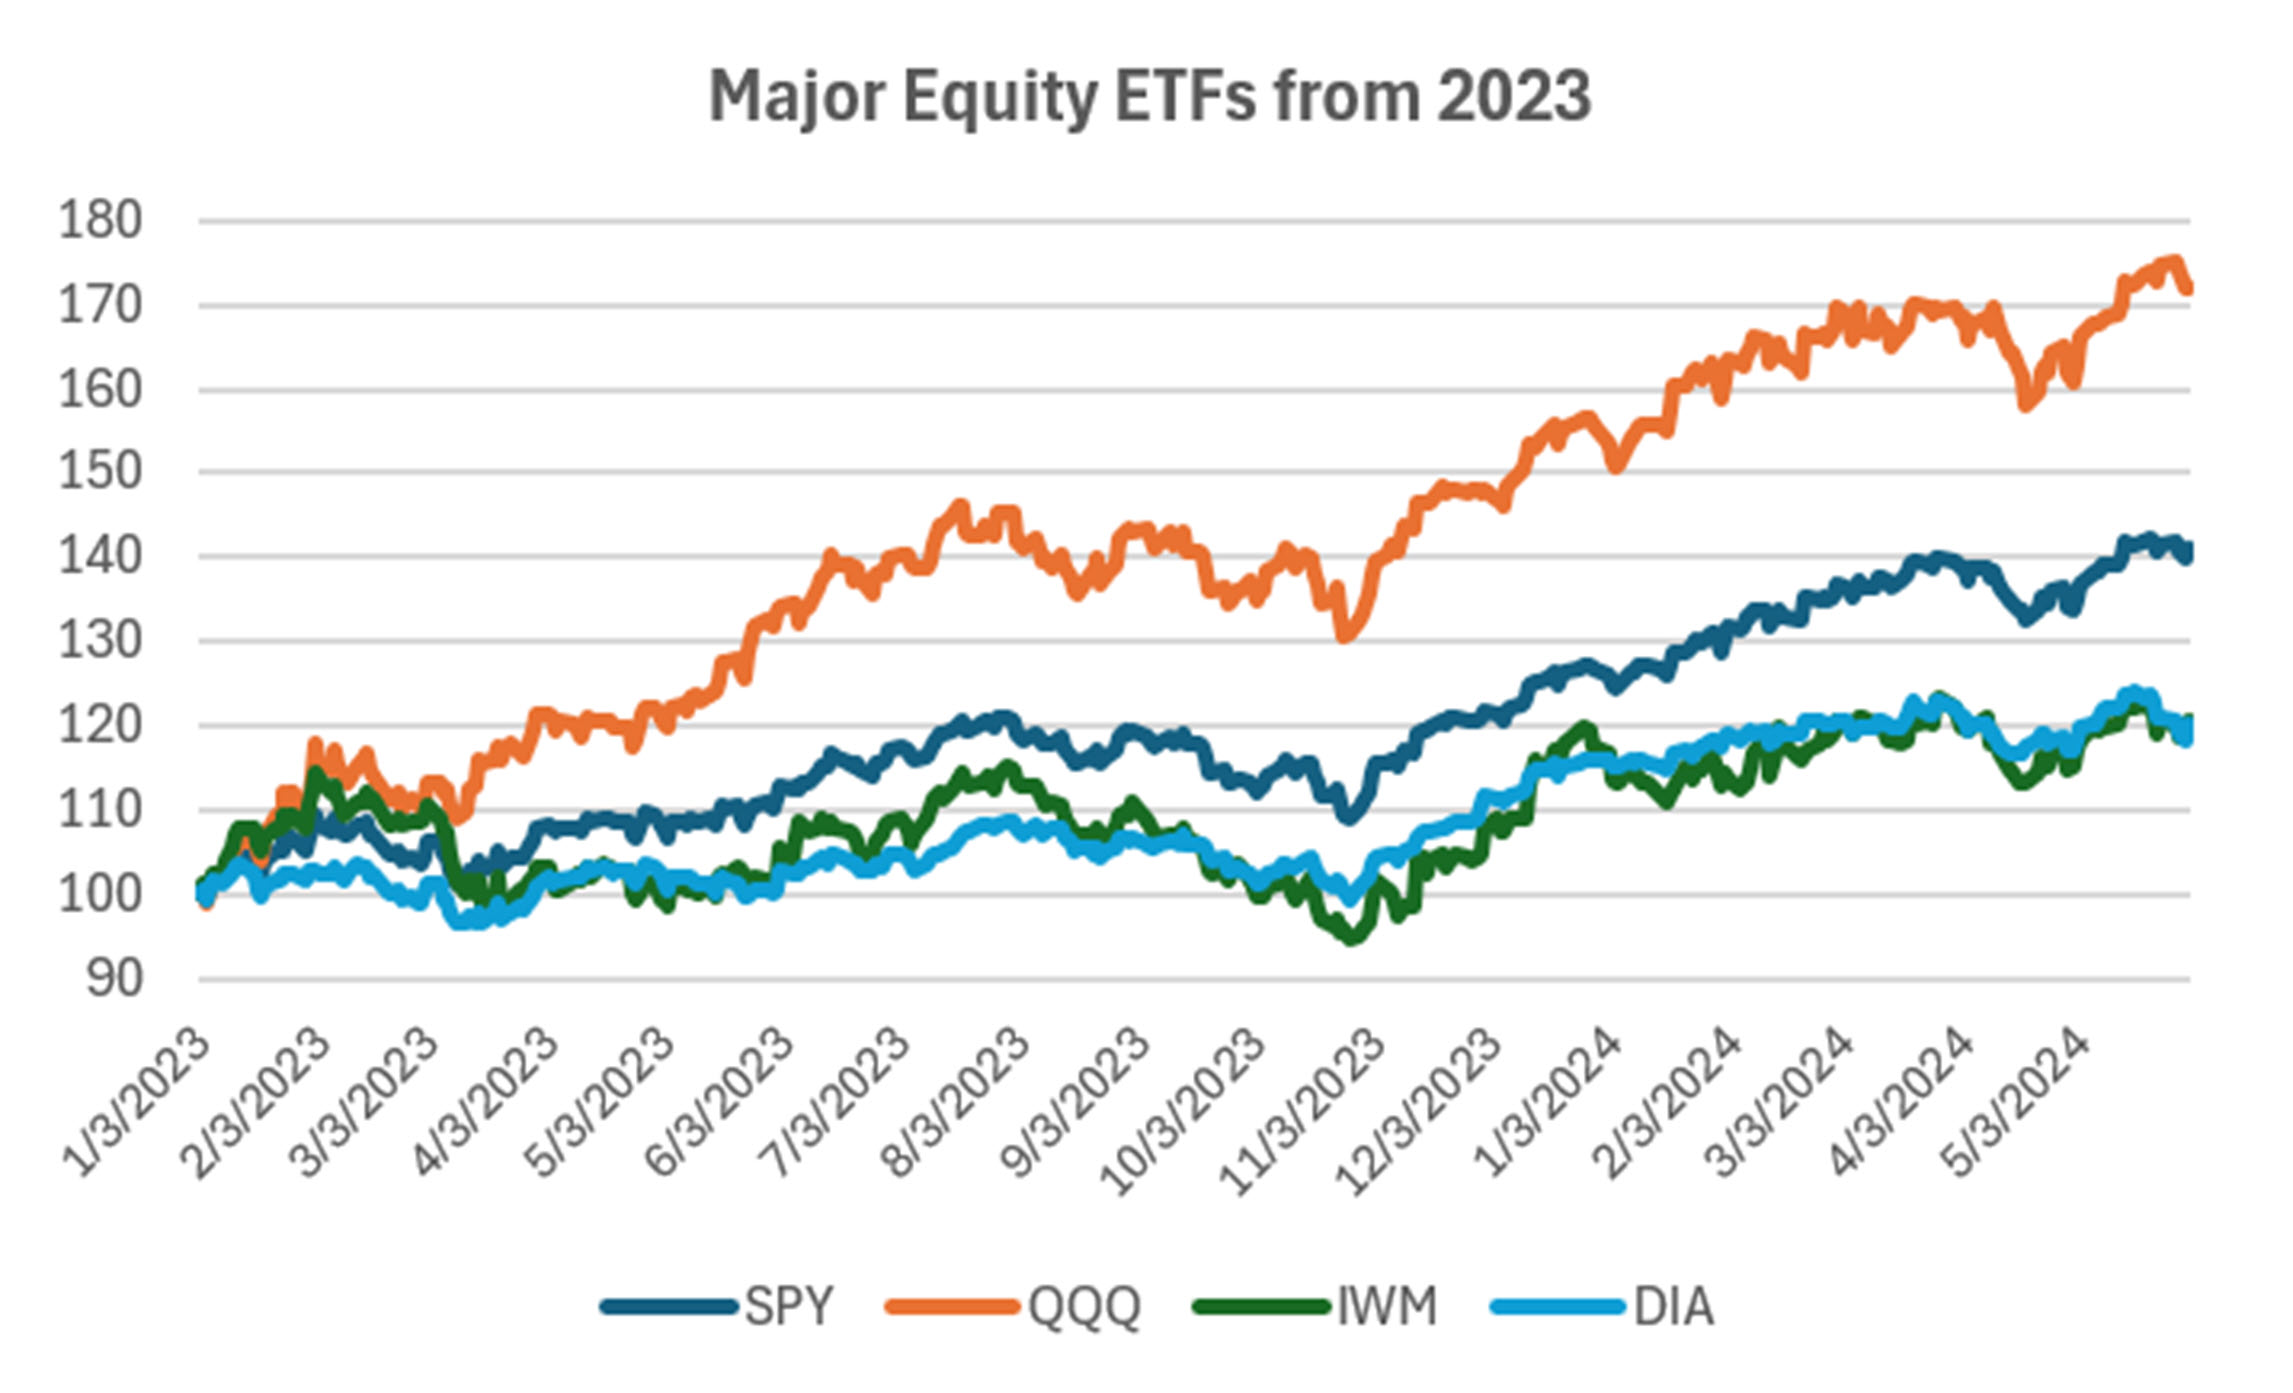
Major Equity ETFs
Flip-floppy again, with NASDAQ (QQQ) in the lead, the major equity ETFs gained more than 5% with only the DIA lagging at 2.6%. We always feel that anything above 10% is better than average, but we still have most of the year to complete. If the Fed gives signs of lowering rates, it could be a good year.
CLOSE-UP: Is It the Same MEME Trade as in 2021?
Even if you have no interest in MEMES or BITCOIN, they offer a lesson in opportunity and risk. Times have changed since MEMES became popular, and the risk and reward of BITCOIN has changed as well.
For those investors not familiar with “MEMES,” they are stock purchases that are triggered by social media. I have no idea how that name came to be. But I remember that it all started with Robinhood (HOOD), a broker with a phone app in 2021, appealing to younger traders. That makes it easy to buy stocks and just as easy to lose money.
The initial motivation of MEMES was to “get even” with the big players who were net short stocks in AMC Entertainment (AMC) and Gamestop (GME). Messages were sent to telephones, traders bought, and the stocks rallied. Robinhood seemed to be the broker of choice.
The motivator in this trade was said to be “Roaring Kelly” (actually Keith Gill). One needs to wonder where Gill entered the market before he supposedly started the rumors. One source says Gill, who bought thousands of shares of the stock at its bottom, would have made millions as amateur traders followed his lead.
Below are two charts showing the 2021 rallies in AMC and GME (and the recent one!). AMC peaked on 6/14/2021 with volume of 130 million. GME peaked on 1/25/2021 with volume of 2.2 billion. Pretty good for stocks that were languishing at lows.
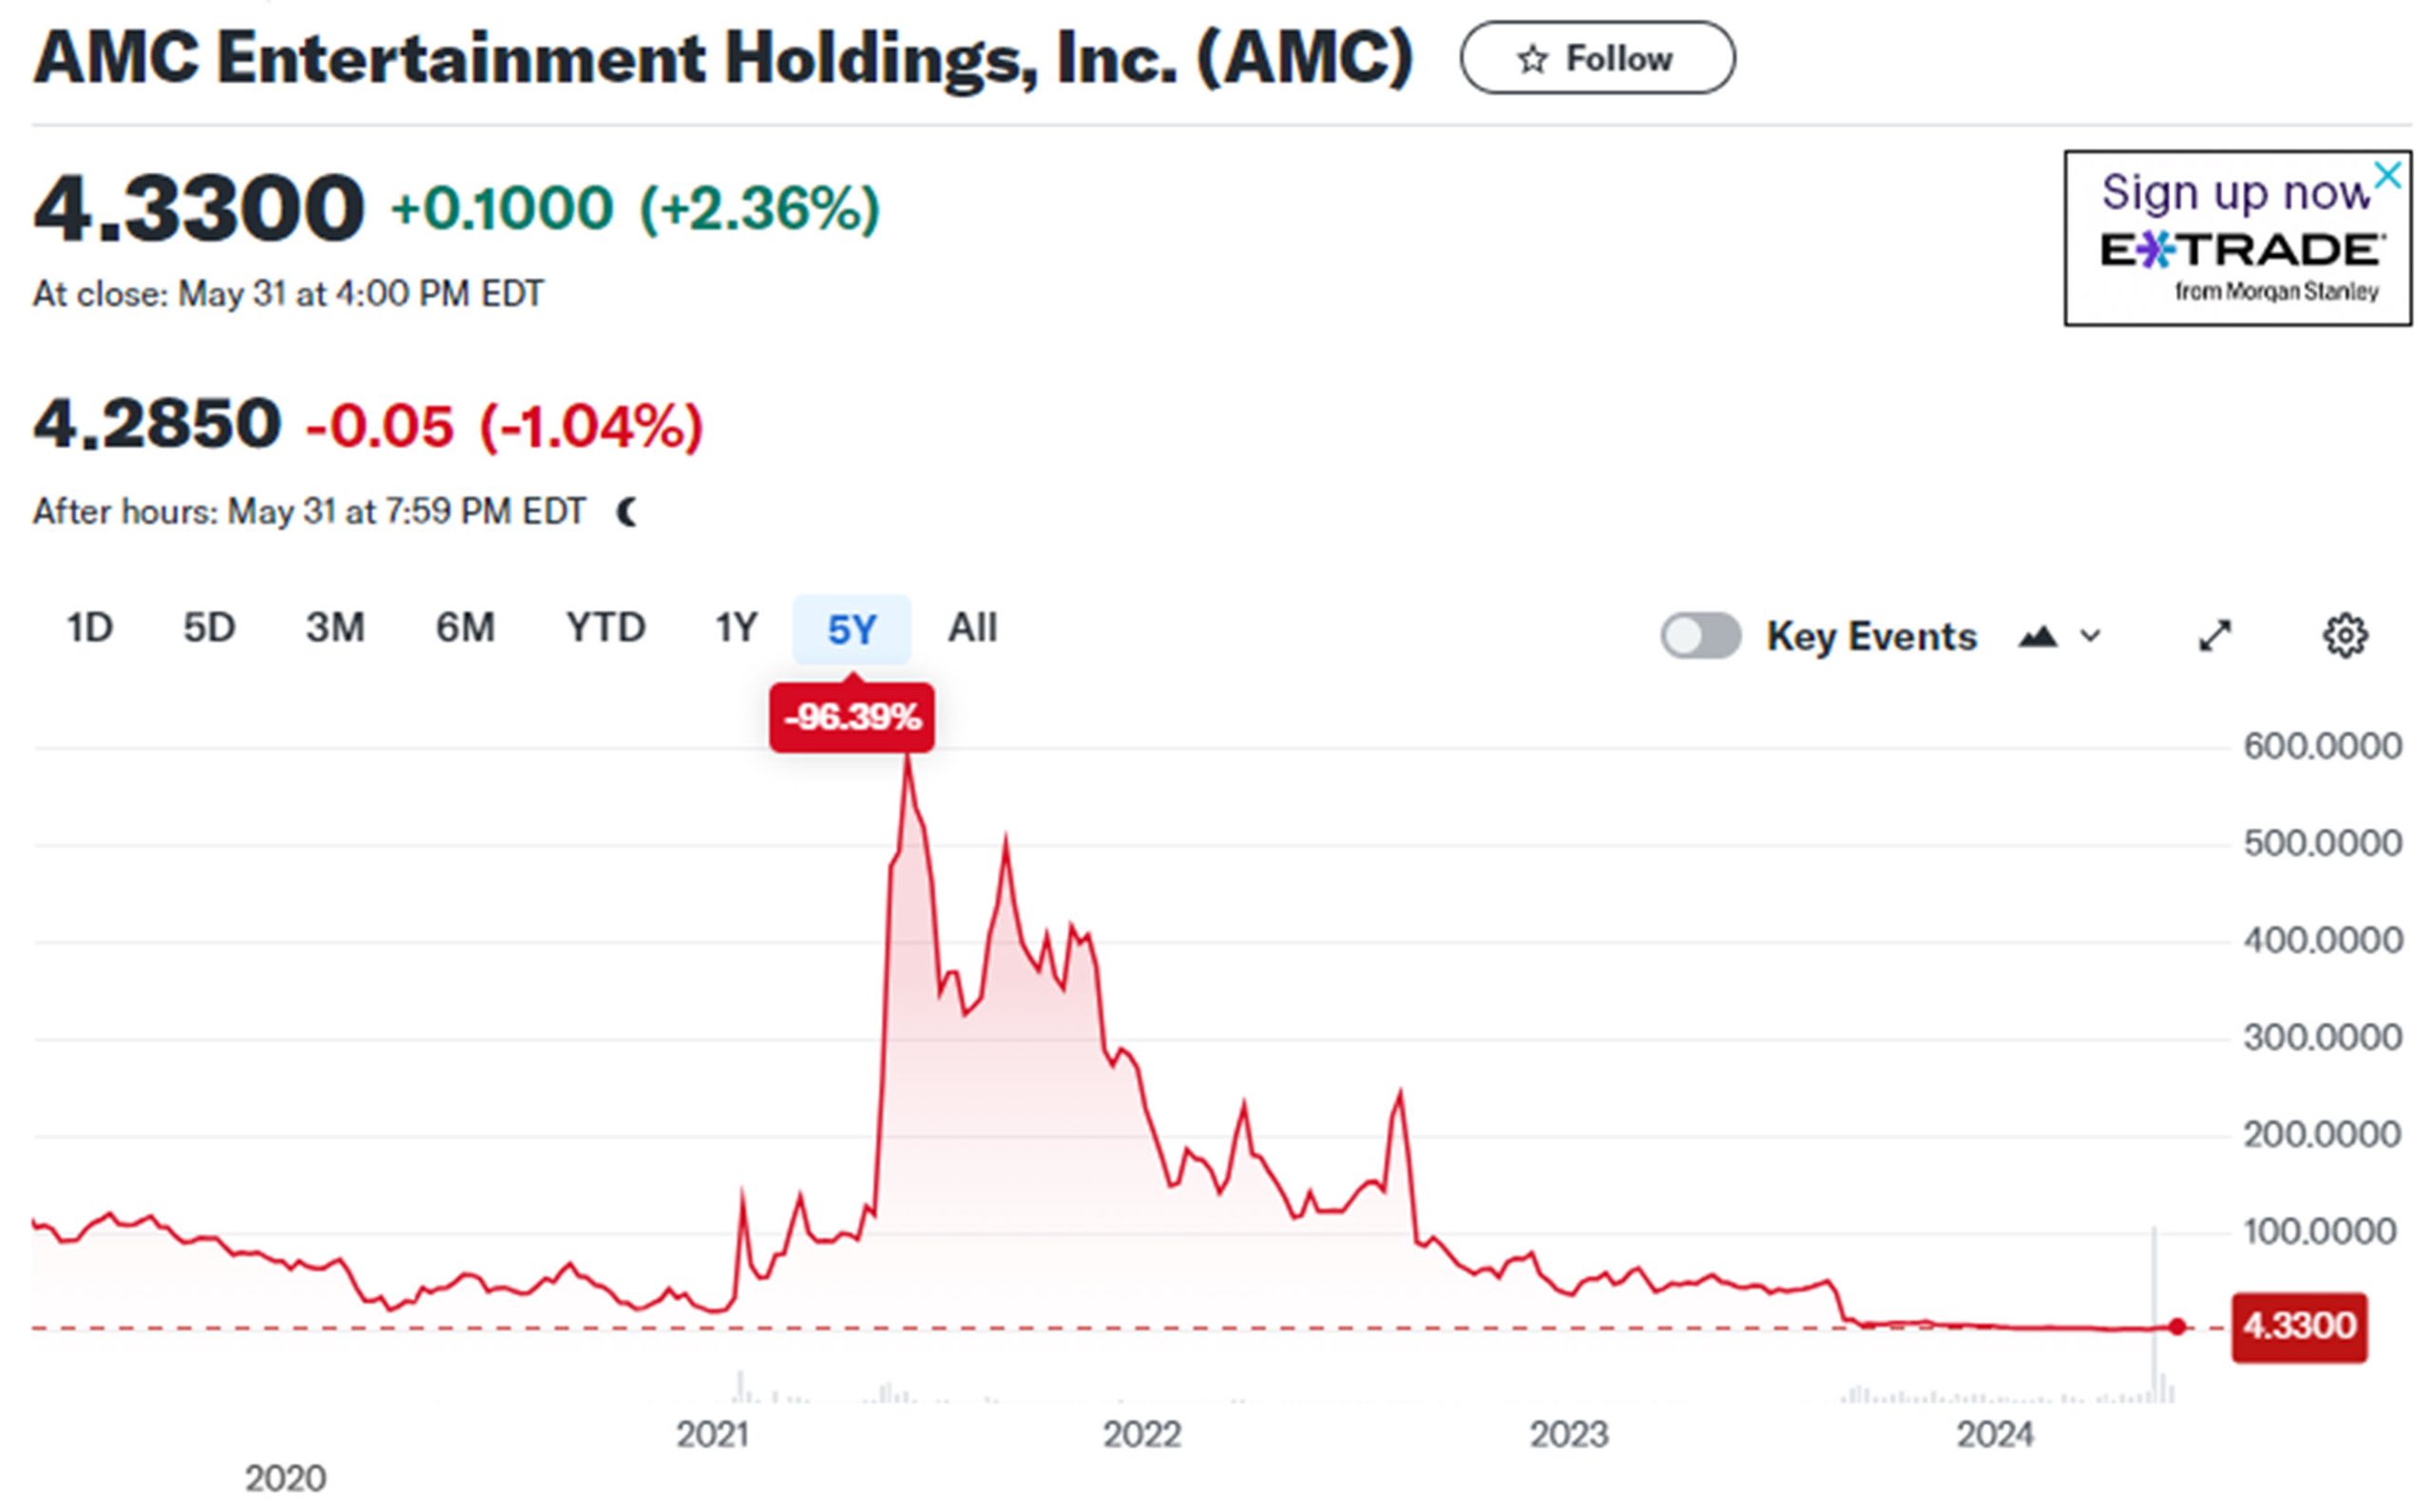
Figure 1. AMC prices from 2020. Source: Yahoo finance.

Figure 2. GameStop (GME) prices from 2020. Source: Yahoo Finance.
As a trader, I am skeptical where the MEME traders entered the rally, although there is no doubt that short sellers were in trouble when GME surged 688% in 2021. In retrospect, it was a good opportunity for a mean-reversion trade. A lesson to be carried forward.
How did the broker (Robinhood) fare? It went public in 2022 based on volume from the MEME trades. Figure 3 shows that it peaked early and since settled at a lower value.
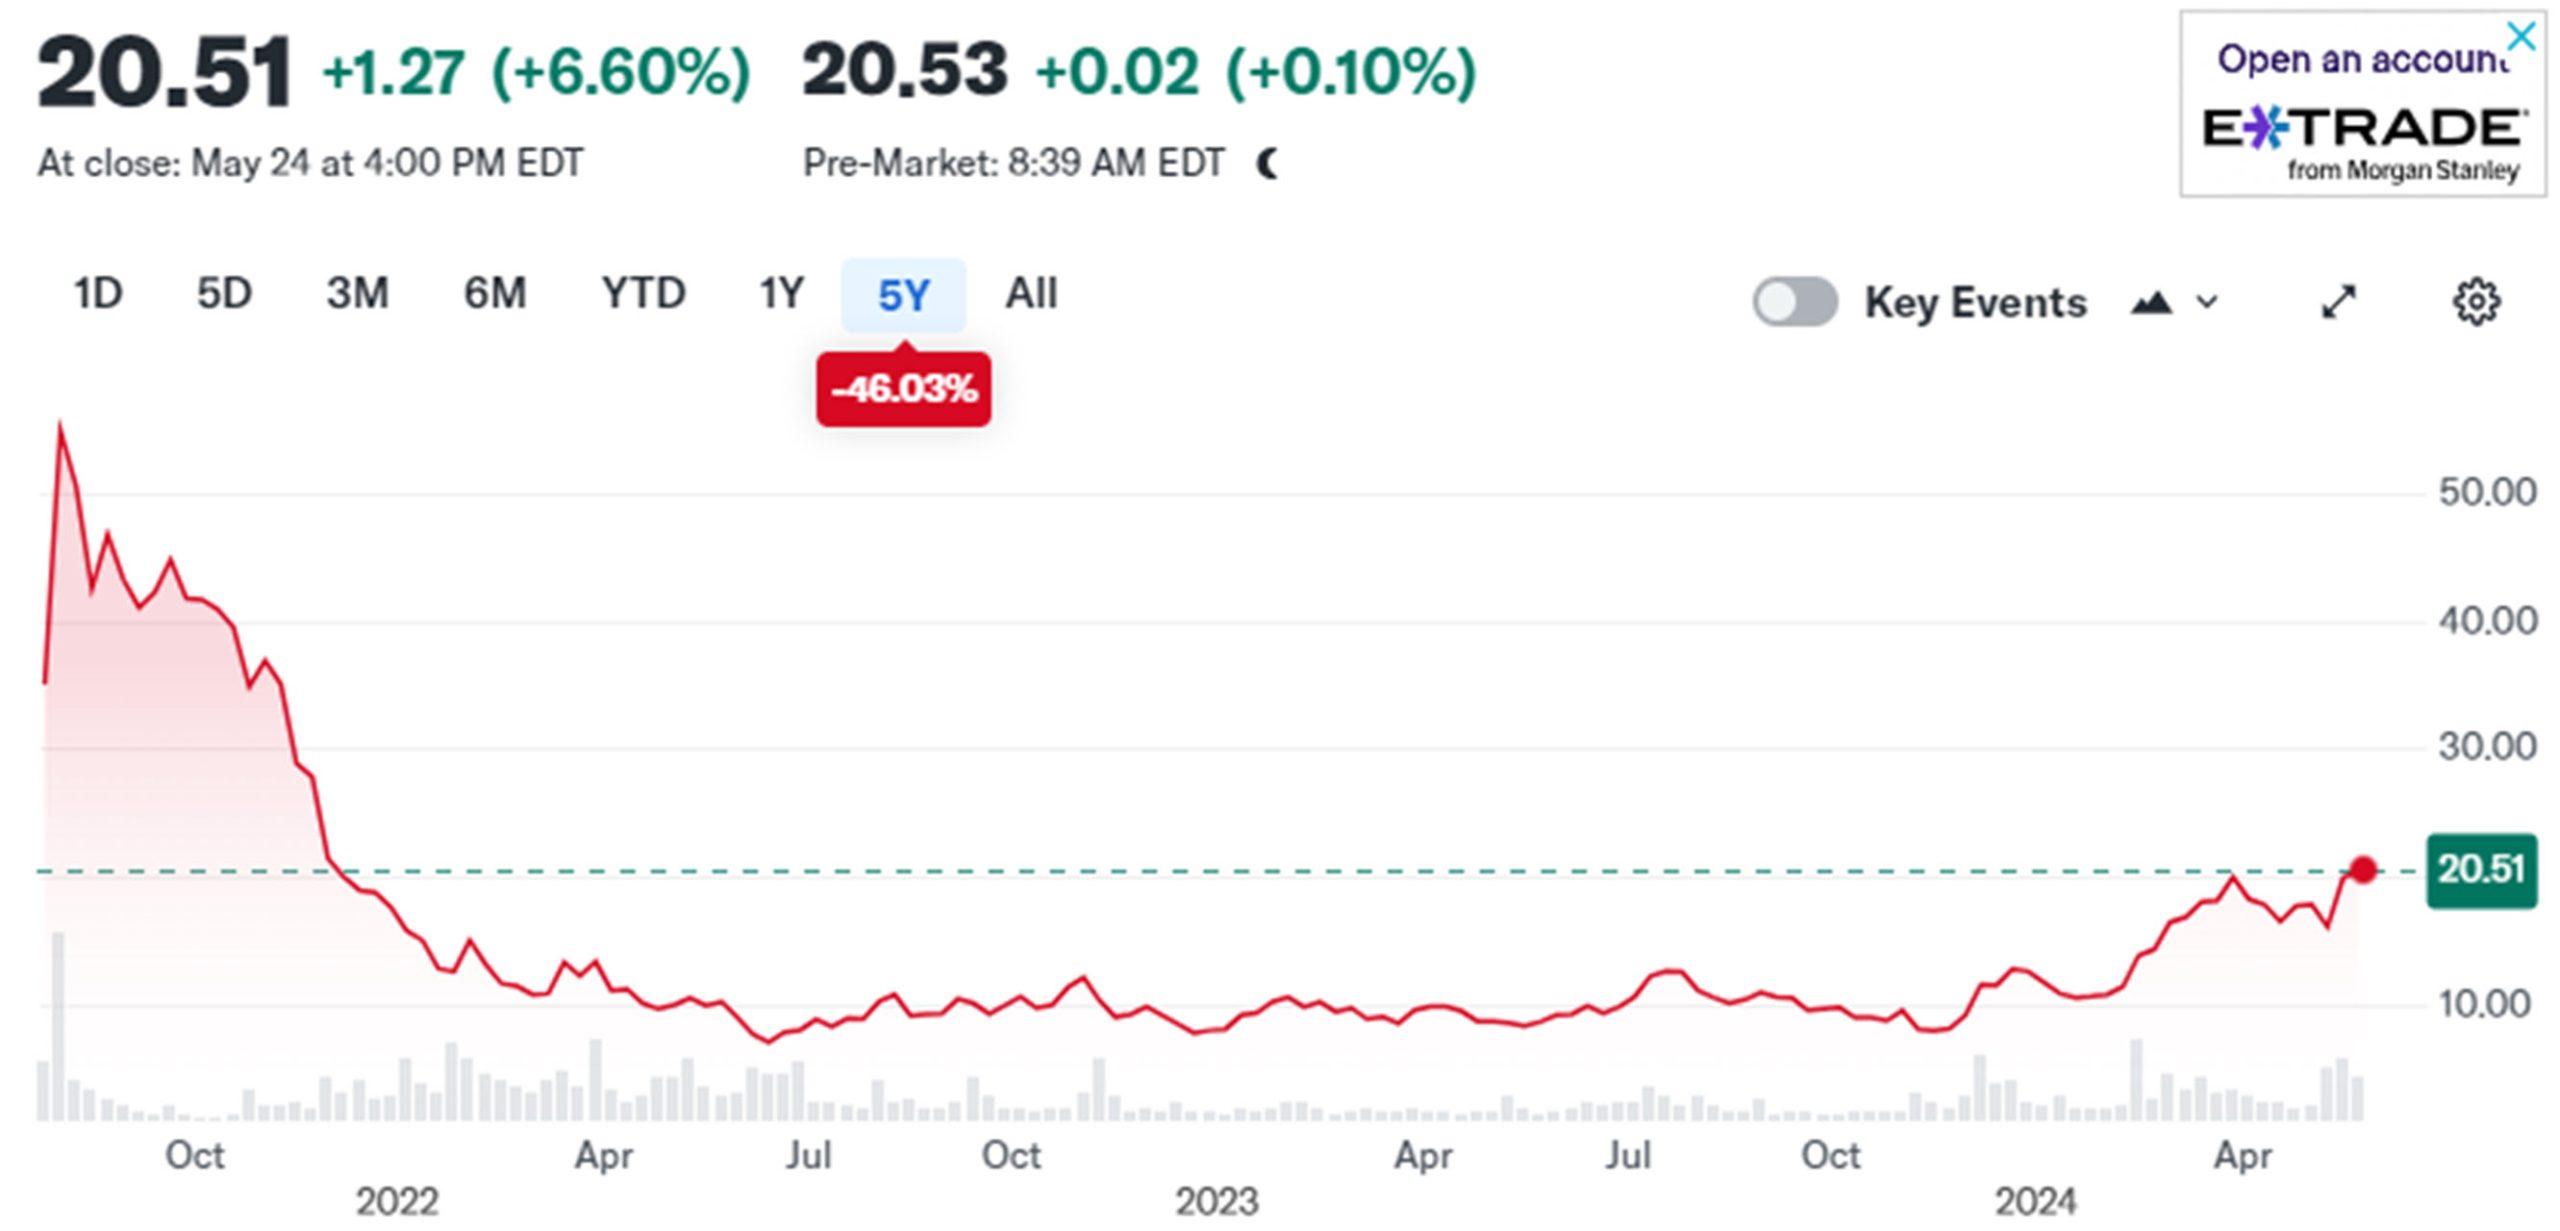
Figure 3. Robinhood (HOOD) prices since its IPO in 2022. Source: Yahoo finance.
Again, in May 2024
In mid-May (last month), Roaring Kelly surfaced again. This time promoting buys in AMC, GME, Blackberry (BB), and Koss (KOSS), stocks with large short sellers. Could it happen again? Figures 4 and 5 show the recent price action of AMC and GME. While volume in 2021 reached 130 million for AMC, this May volume was 28 million. GME traded 2.2 million in 2021, this month it as 19 million.
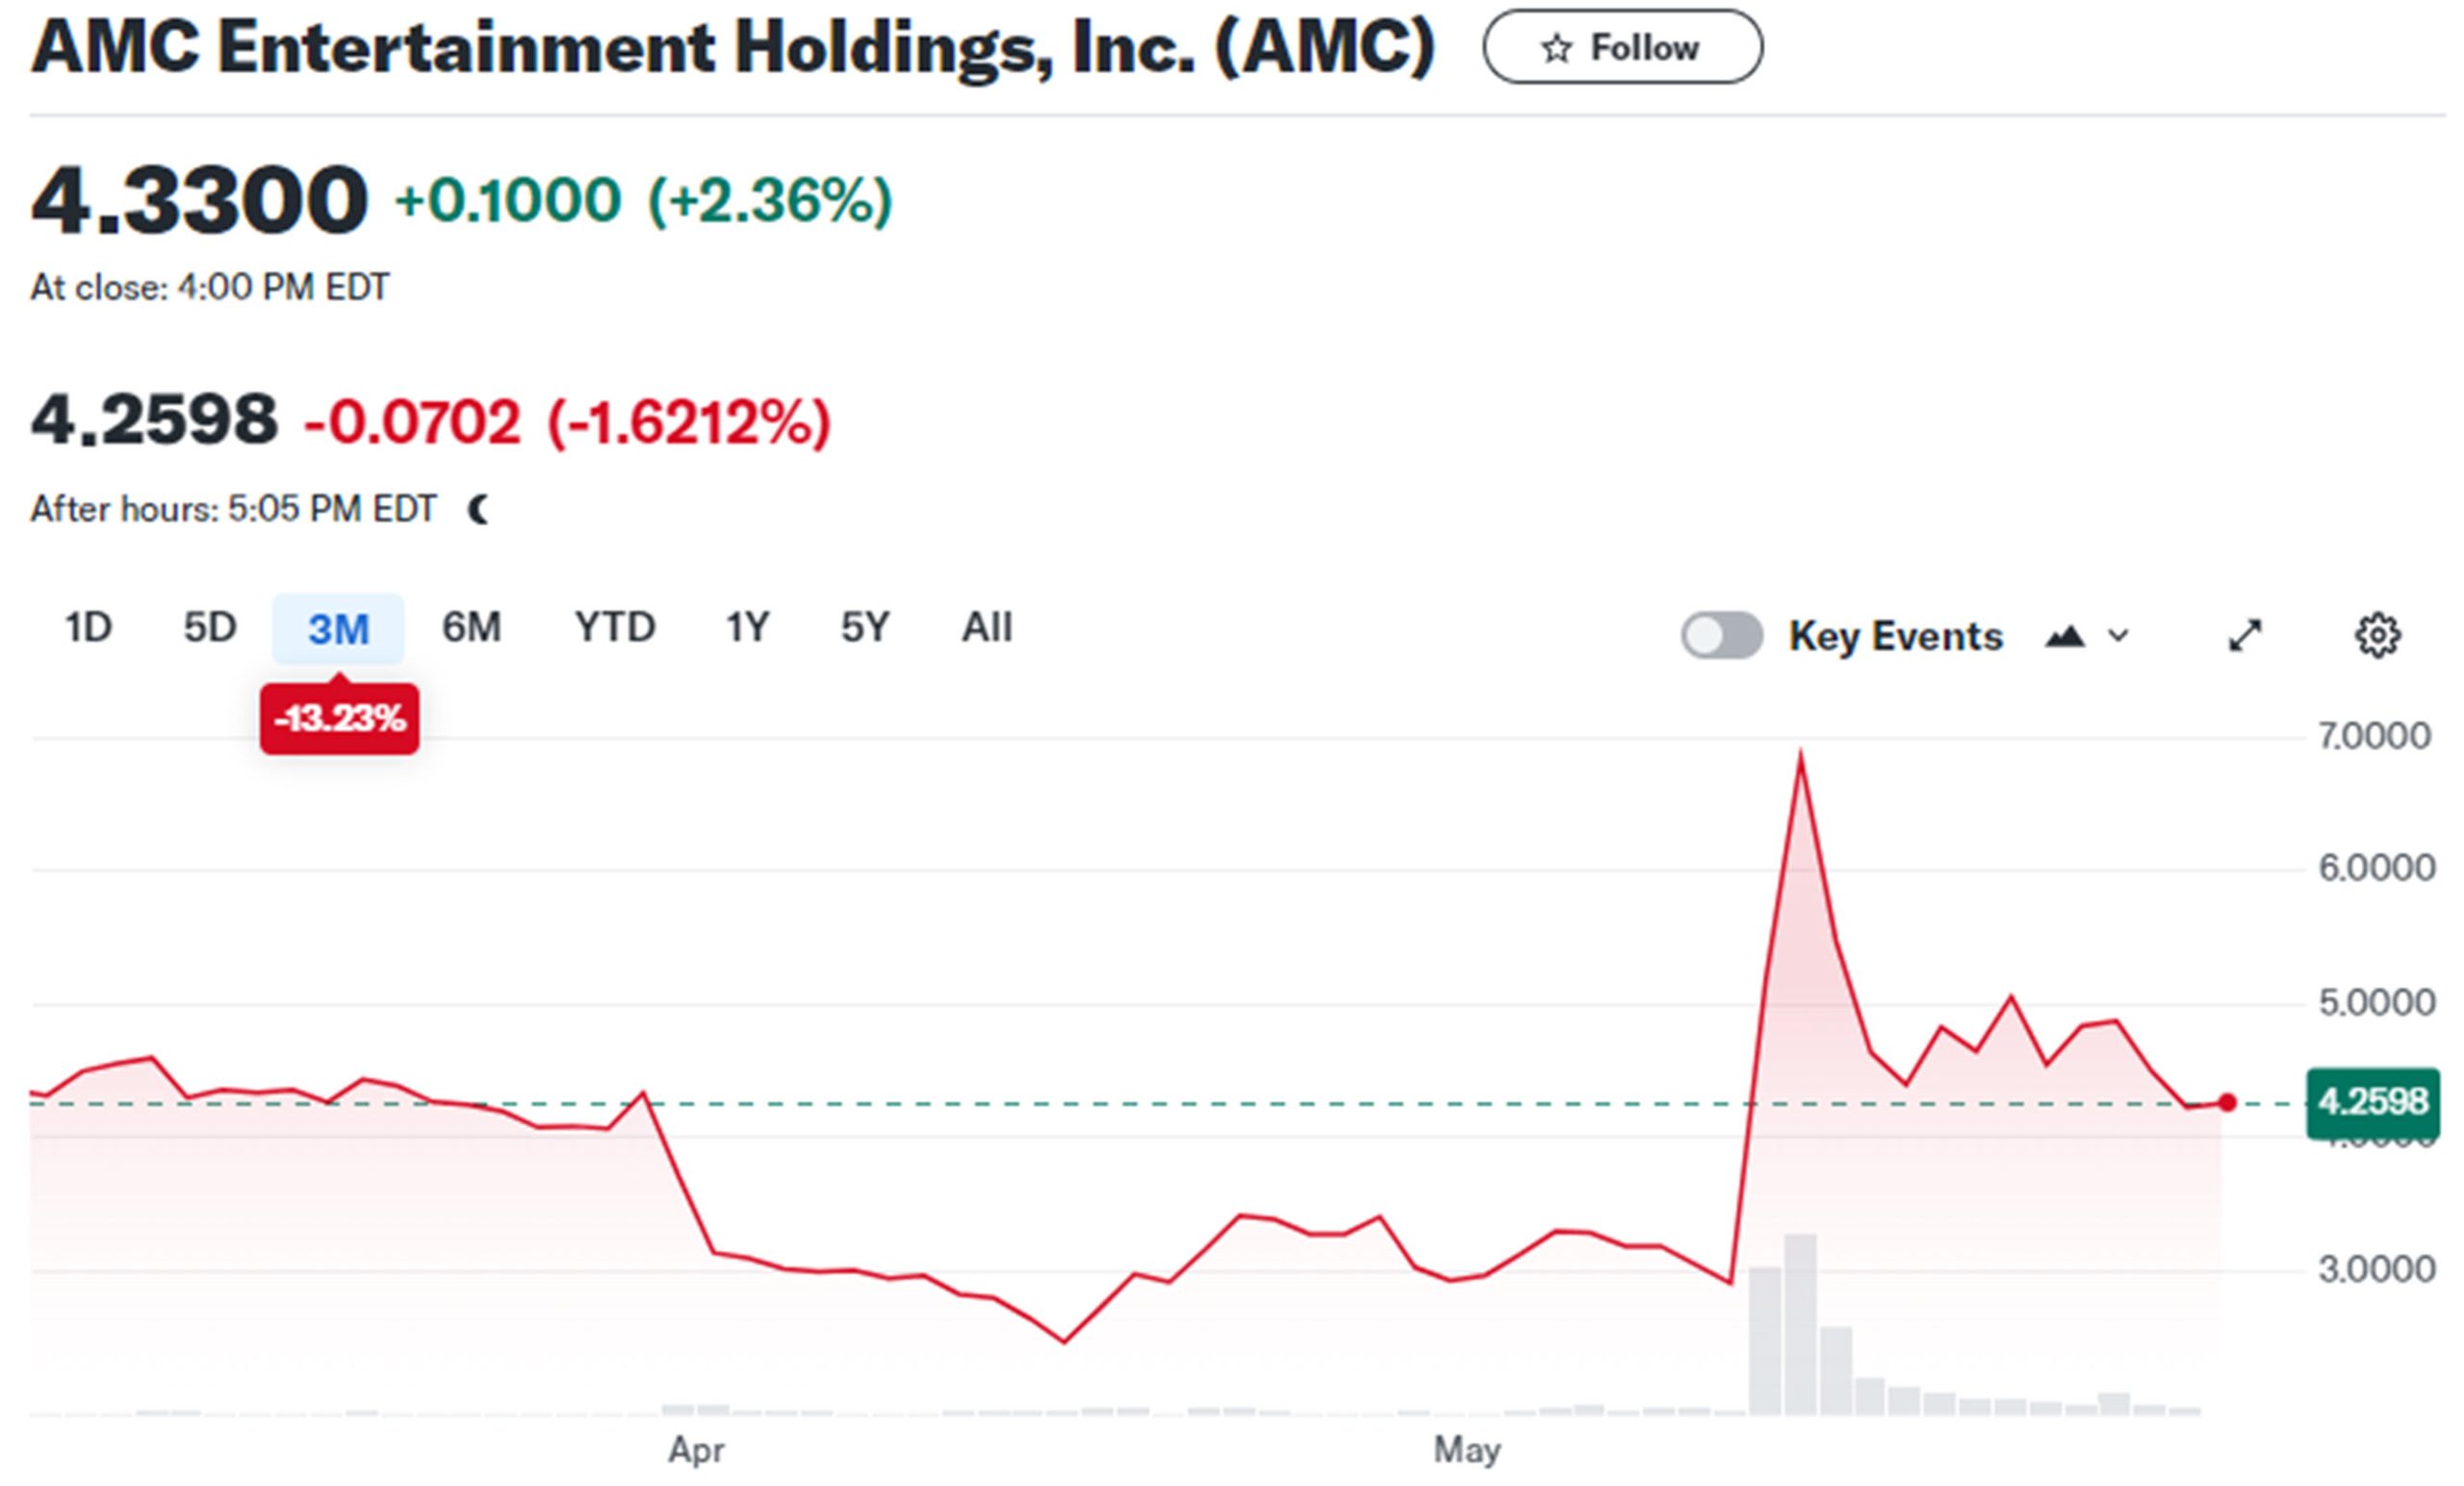
Figure 4. AMC prices, last 3 months. Source: Yahoo finance.
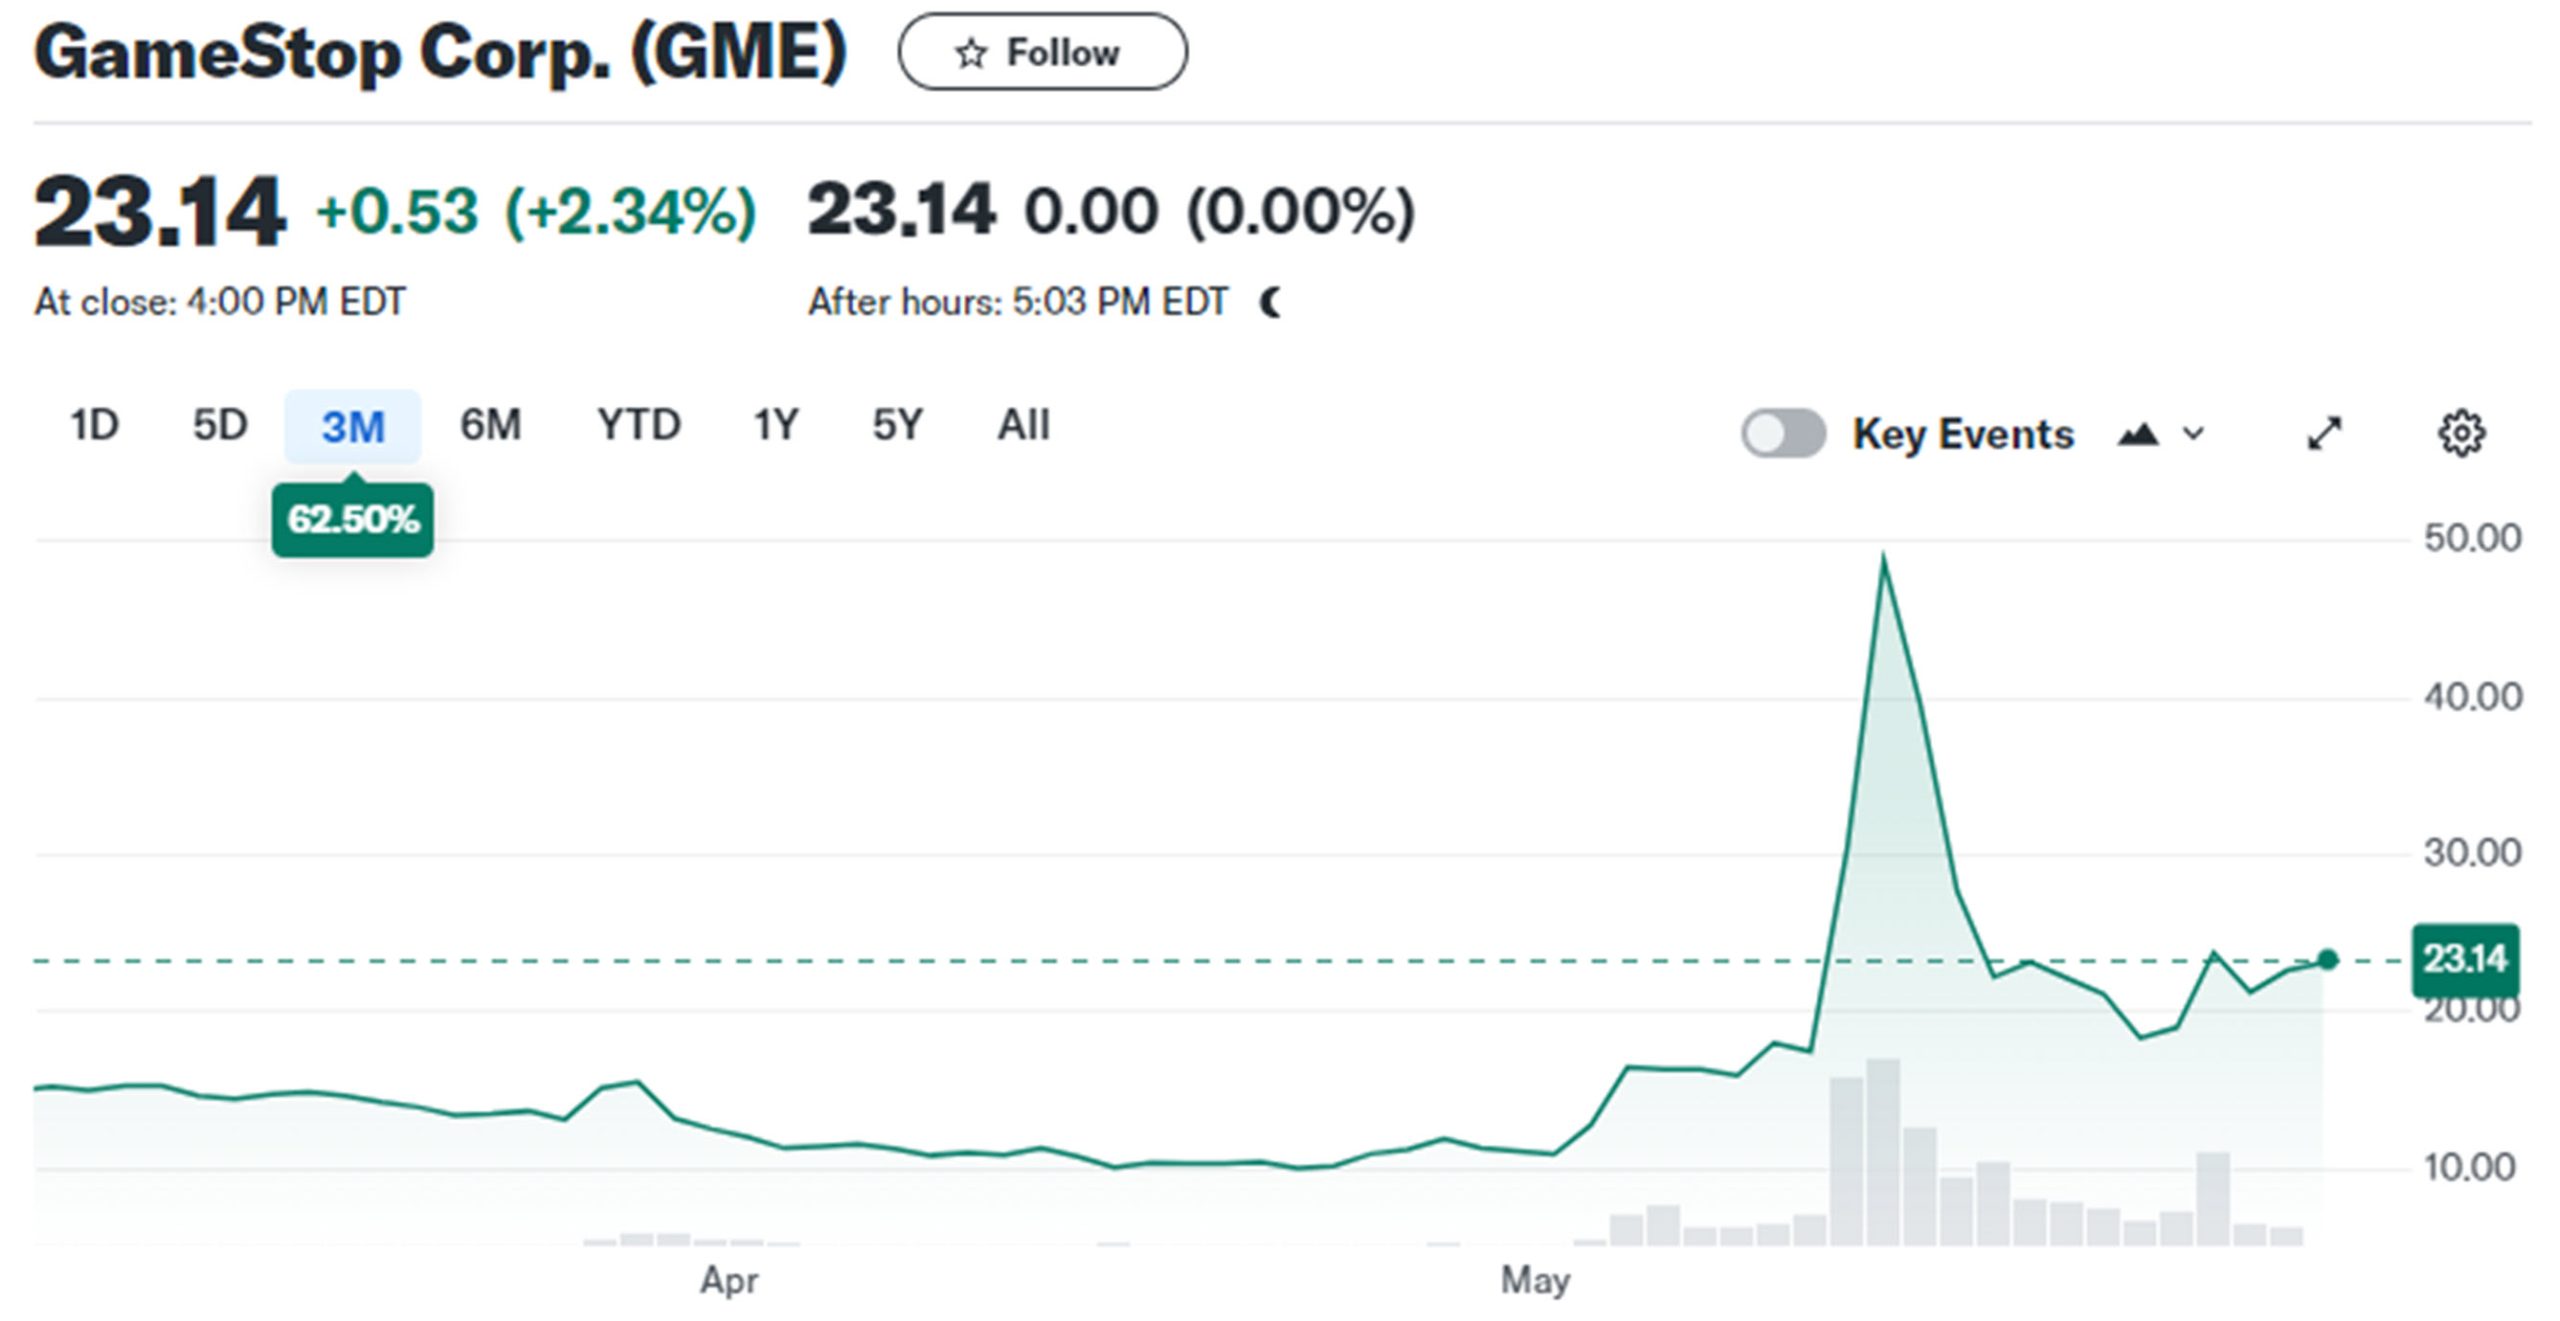
Figure 5. GME prices, last 3 months. Source: Yahoo finance.
You can see from the charts that the rallies in AMC were from $3 to $7 (up 130%) and GME from about $18 to $49 (up 172%). Not too bad if you get in before the 1-day rally. However, that seems unlikely. Even a mean-reversion trader would need to sell on the first day up to benefit.
Figure 6 shows Blackberry prices. While prices show a rally starting on May 10 at about $3.00 and running to over $4.00 (that’s a gain of 33%) and back to $3.18. Prices peaked on May 14 with volume of 94 million but has dropped to 4.9 million.
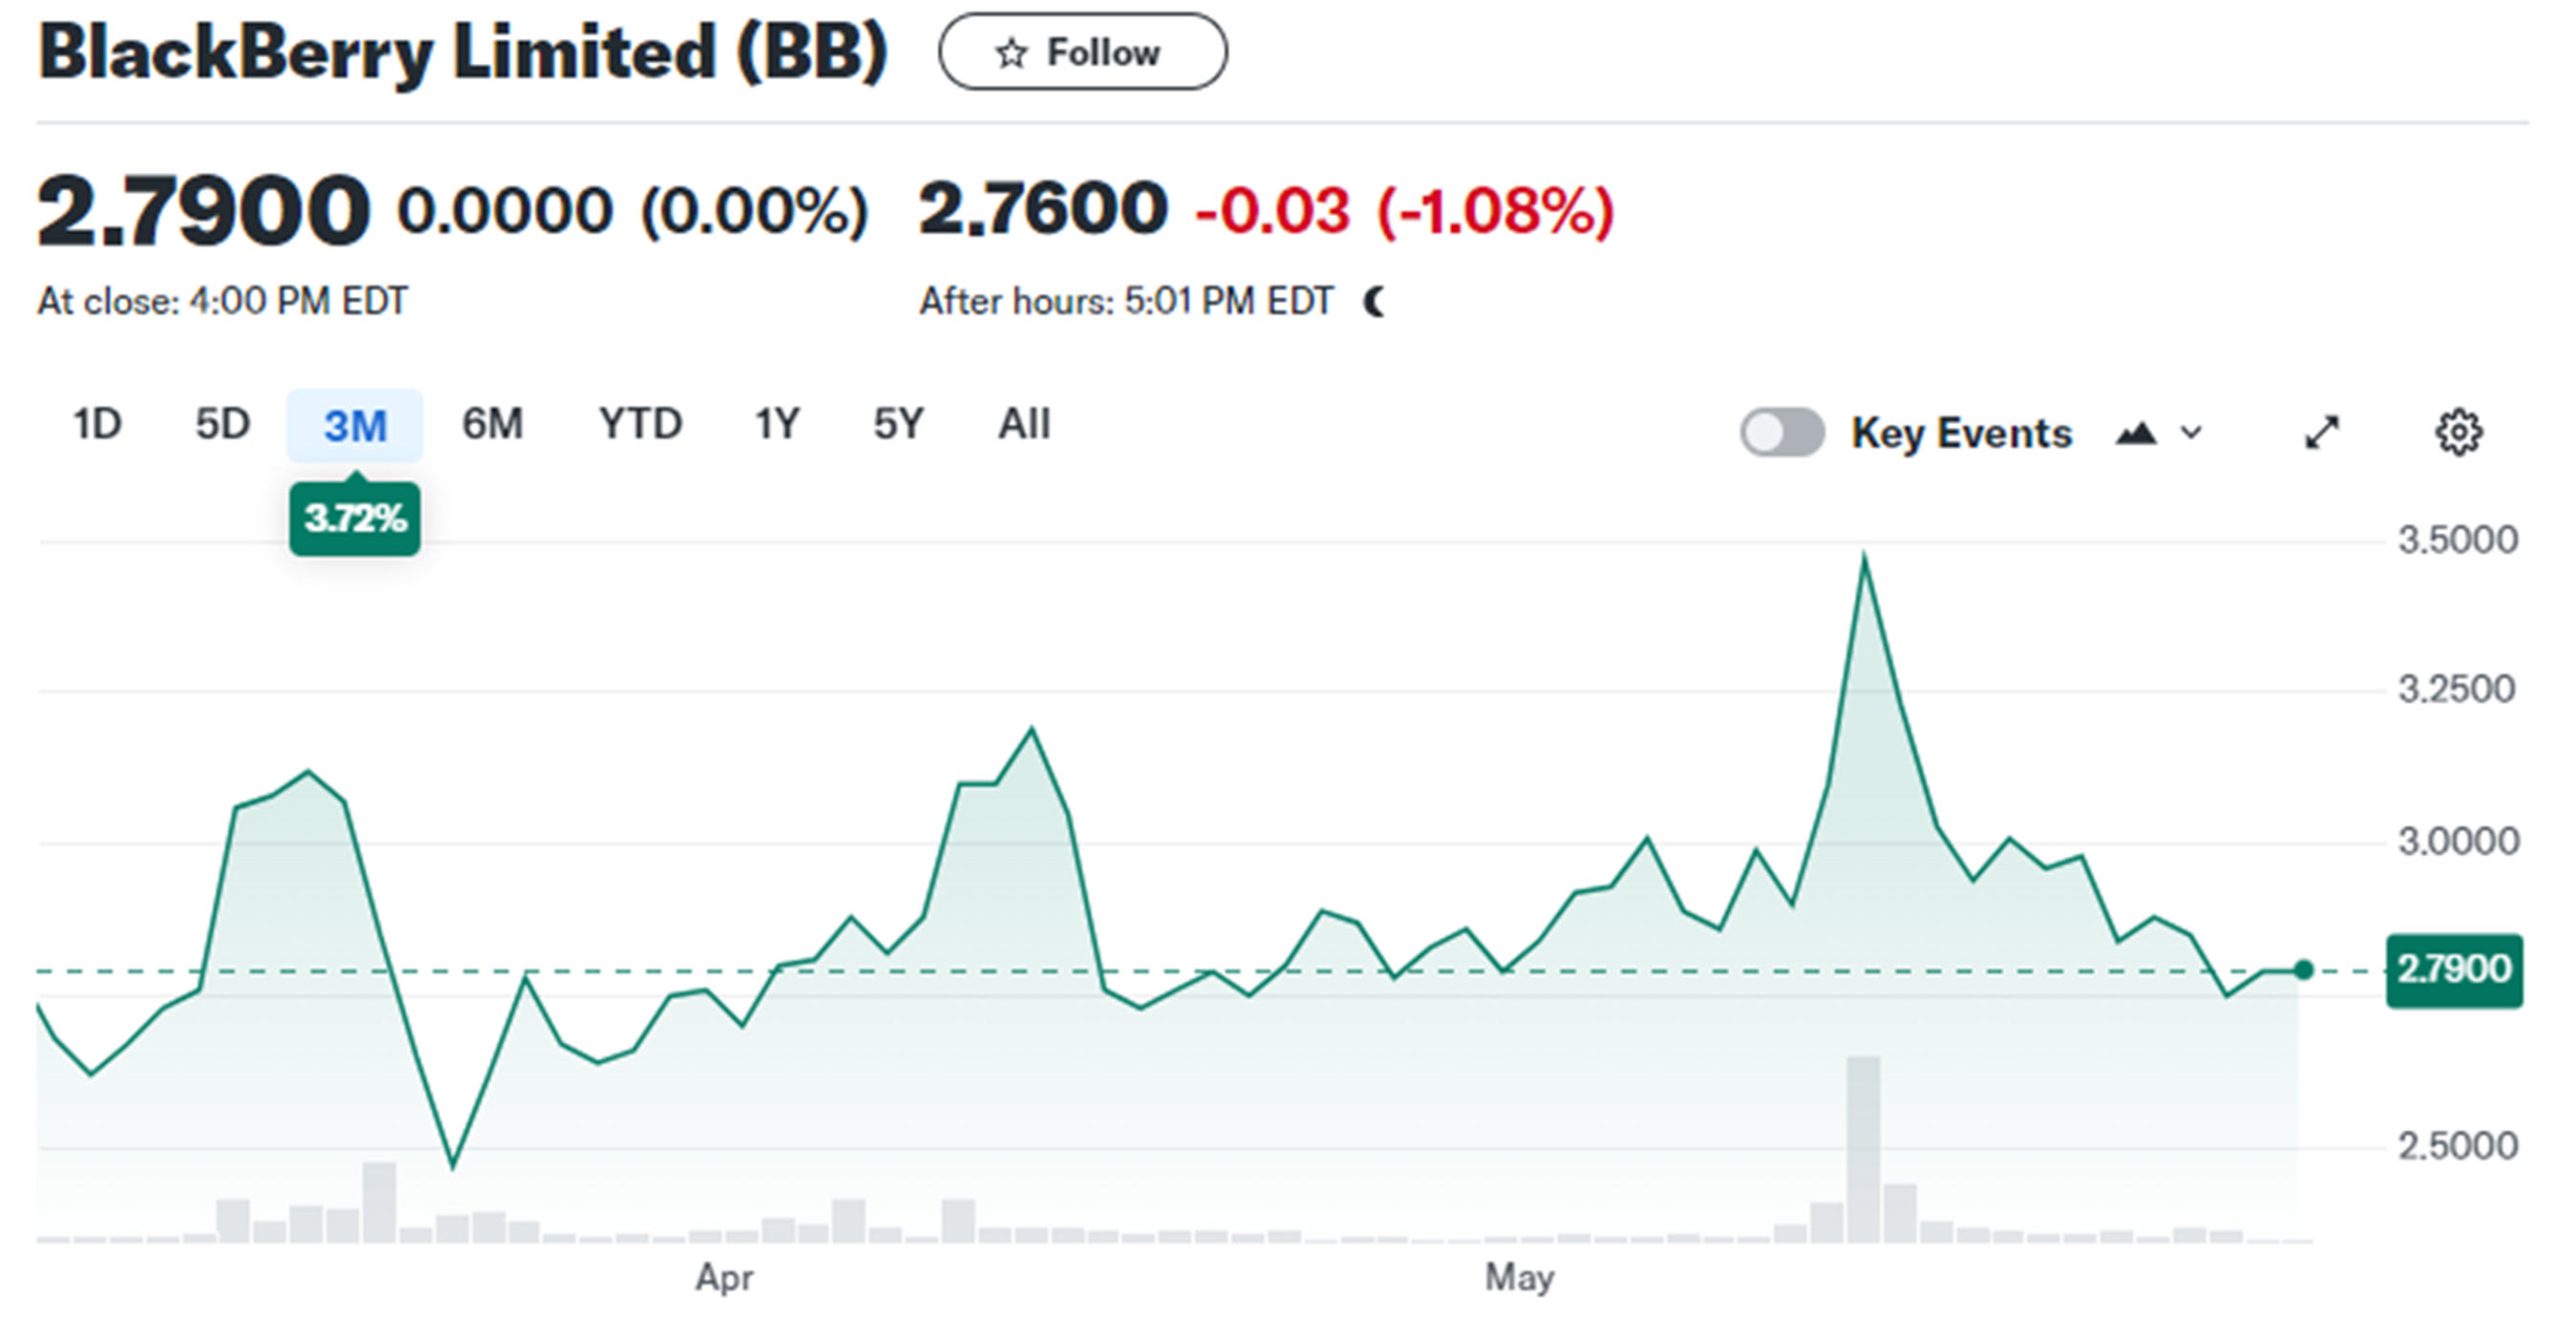
Figure 6. Blackberry (BB) price, last 3 months. Source Yahoo finance.
Not to forget Robinhood, we can see a small rally on the far right of Figure 3. Not quite the same as in 2021. It’s also difficult to see the May rally in AMC and GME in the 5-year charts (Figures 1 and 2).
What Are Our Choices?
I hope that I’ve made the argument that the recent MEME trades are unimpressive as well as difficult to trade – unless you act quickly and sell the rally. But what choices do we have? Let’s look at some of our favorite stocks, Figures 7, 8, and 9.
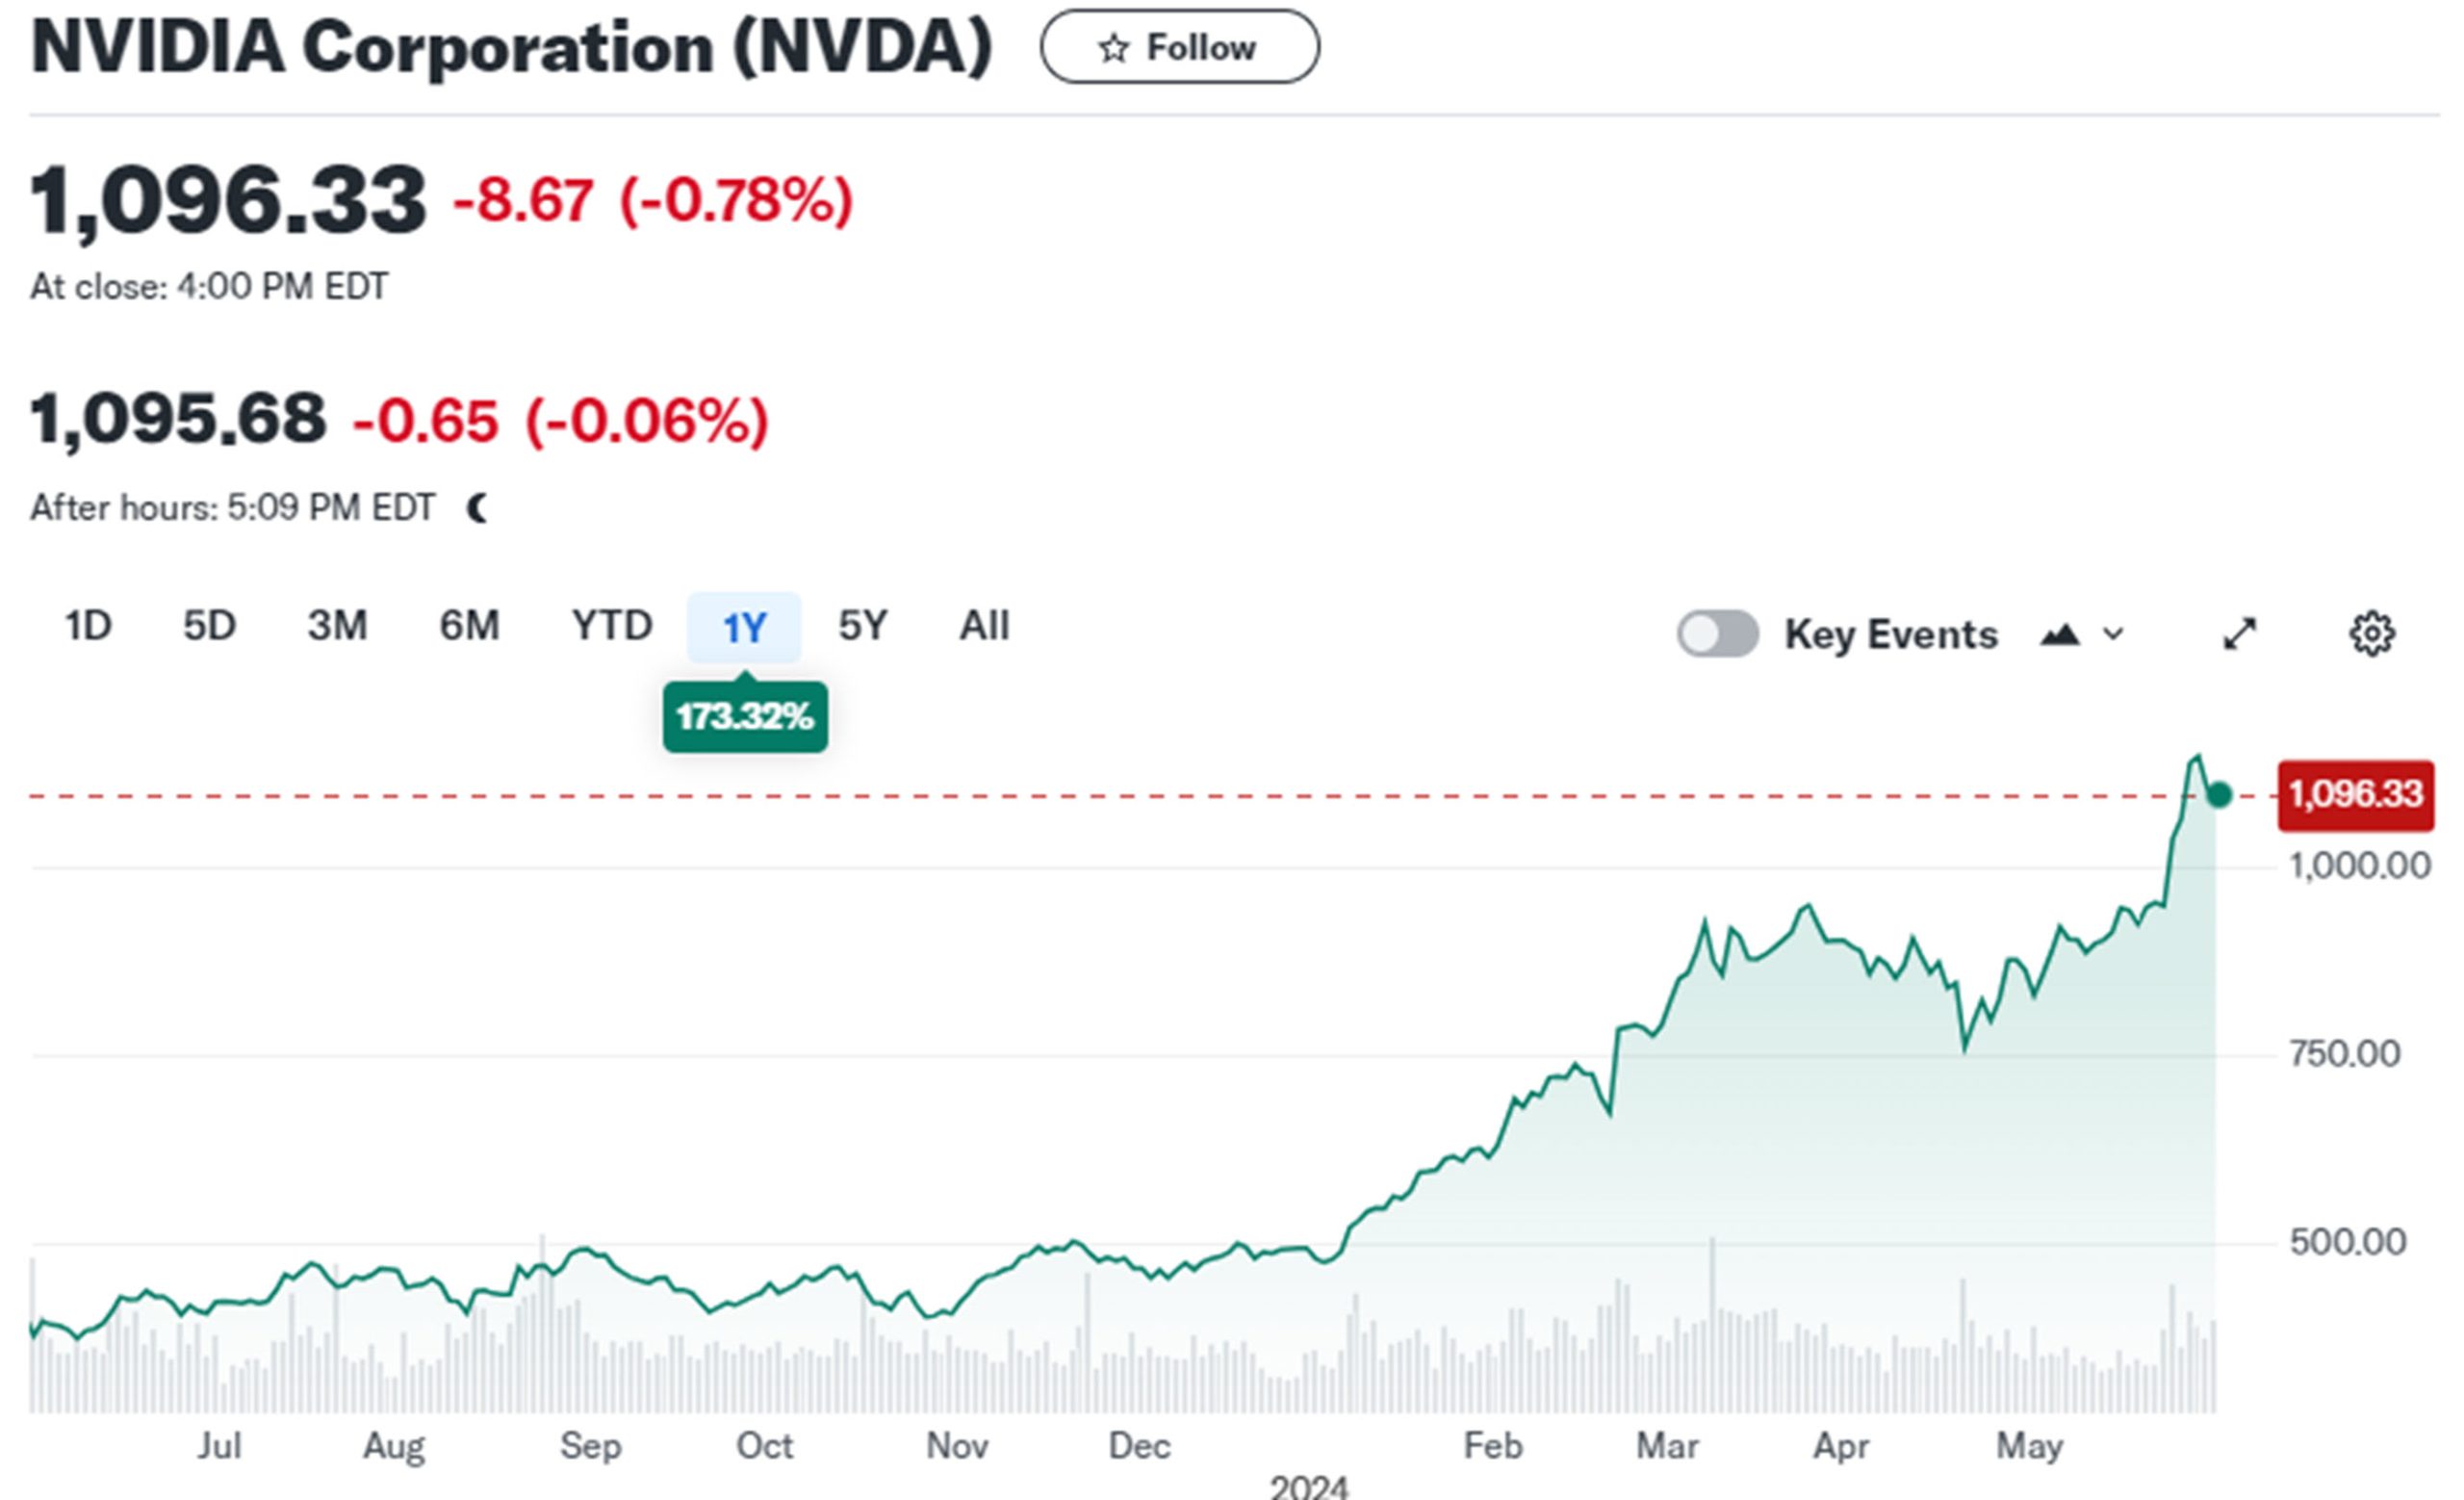
Figure 7. Nvidia (NVDA), the current leading in AI semiconductors. Source: Yahoo finance.
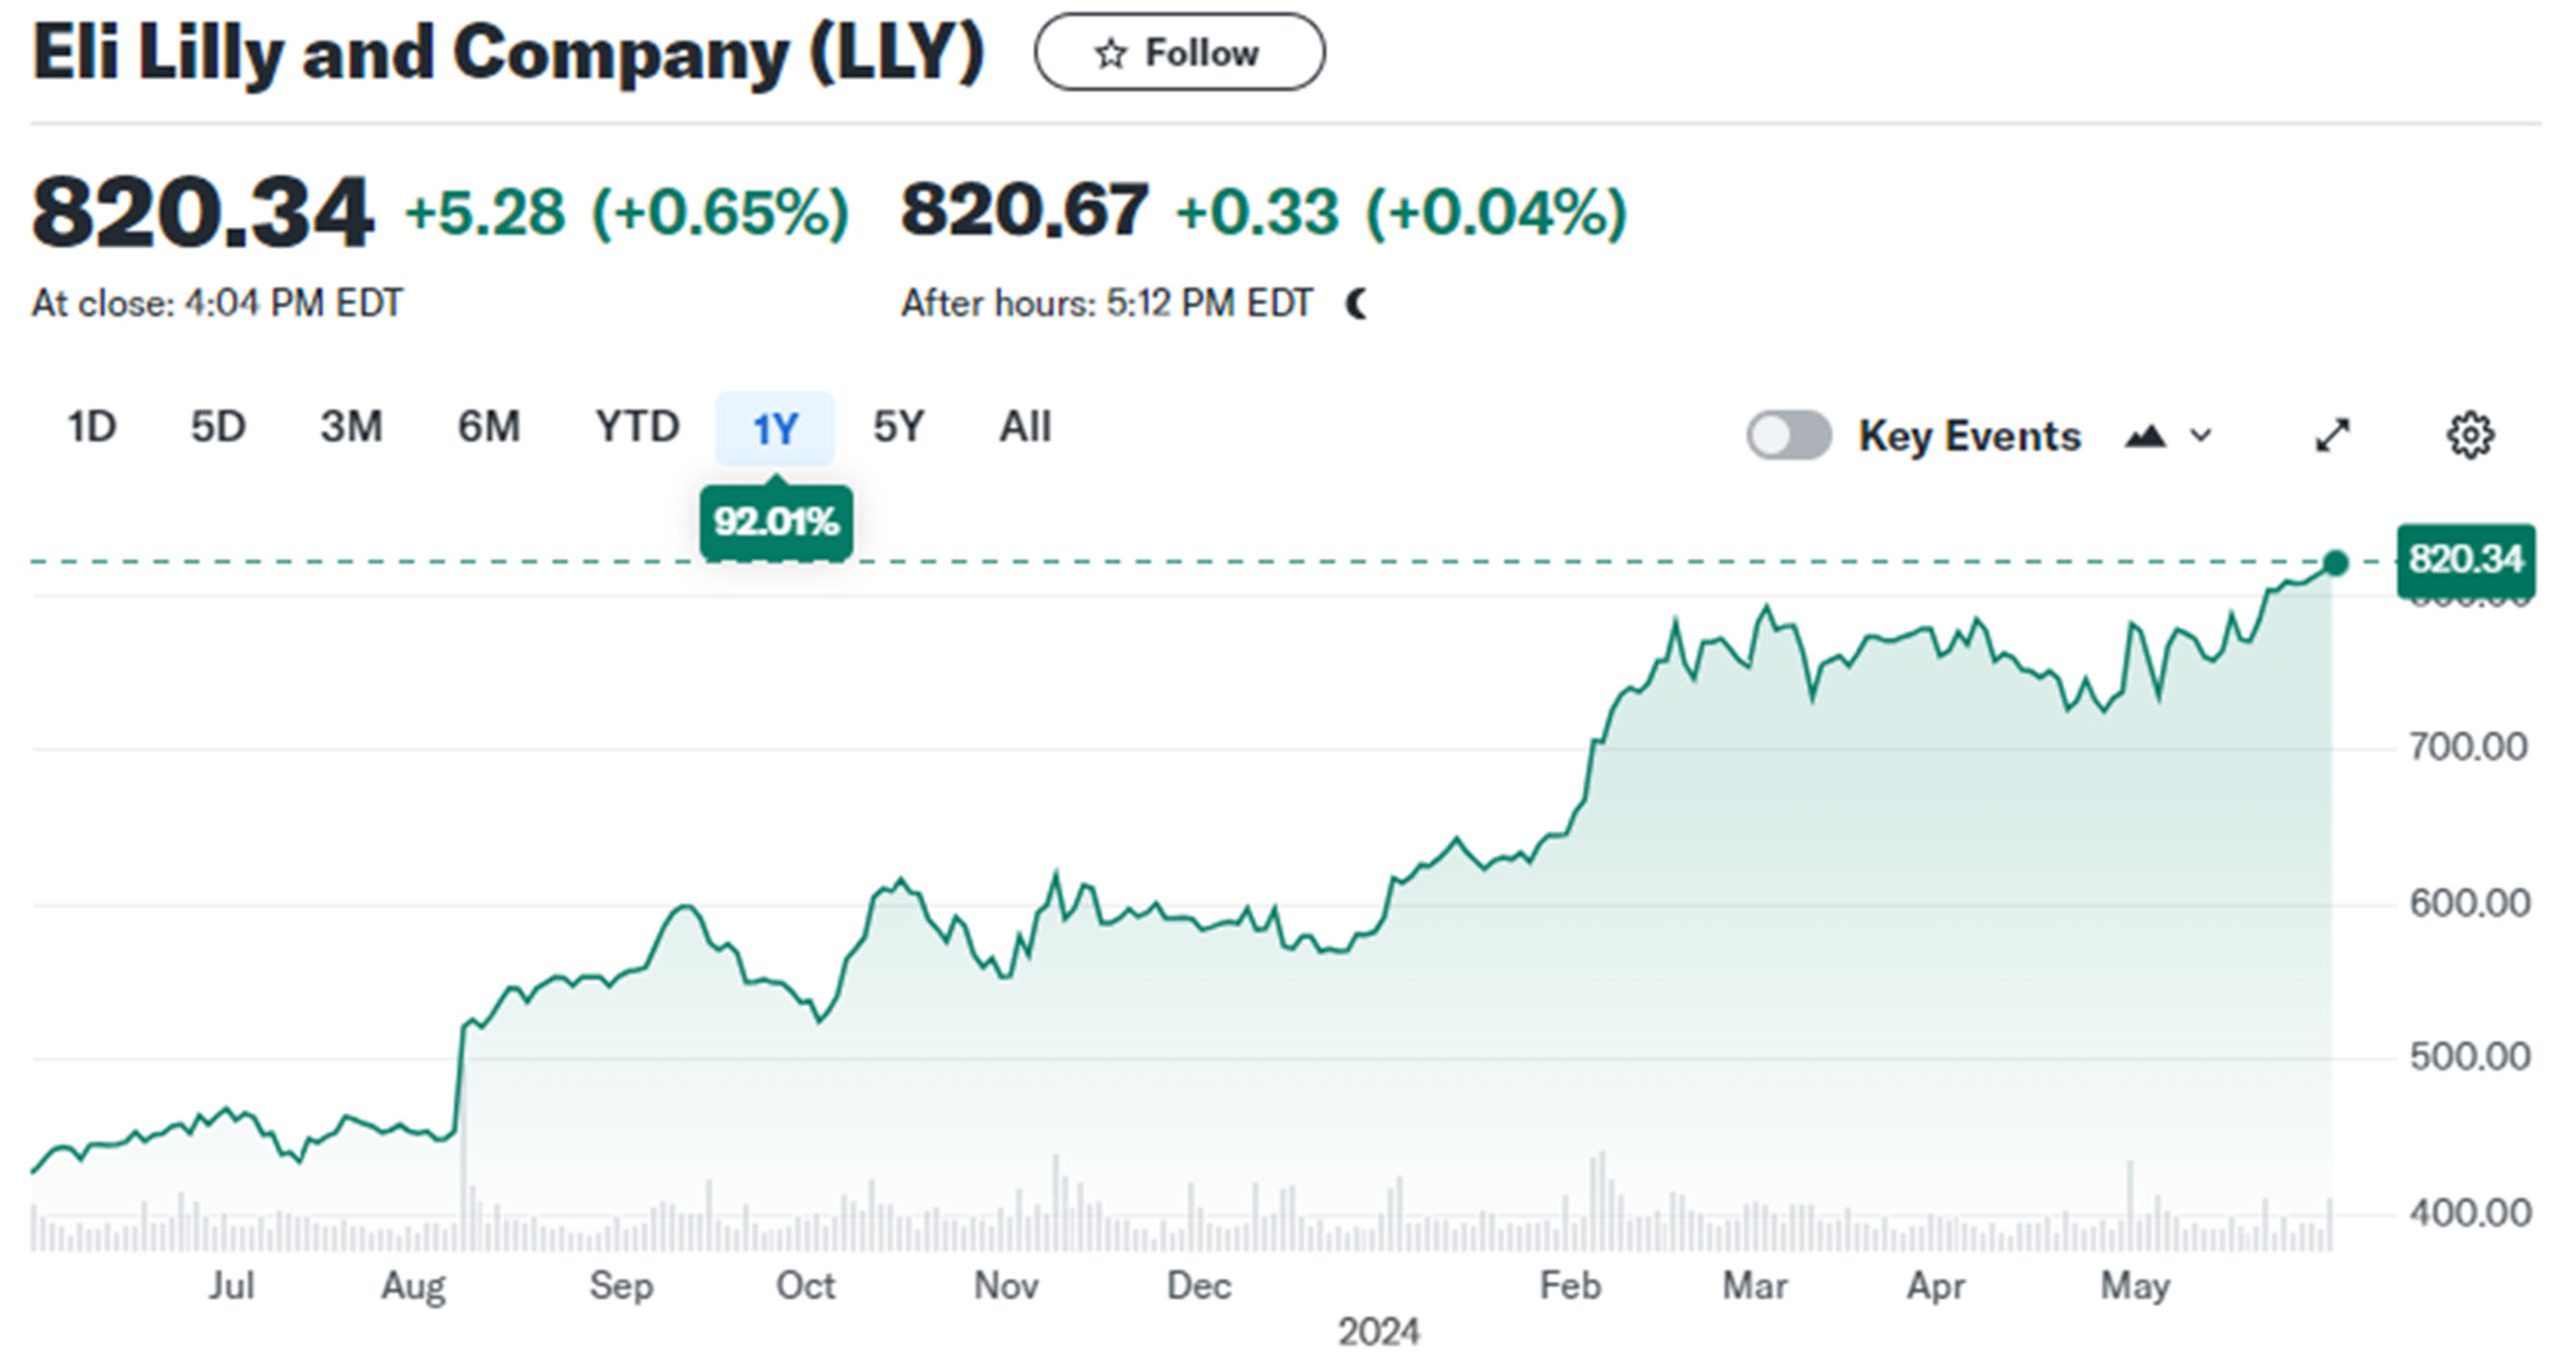
Figure 8. Eli Lilly (LLY), a leading pharmaceutical company. Source: Yahoo finance.
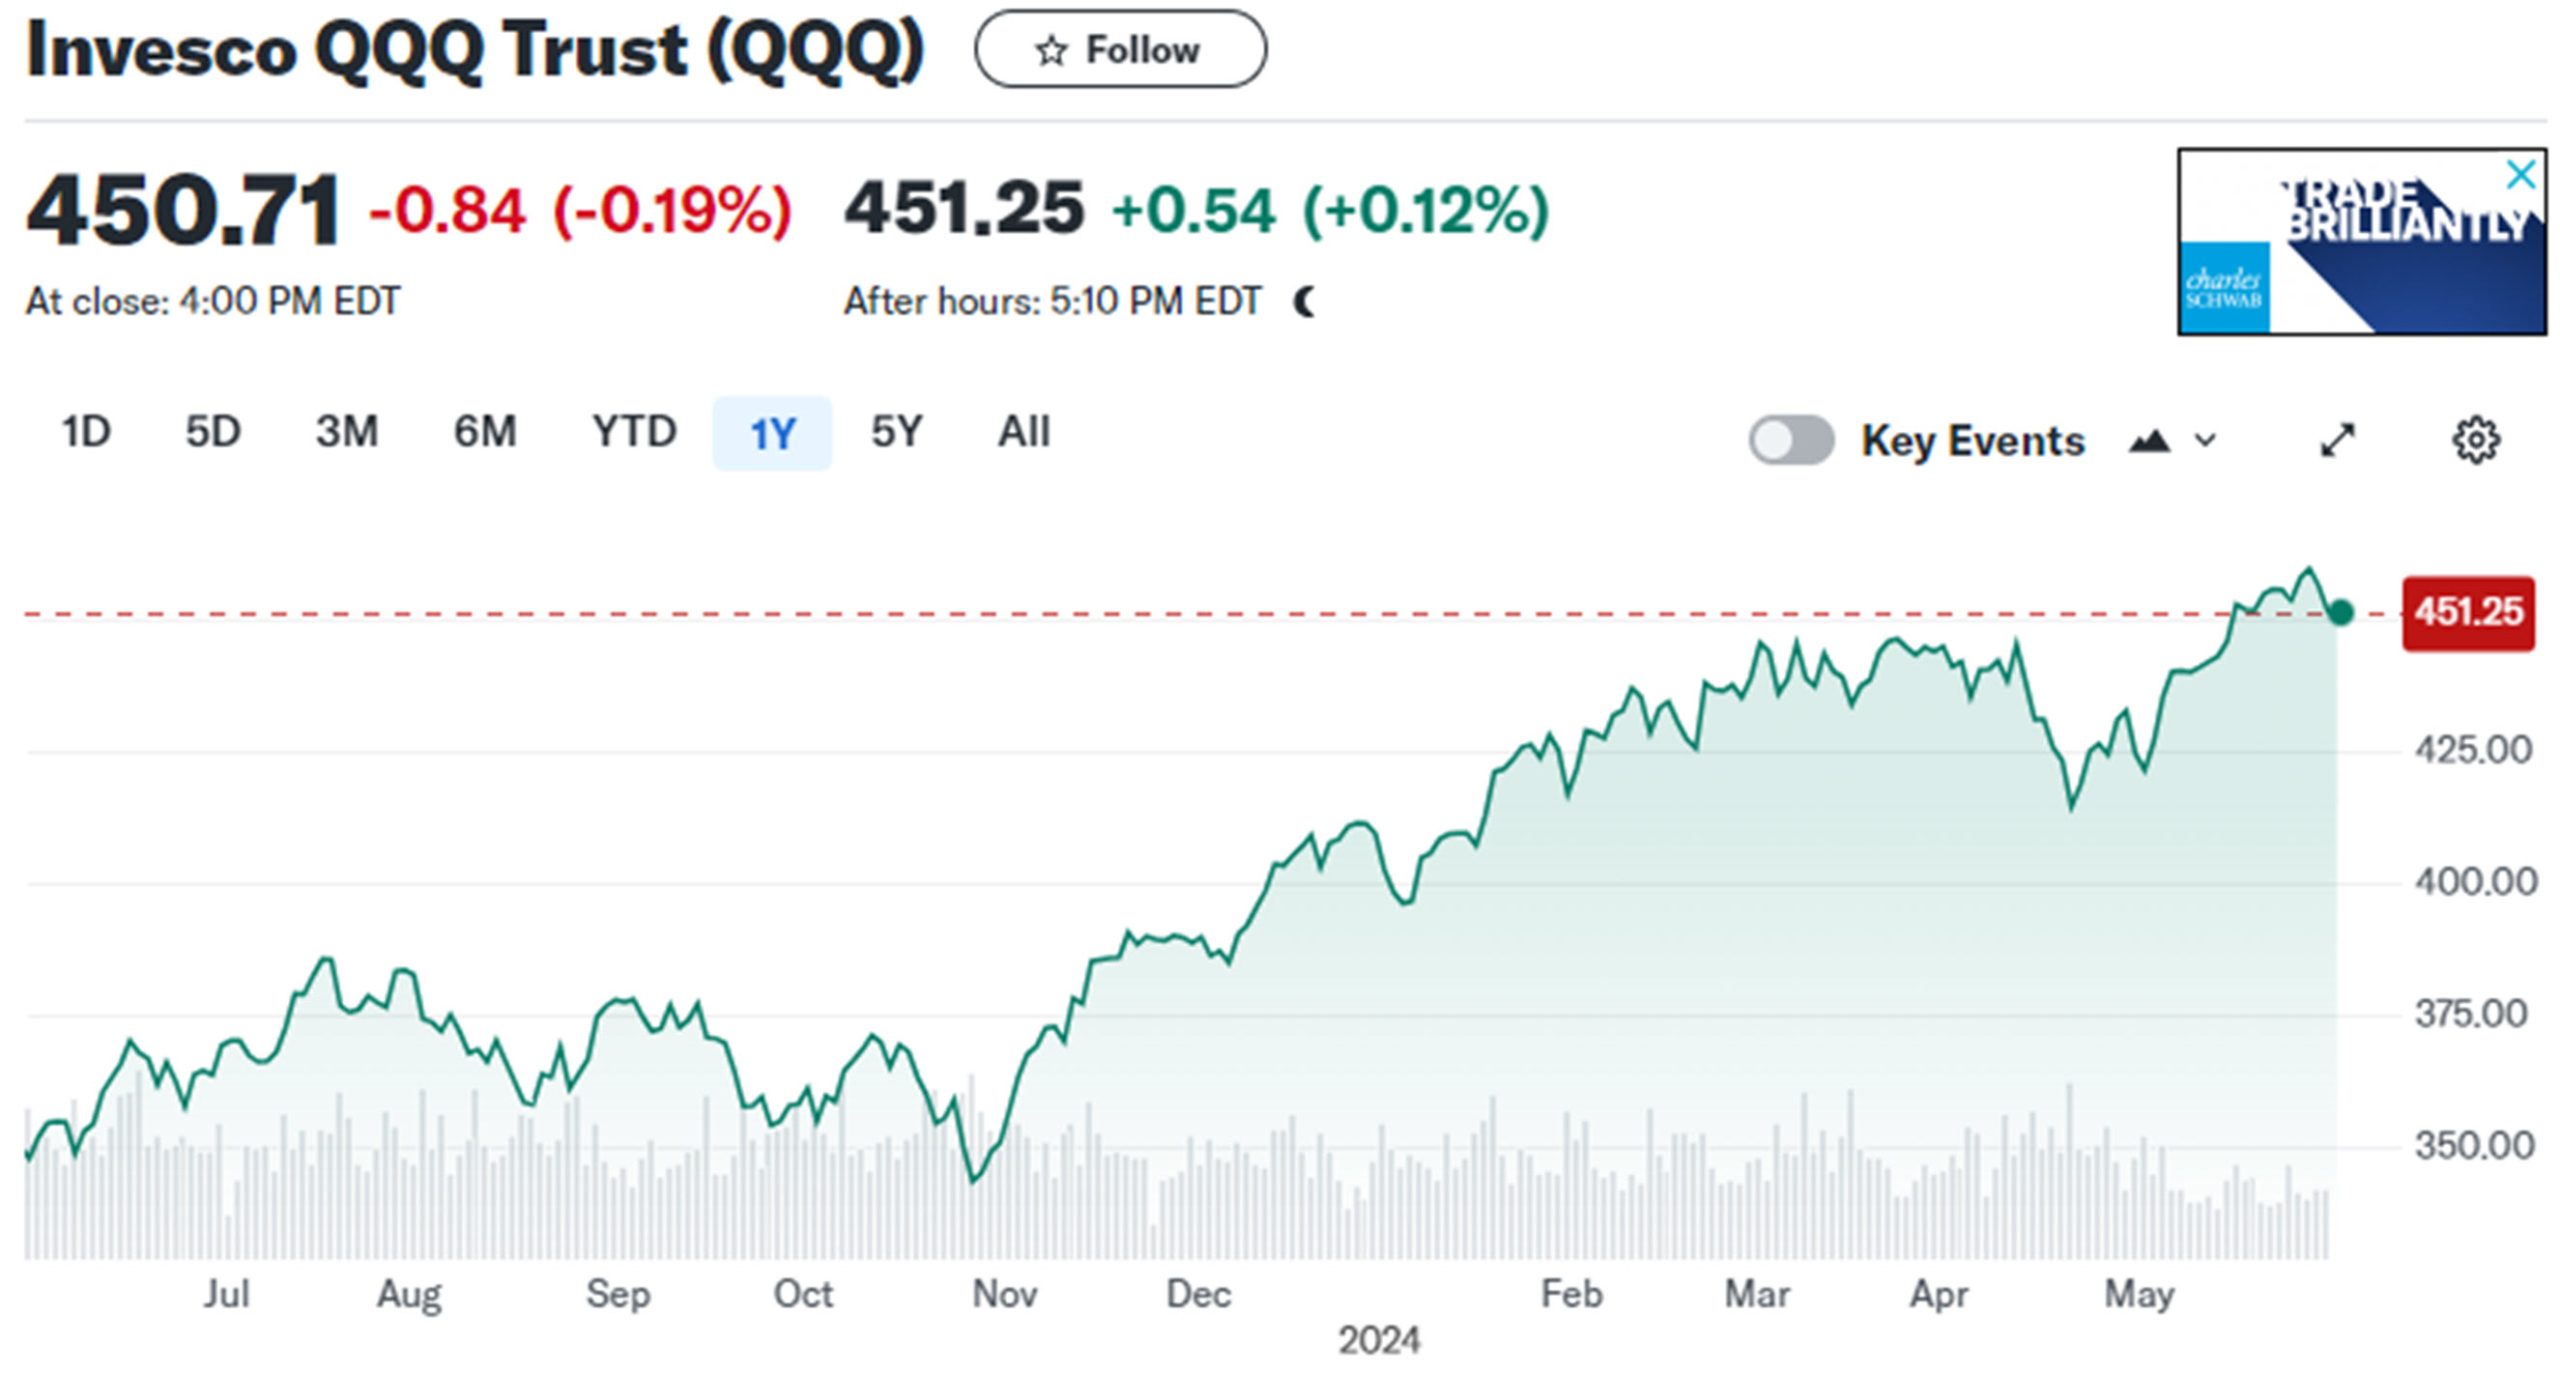
Figure 9. The NASDAQ Trust ETF QQQ. Source: Yahoo finance.
These two stocks and one ETF do not go straight up, but have a clear trend. They are based on good corporate performance and the U.S. economy. You won’t retire on a 1-day trade, but your equity will grow over time.
Passive Verses Managed
As you know, I’m an advocate of algorithmic systems and algorithmic portfolio management. I feel it is necessary to be able to exit a stock, or futures market, that no longer behaves correctly. In that way, we hope to minimize drawdowns and move to markets with greater potential. So far, so good.
On the other hand, buying stocks that have sold off may appear to be a sound strategy, but have two flaws: Selling off can be the result of lower sales caused by more competition or poor management. Take Peloton. It rallied in 2021 due to stay-at-home Covid 19 concerns. But high prices and the ending of Covid restrictions were not offset by a new sales approach (see Figure 10).
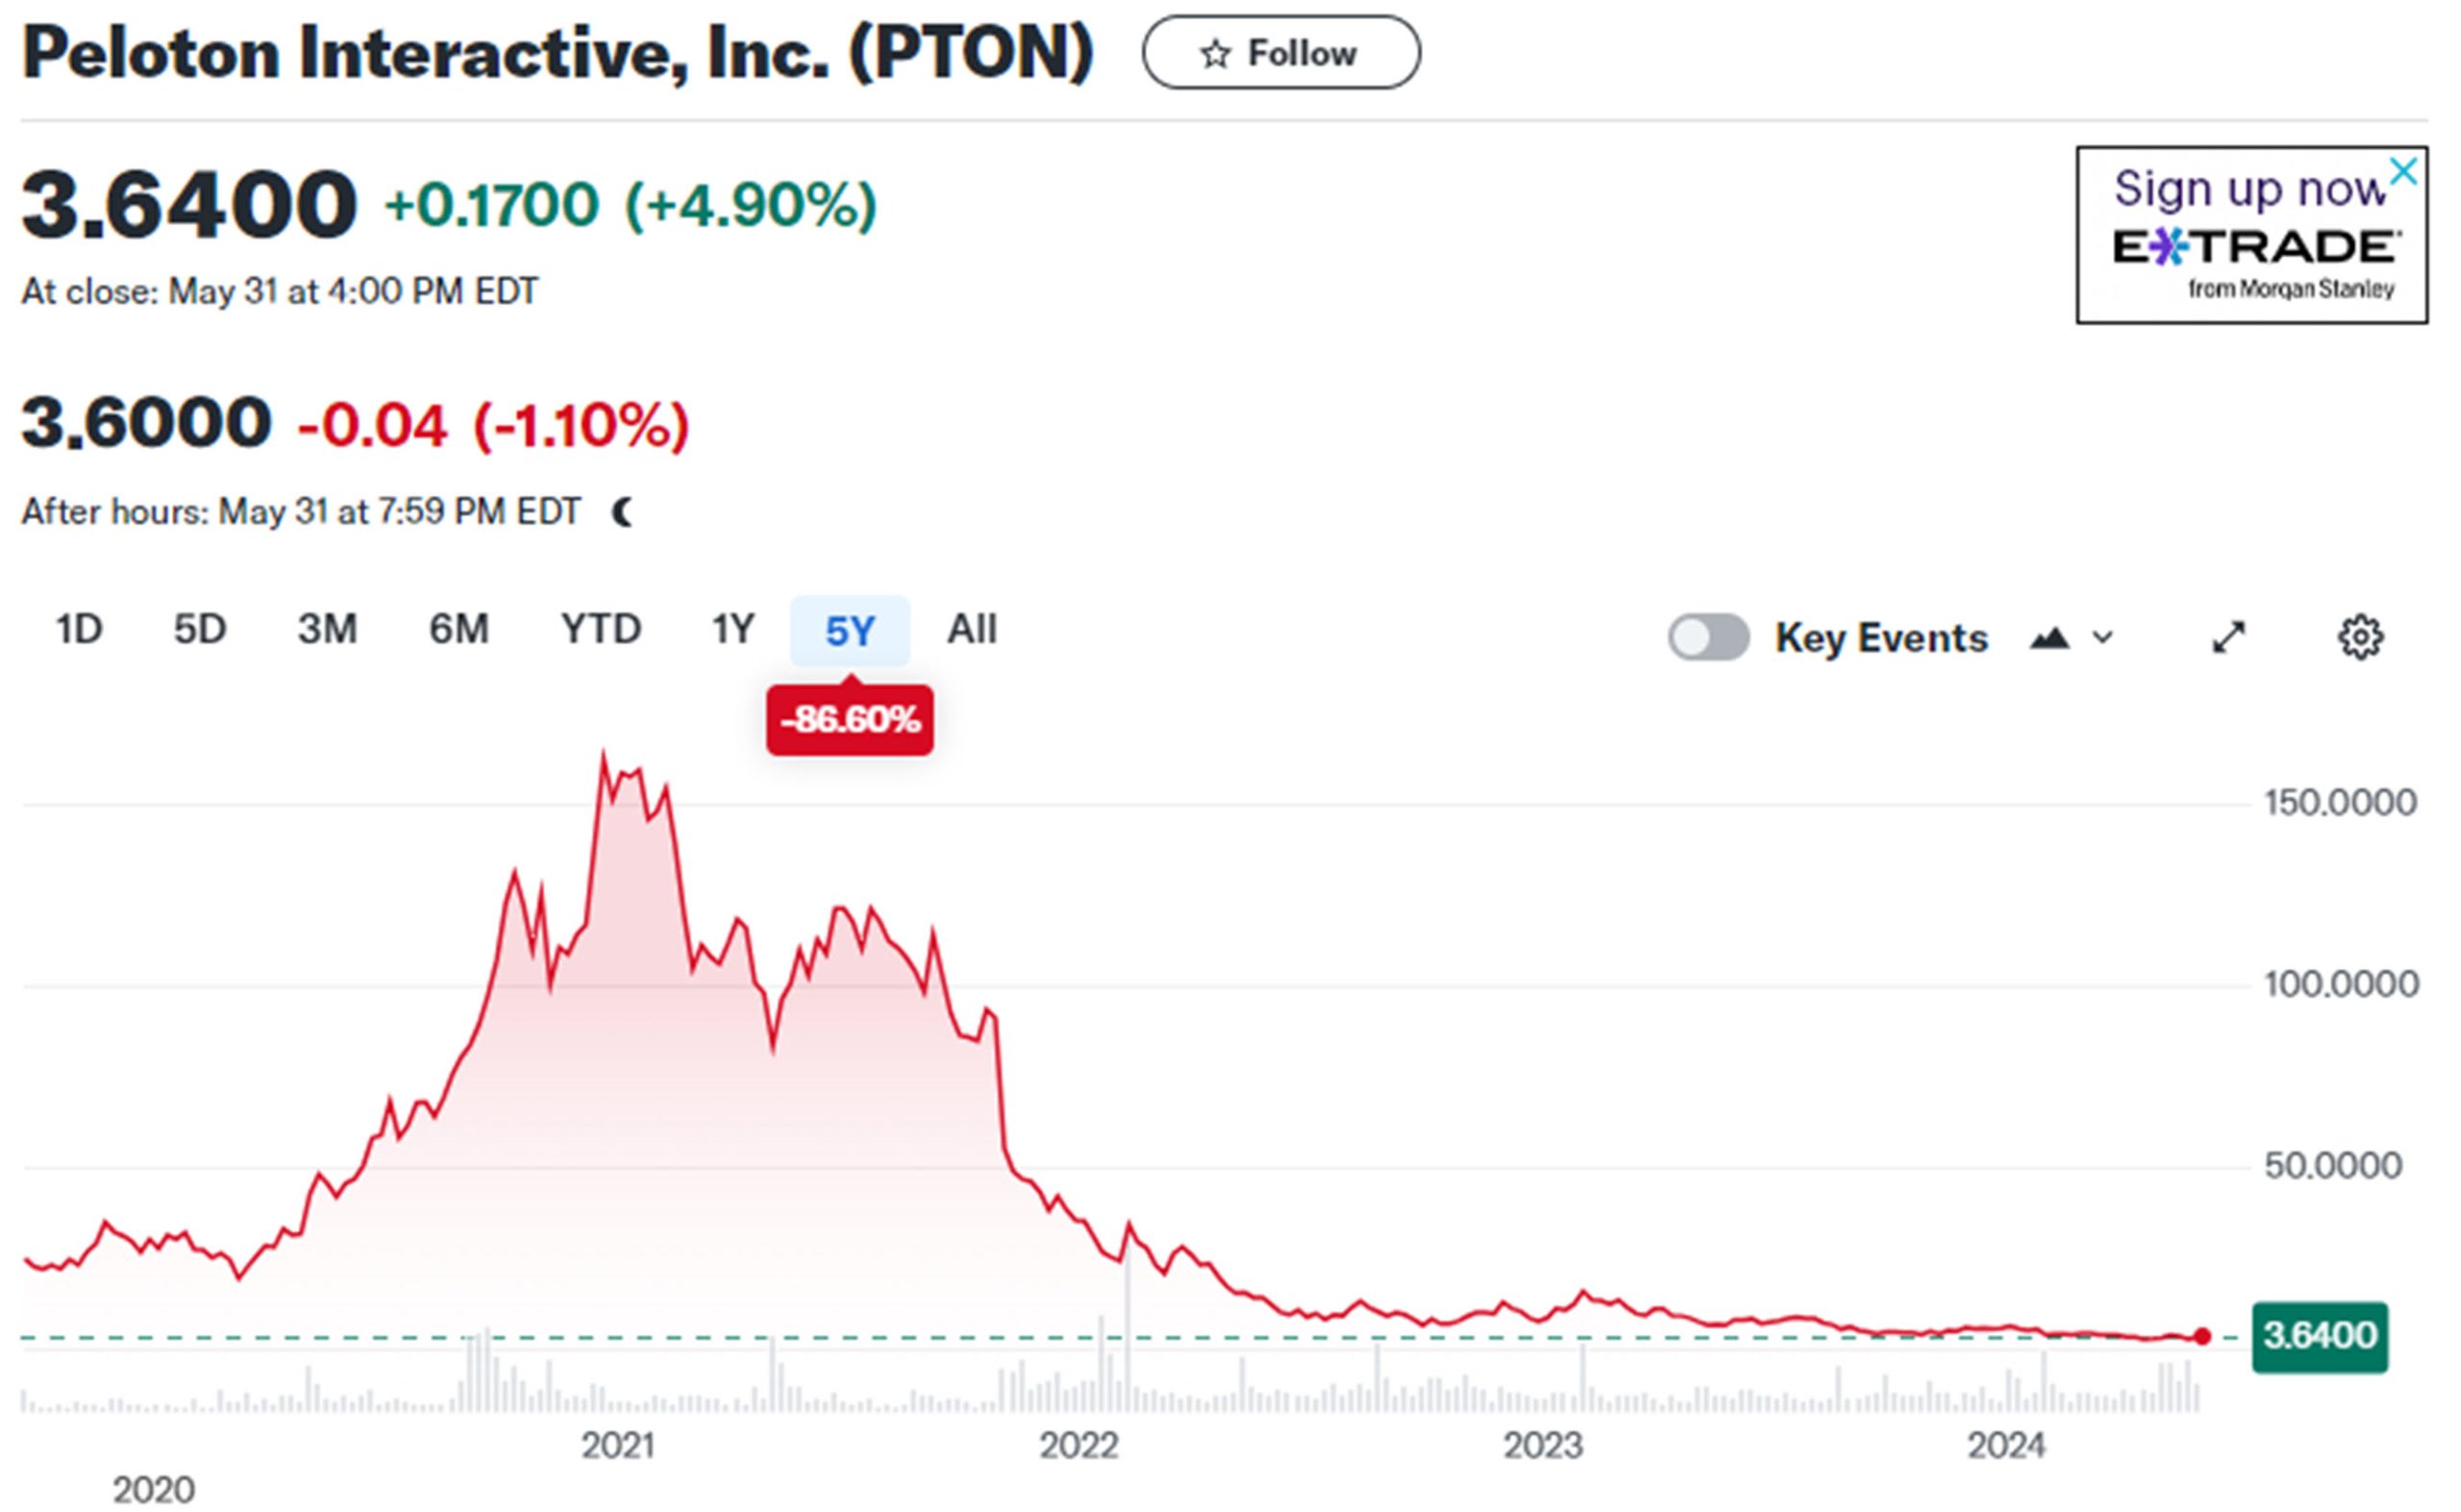
Figure 10. Peloton (PTON) peaked in 2021 and has declined since. Source: Yahoo finance.
Cathy Woods seems to be the poster child for changing positions often. I can’t say that she is either discretionary, value, or algorithmic, but we see news of her buying stocks that have deeply sold off. She first captured the attention of investors with the idea of “innovation.” However, her execution has been a problem, as seen in Figure 11. Many traders, including myself, prefer to buy when stocks are rising. Sometimes the stocks keep rising, as in Apple, Amazon, Telsa, and Nvidia.
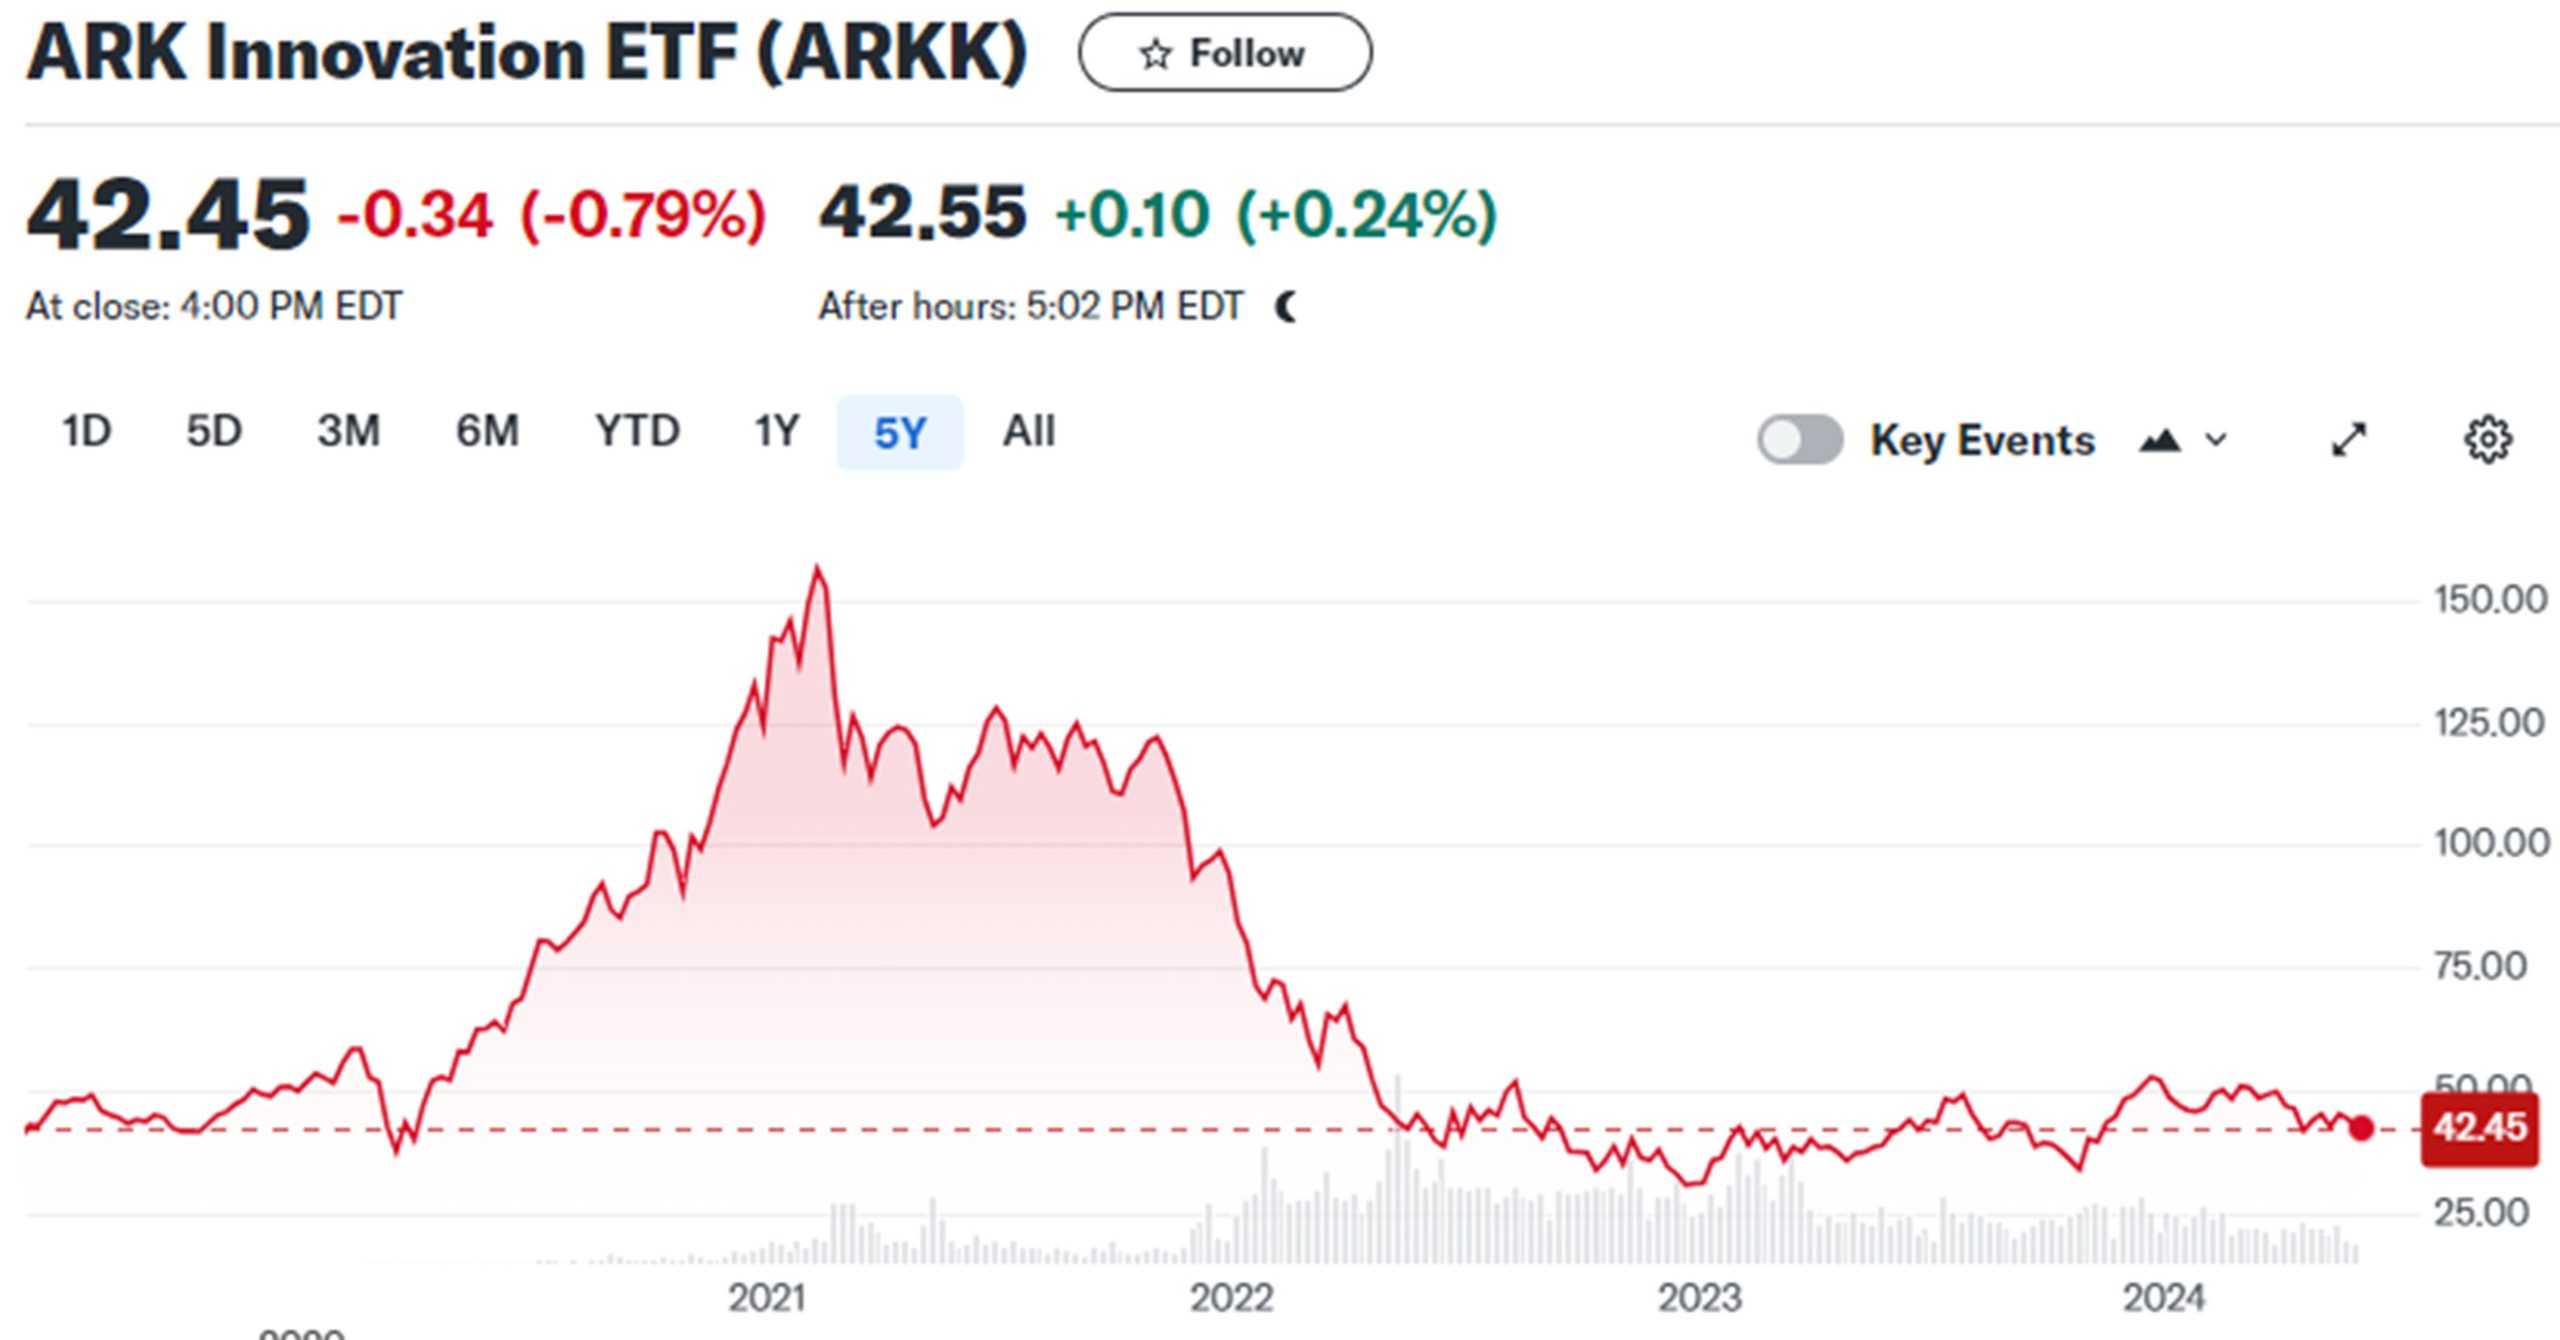
Figure 11. ARKK prices from 2021. Source: Yahoo finance.
Not Much to Decide
I’ve tried to argue that MEME trading is a fad, and that fad has died. I’m sure there will be others to come, but personally, I will avoid them. Someone gets rich, but it’s not the traders. This month’s MEME rally is just another example of market manipulation.
And there is BITCOIN, now under $70,000. If your goal is to buy now and wait for $100,000, that’s a 42% gain. You can do better with a many other stocks with good earnings and management, and with less risk.
There are plenty of good stock investments. I’ve shown NVDA, LLY, and even QQQ. They don’t go up all the time, and they may even have a 20% drawdown, but some systematic approach, even a simple moving average, can reduce the risk. And diversification helps.
No one is telling you when and what to buy, except the brokerage houses. You can make your own decisions. But don’t plan to make 1,000% on a trade. Buying a stock at $20 and having it go to $30, is a 50% return. Better than BITCOIN. Supermicro is up 175%, Vistra is up 134%, Nvidia up 82%, and Constellation Energy up by the same 82%. There are a lot of choices.
I have found that stocks doing well continue to do well for longer than we expect. It’s called persistence.
A Standing Note on Short Sales
Note that the “All Signals” reports show short sales in stocks and ETFs, even though short positions are not executed in the equity portfolios. Our work over the years shows that downturns in the stock market are most often short-lived and it is difficult to capture with a longer-term trend. The upwards bias also works against shorter-term systems unless using futures, which allows leverage. Our decision has been to take only long positions in equities and control the risk by exiting many of the portfolios when there is extreme volatility and/or an indication of a severe downturn.
PORTFOLIO METHODOLOGY IN BRIEF
Both equity and futures programs use the same basic portfolio technology. They all exploit the persistence of performance, that is, they seek those markets with good long-term and short-term returns on the specific system, rank them, then choose the best, subject to liquidity, an existing current signal, with limitations on how many can be chosen from each sector. If there are not enough stocks or futures markets that satisfy all the conditions, then the portfolio holds fewer assets. In general, these portfolios are high beta, showing higher returns and higher risk, but have had a history of consistently outperforming the broad market index in all traditional measures.
PERFORMANCE BY GROUP
NOTE that the charts show below represent performance “tracking,” that is, the oldest results since are simulated but the returns from 2013 are the systematic daily performance added day by day. Any changes to the strategies do not affect the past performance, unless noted. The system assumes 100% investment and stocks are executed on the open, futures on the close of the trading day following the signals. From time to time we make logic changes to the strategies and show how the new model performs.
Groups DE1 and WE1: Daily and Weekly Trend Program for Stocks, including Income Focus, DowHedge, Sector Rotation, and the New High-Risk Portfolio
The Trend program seeks long-term directional changes in markets and the portfolios choose stocks that have realized profitable performance over many years combined with good short-term returns. It will hold fewer stocks when they do not meet our condition and exit the entire portfolio when there is extreme risk or a significant downturn.
Gaining back what was lost in April, the Daily portfolio is higher by 13% to 16% for the year, in what can only be called flip-flopping. Patterns in the Weekly programs are similar but lagging the Daily a bit. That has a way of changing from month to month.

Income Focus and Sector Rotation
Not much happening in this strategy as long as the Fed doesn’t show a change in policy. Both Daily and Weekly programs lost fractionally and remain slightly down for the month.

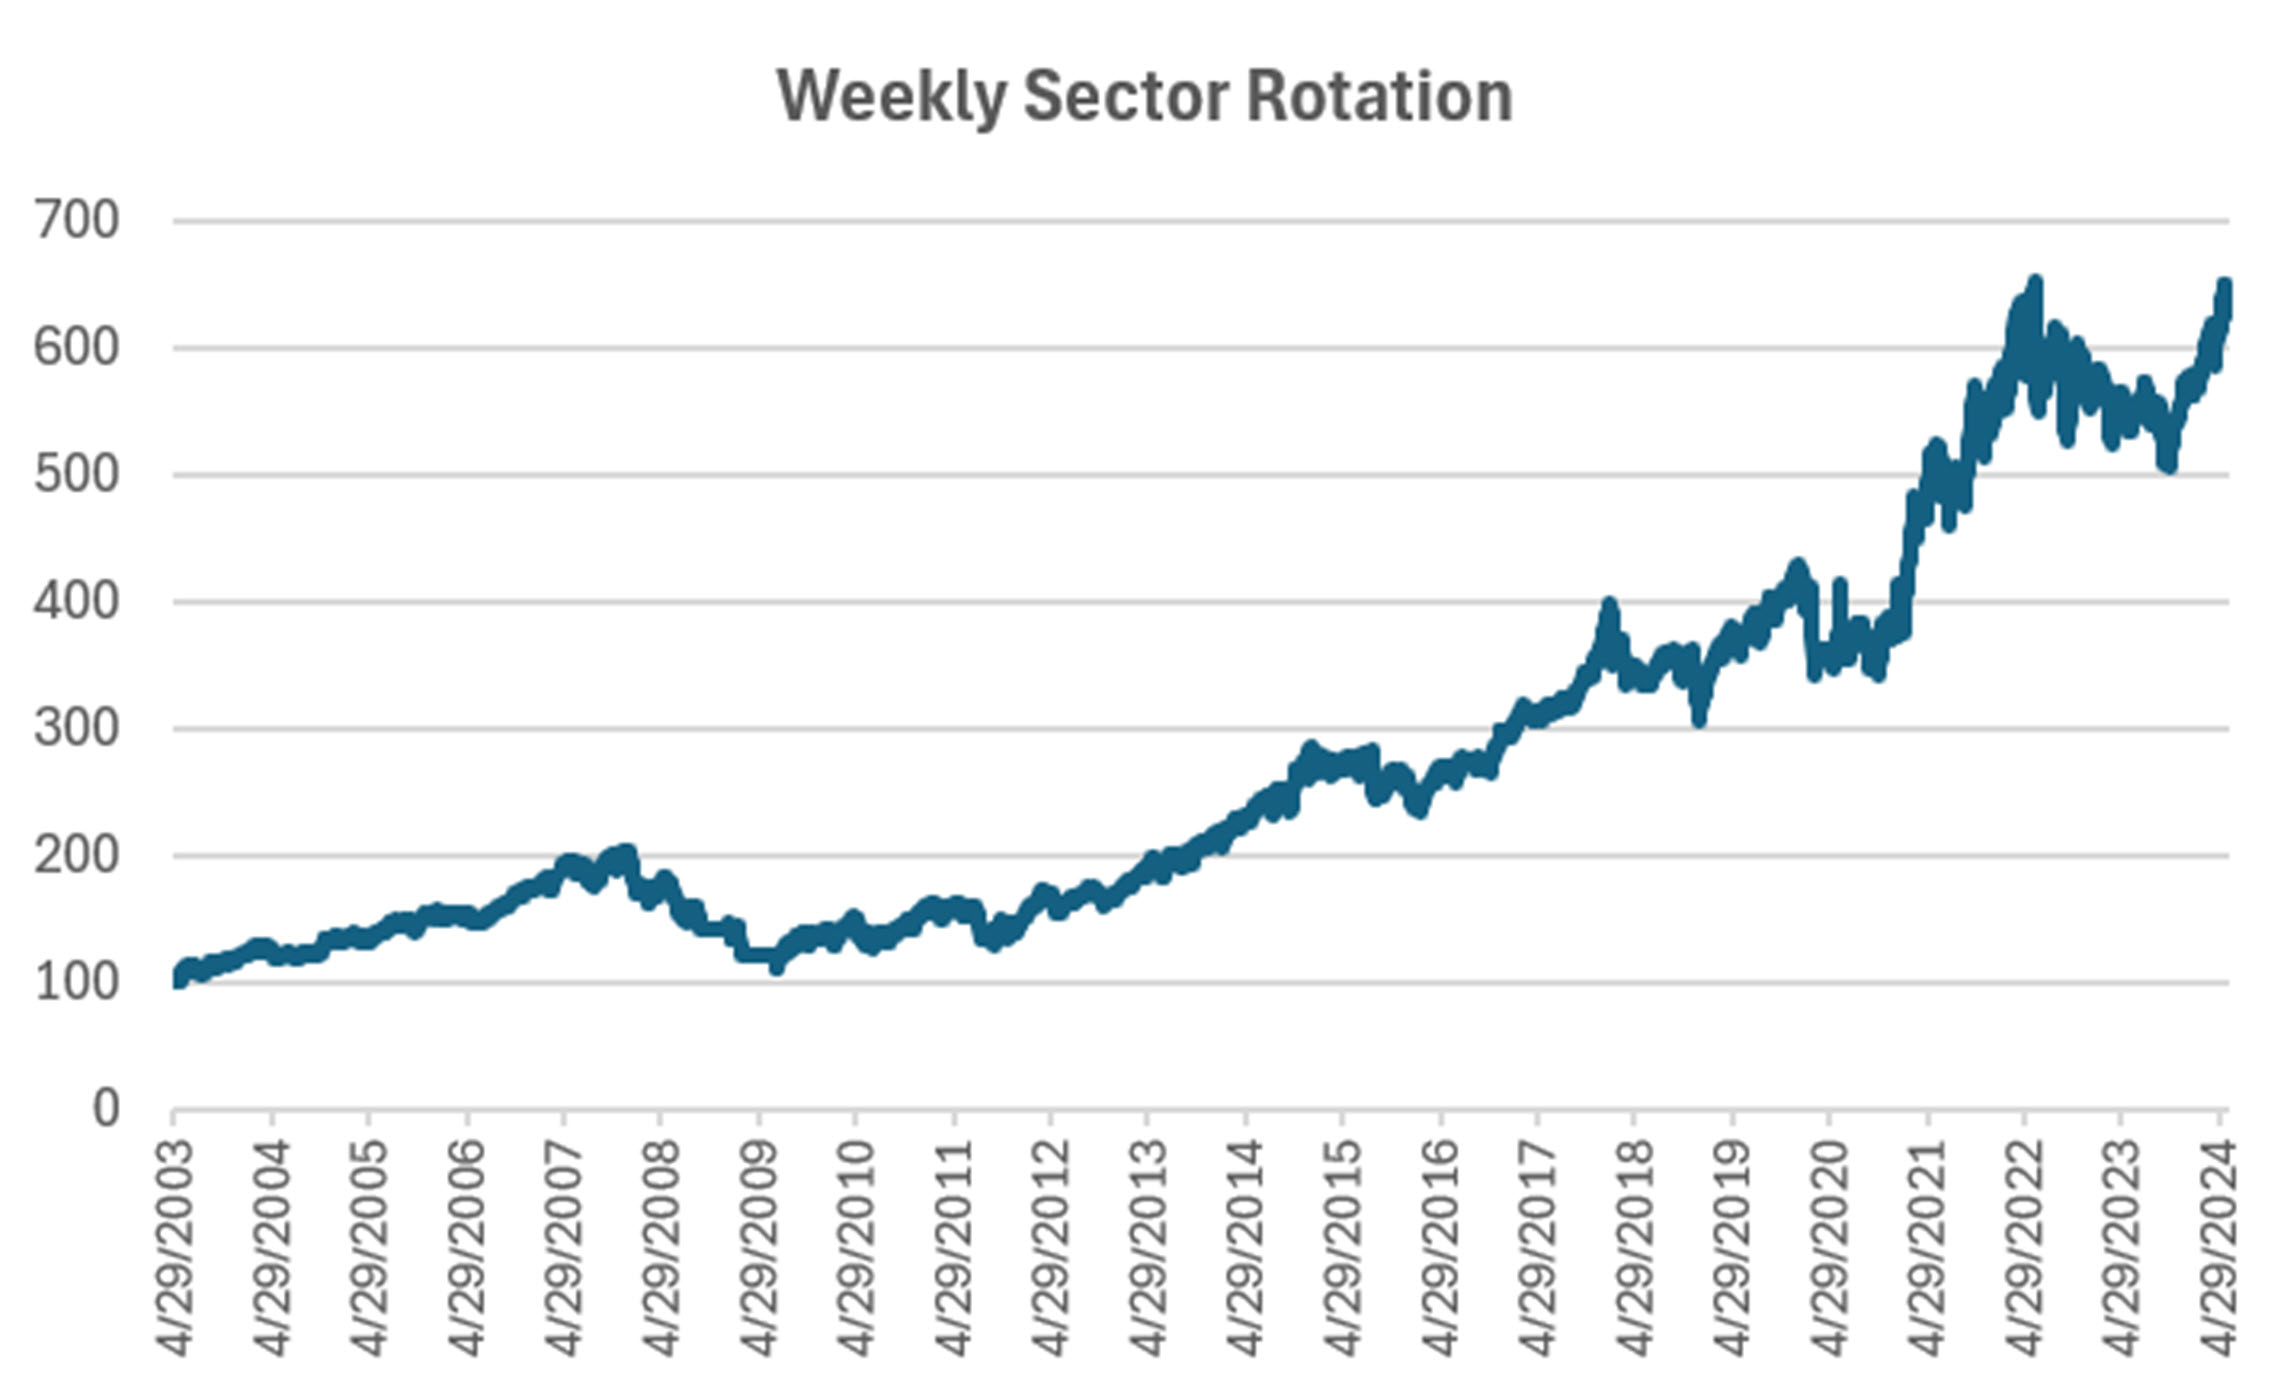
Sector Rotation
Without changing positions for months, the Sector Rotation program gained more than 5%, now higher by nearly 13% for the year, somewhat ahead of the S&P and NASDAQ. The chart below shows the daily returns.
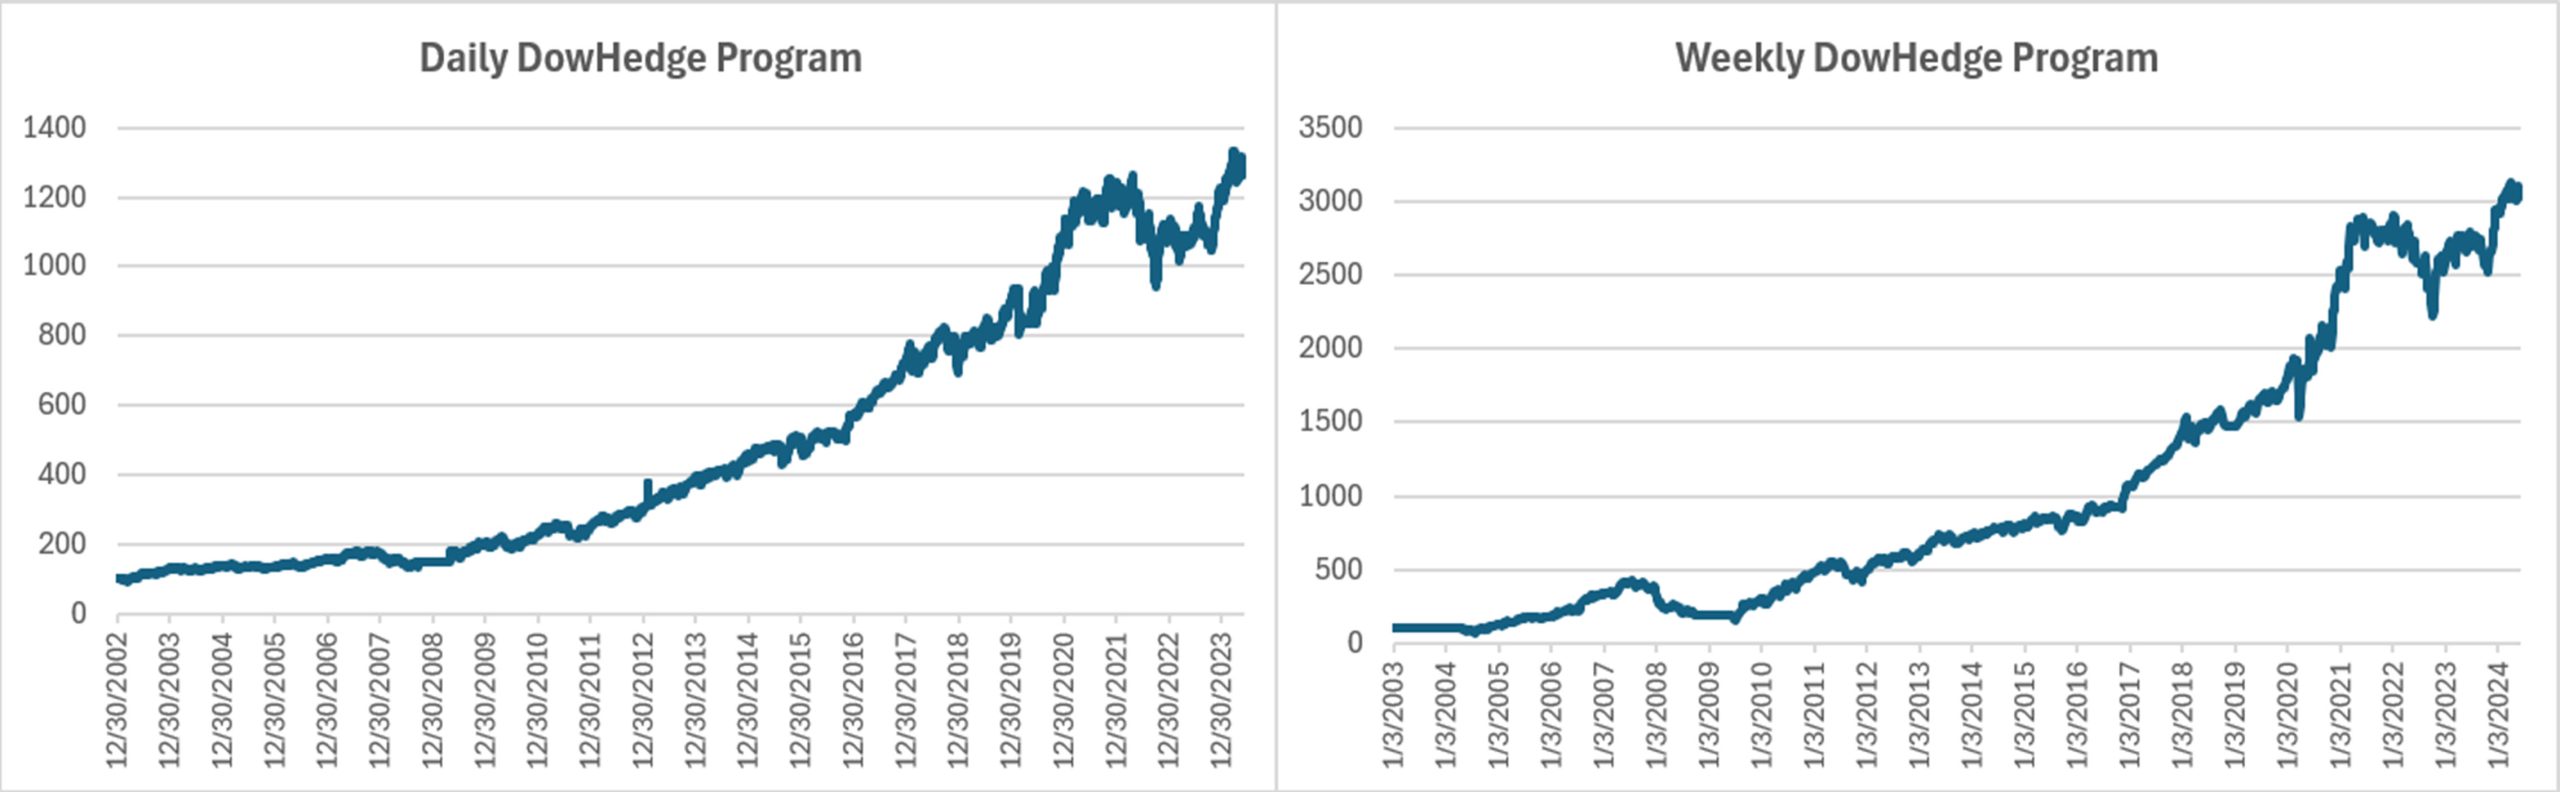
DowHedge Programs
Profits in May but lagging the other programs, the Weekly better by 2.8% and the Daily ahead by 4.8% for 2024, very much in line with the DOW index itself.
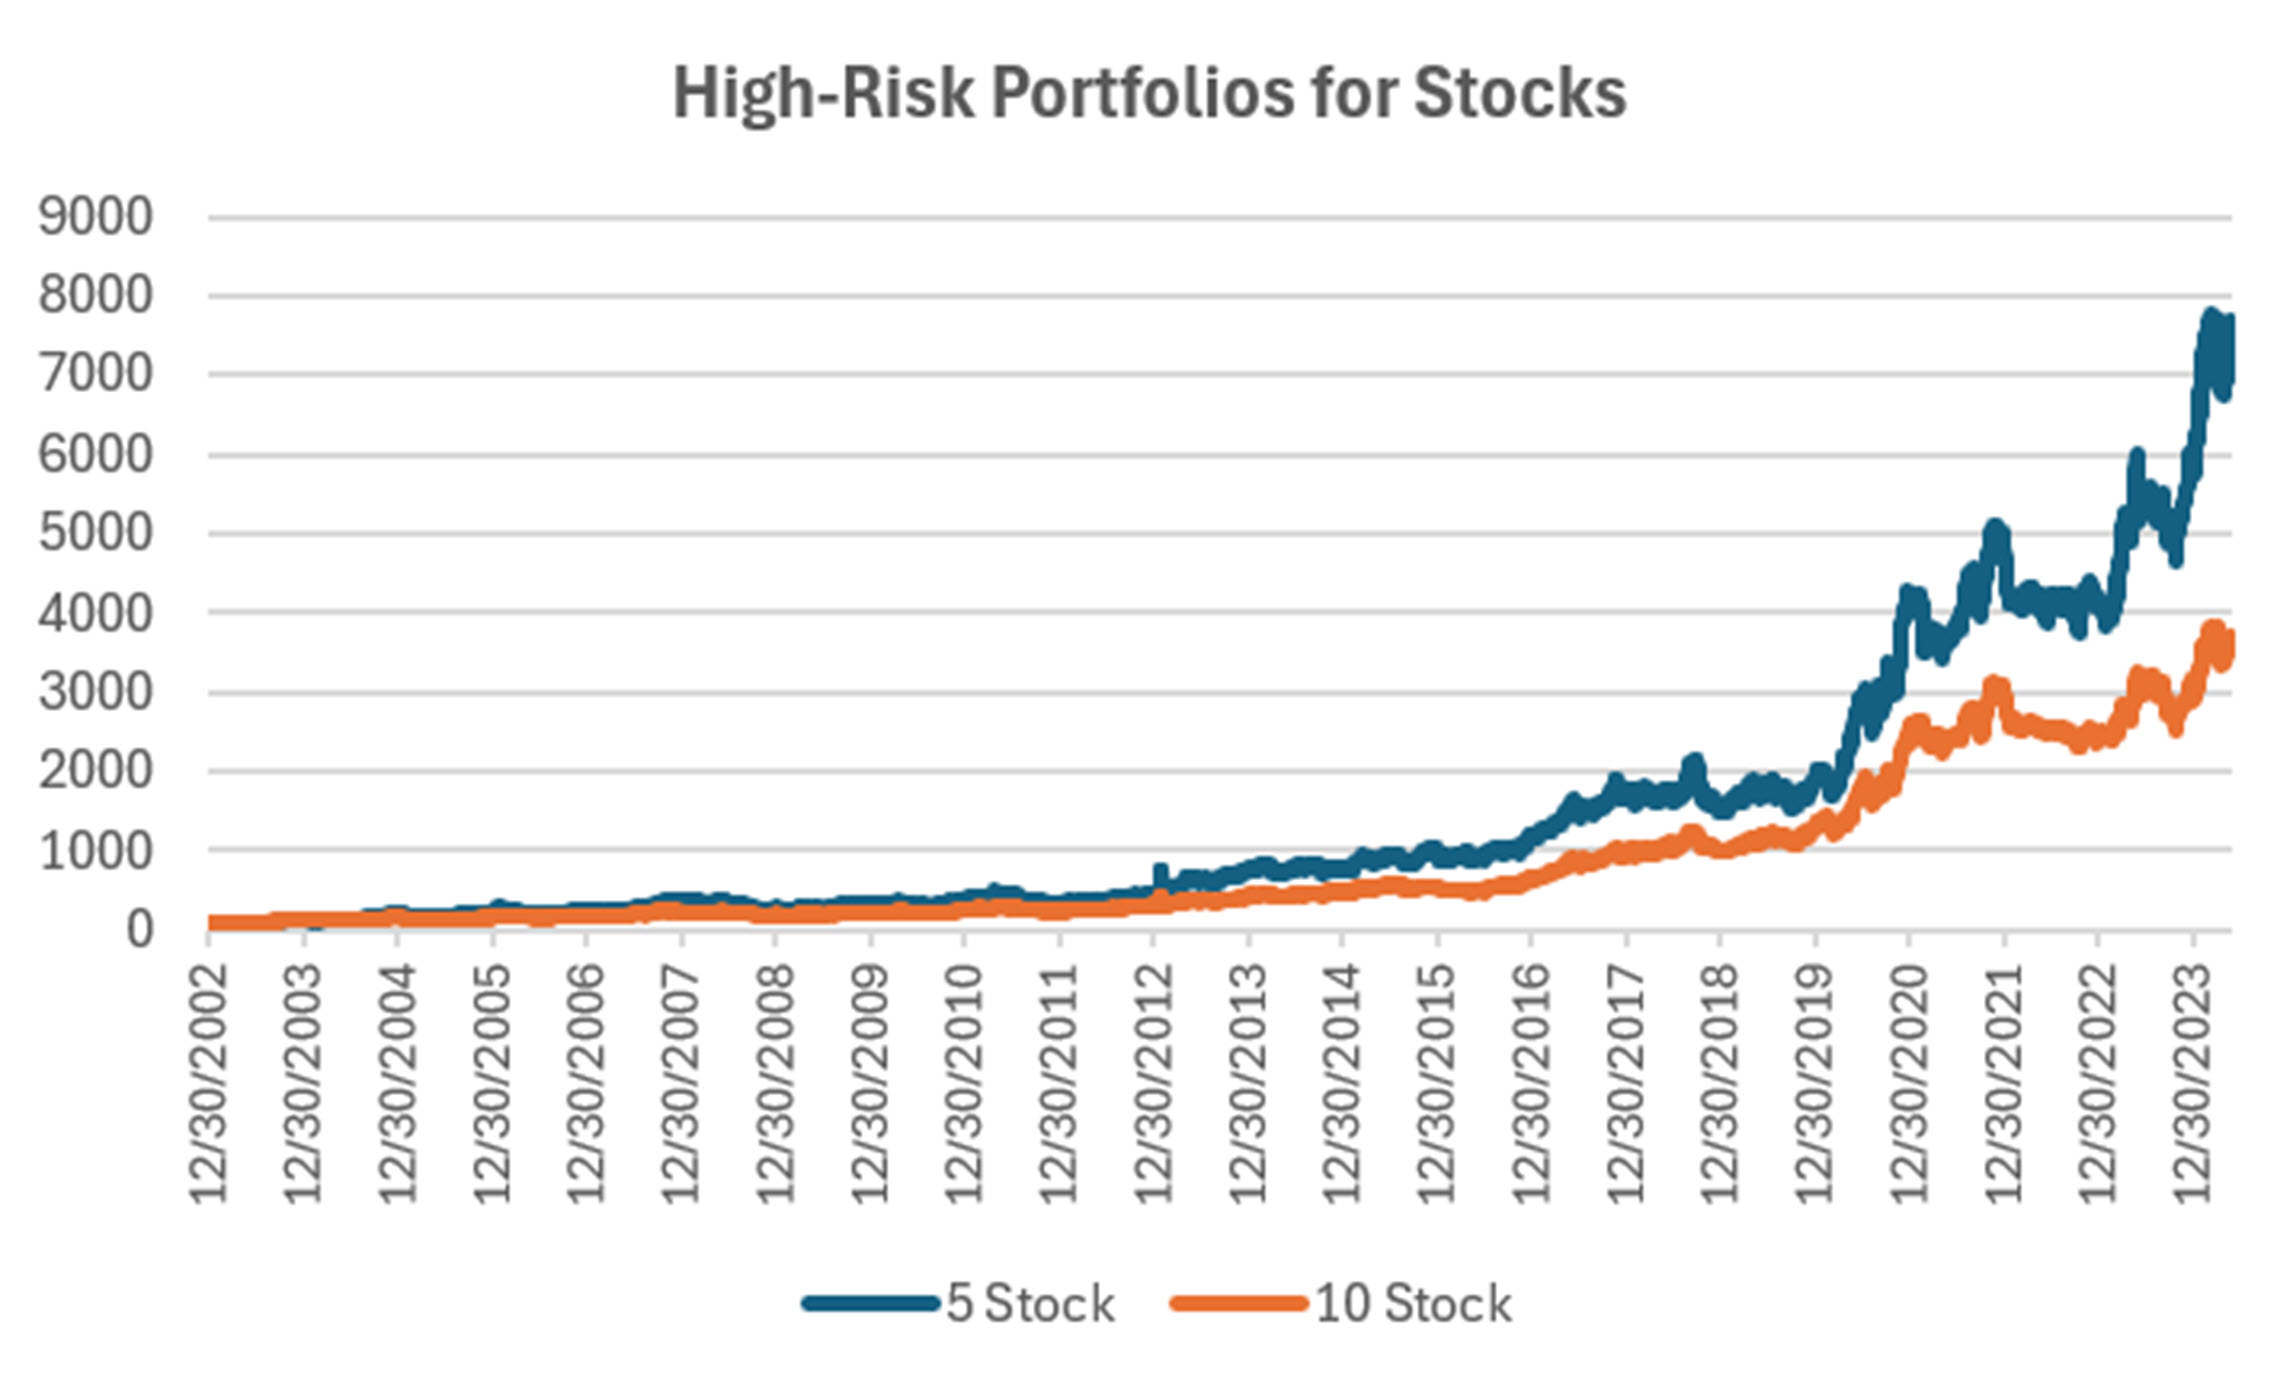
The New High-Risk Portfolios
It’s not that this new program is doing badly, but the benchmark Trend programs are slightly better. But when tech and healthcare stocks have a drawdown, a diversified portfolio has less risk. We still see technology as a good investment and will stick with it.
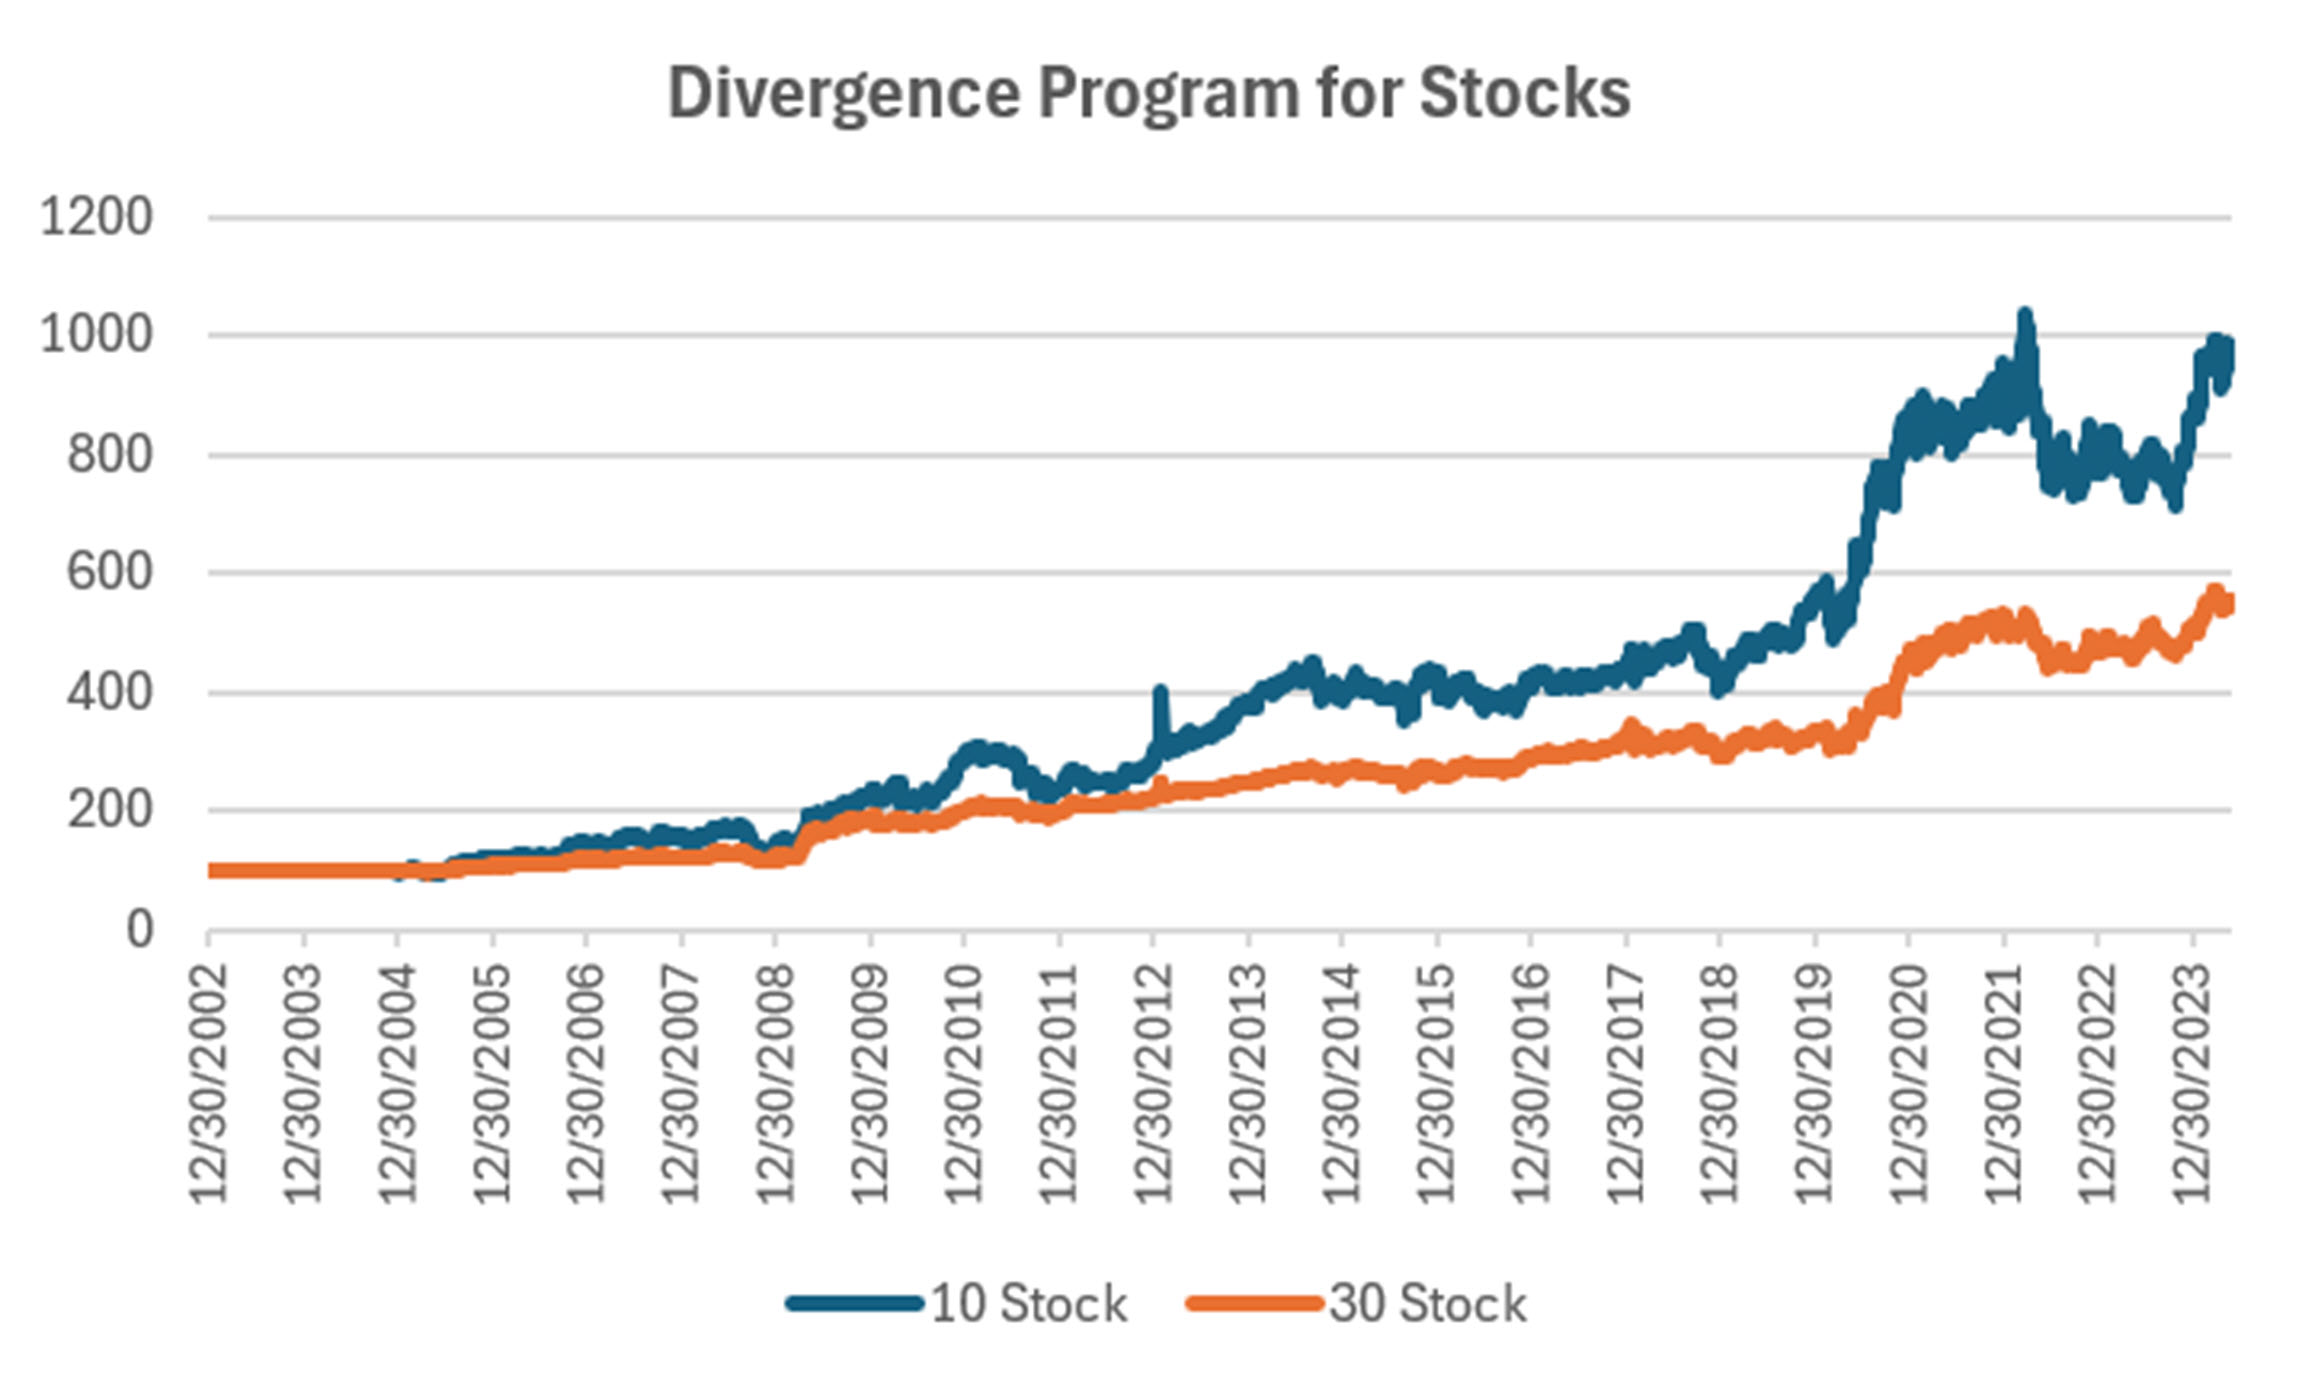
Group DE2: Divergence Program for Stocks
The Divergence program looks for patterns where price and momentum diverge, then takes a position in anticipation of the pattern resolving itself in a predictable direction, often the way prices had moved before the period of uncertainty.
Another portfolio that changed from losses to gains in May. Although the chart below is erratic, the 10-stock portfolio is higher by 13%, in-line with other portfolios. The 30-stock portfolio has a more difficult time finding enough trades, causing it to post lower returns, but is still up nearly 8% in 2024.
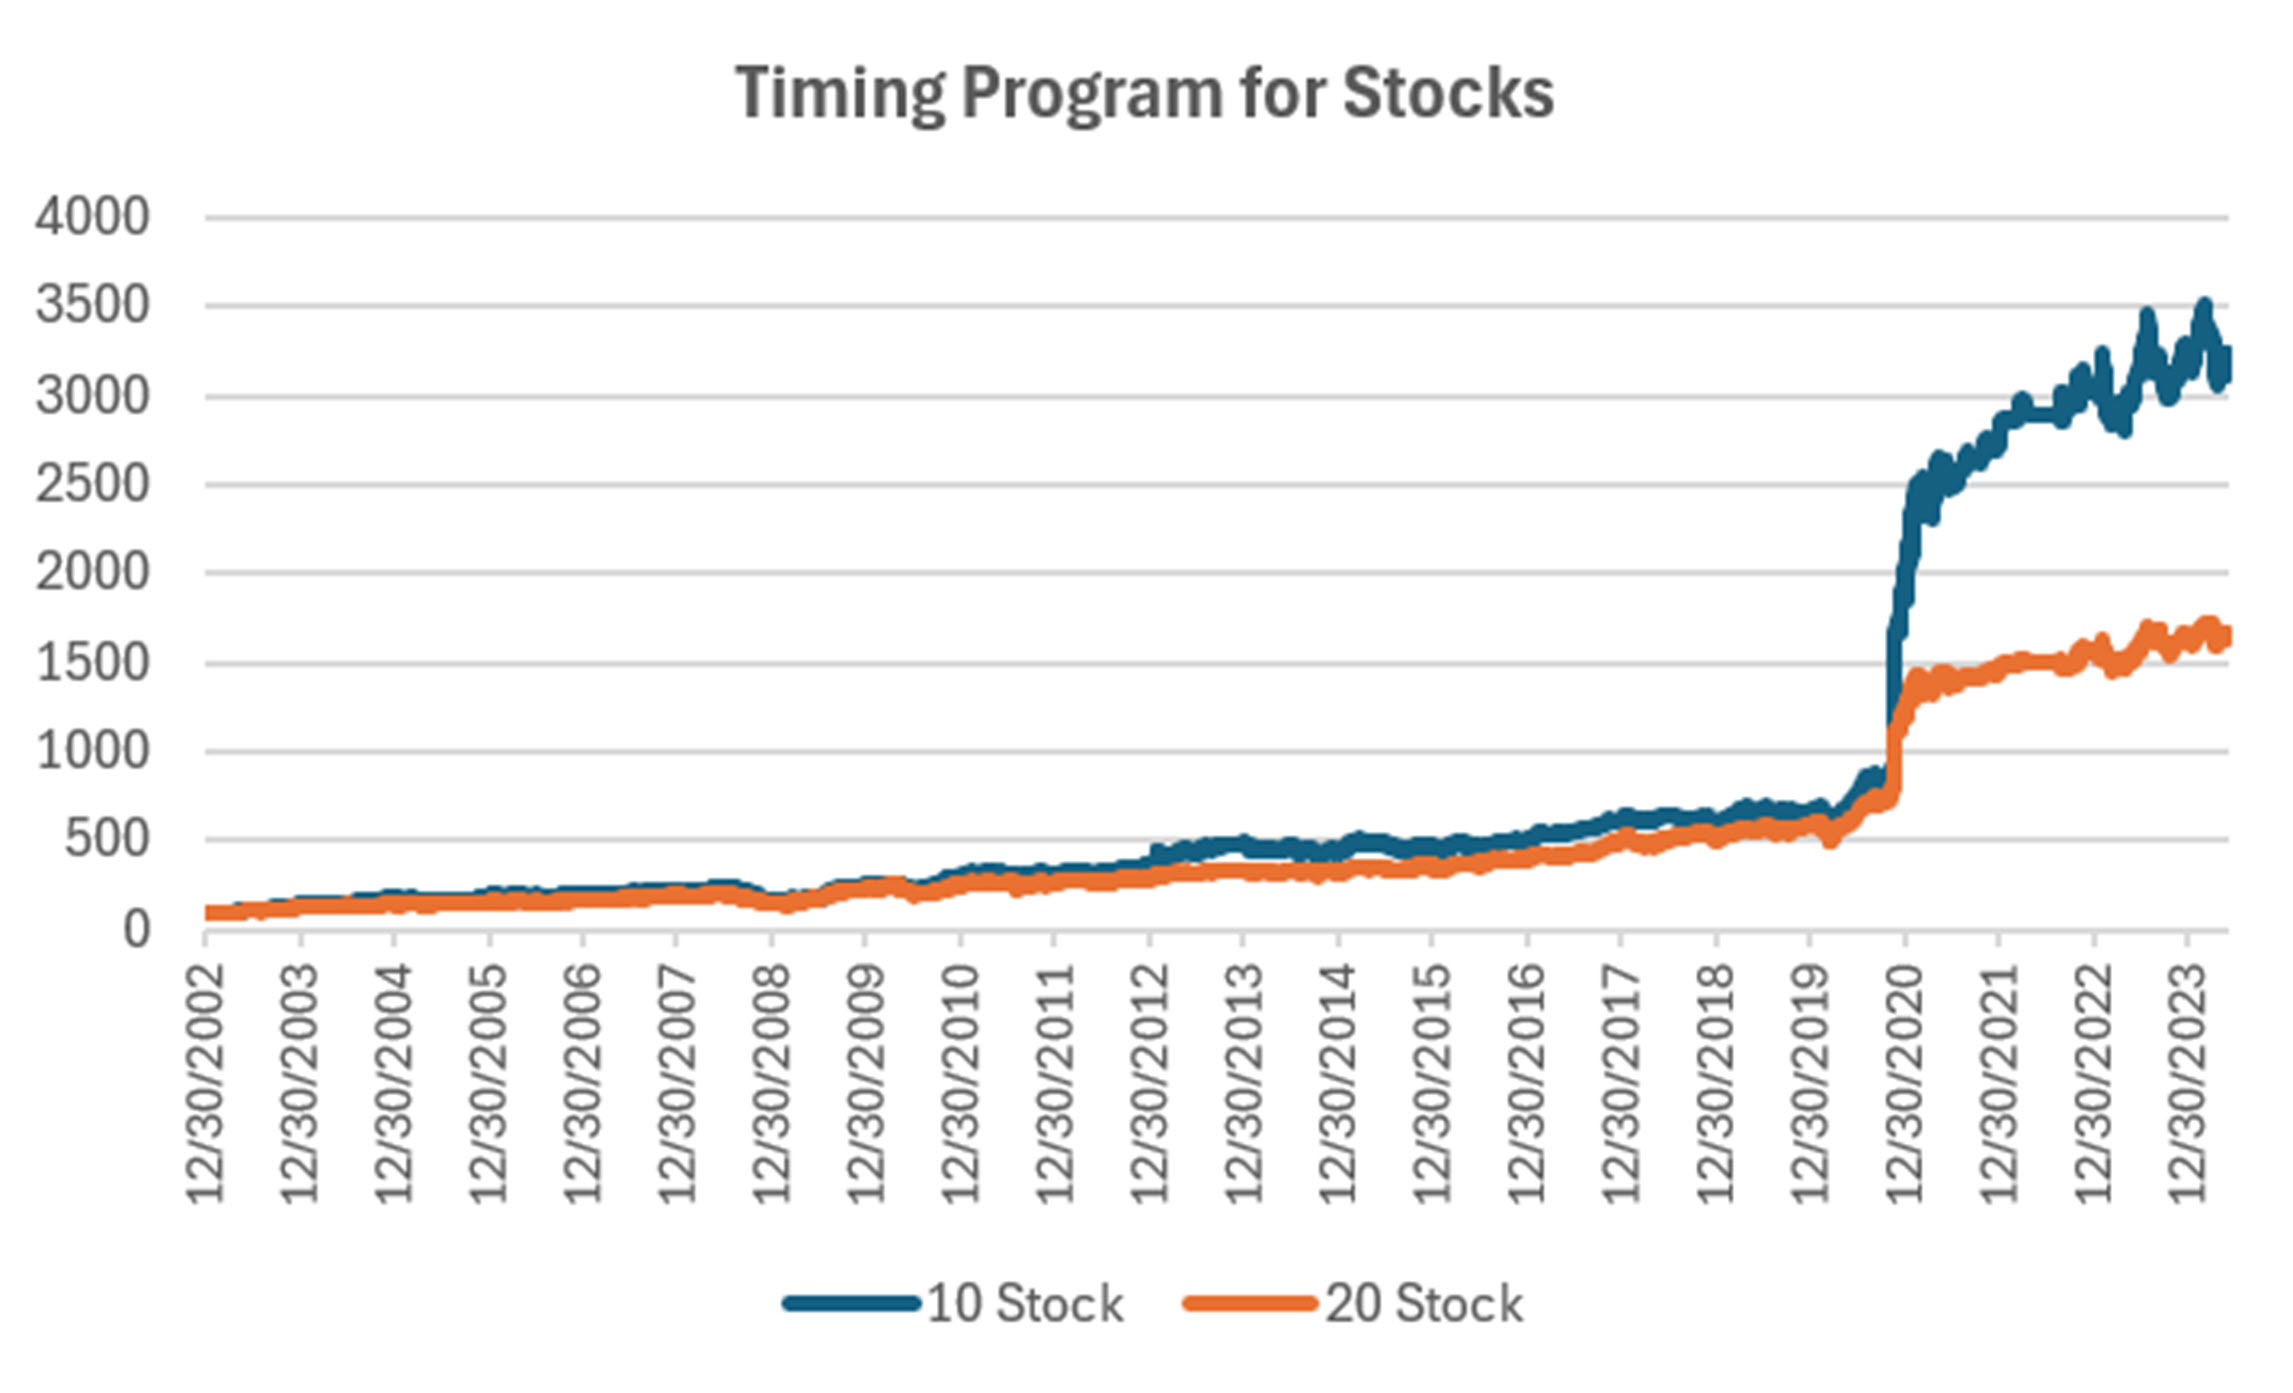
Group DE3: Timing Program for Stocks
The Timing program is a relative-value arbitrage, taking advantage of undervalued stocks relative to its index. It first finds the index that correlates best with a stock, then waits for an oversold indicator within an upwards trend. It exits when the stock price normalizes relative to the index, or the trend turns down. These portfolios are long-only because the upwards bias in stocks and that they are most often used in retirement accounts.
It may be hard to tell on the charts, but this program held Kohls (KSS) last week when it sold off by nearly 30%. That leaves it off slightly for the year. This program has a history of good returns and small drawdowns, so we’re looking for a recovery.
Futures Programs
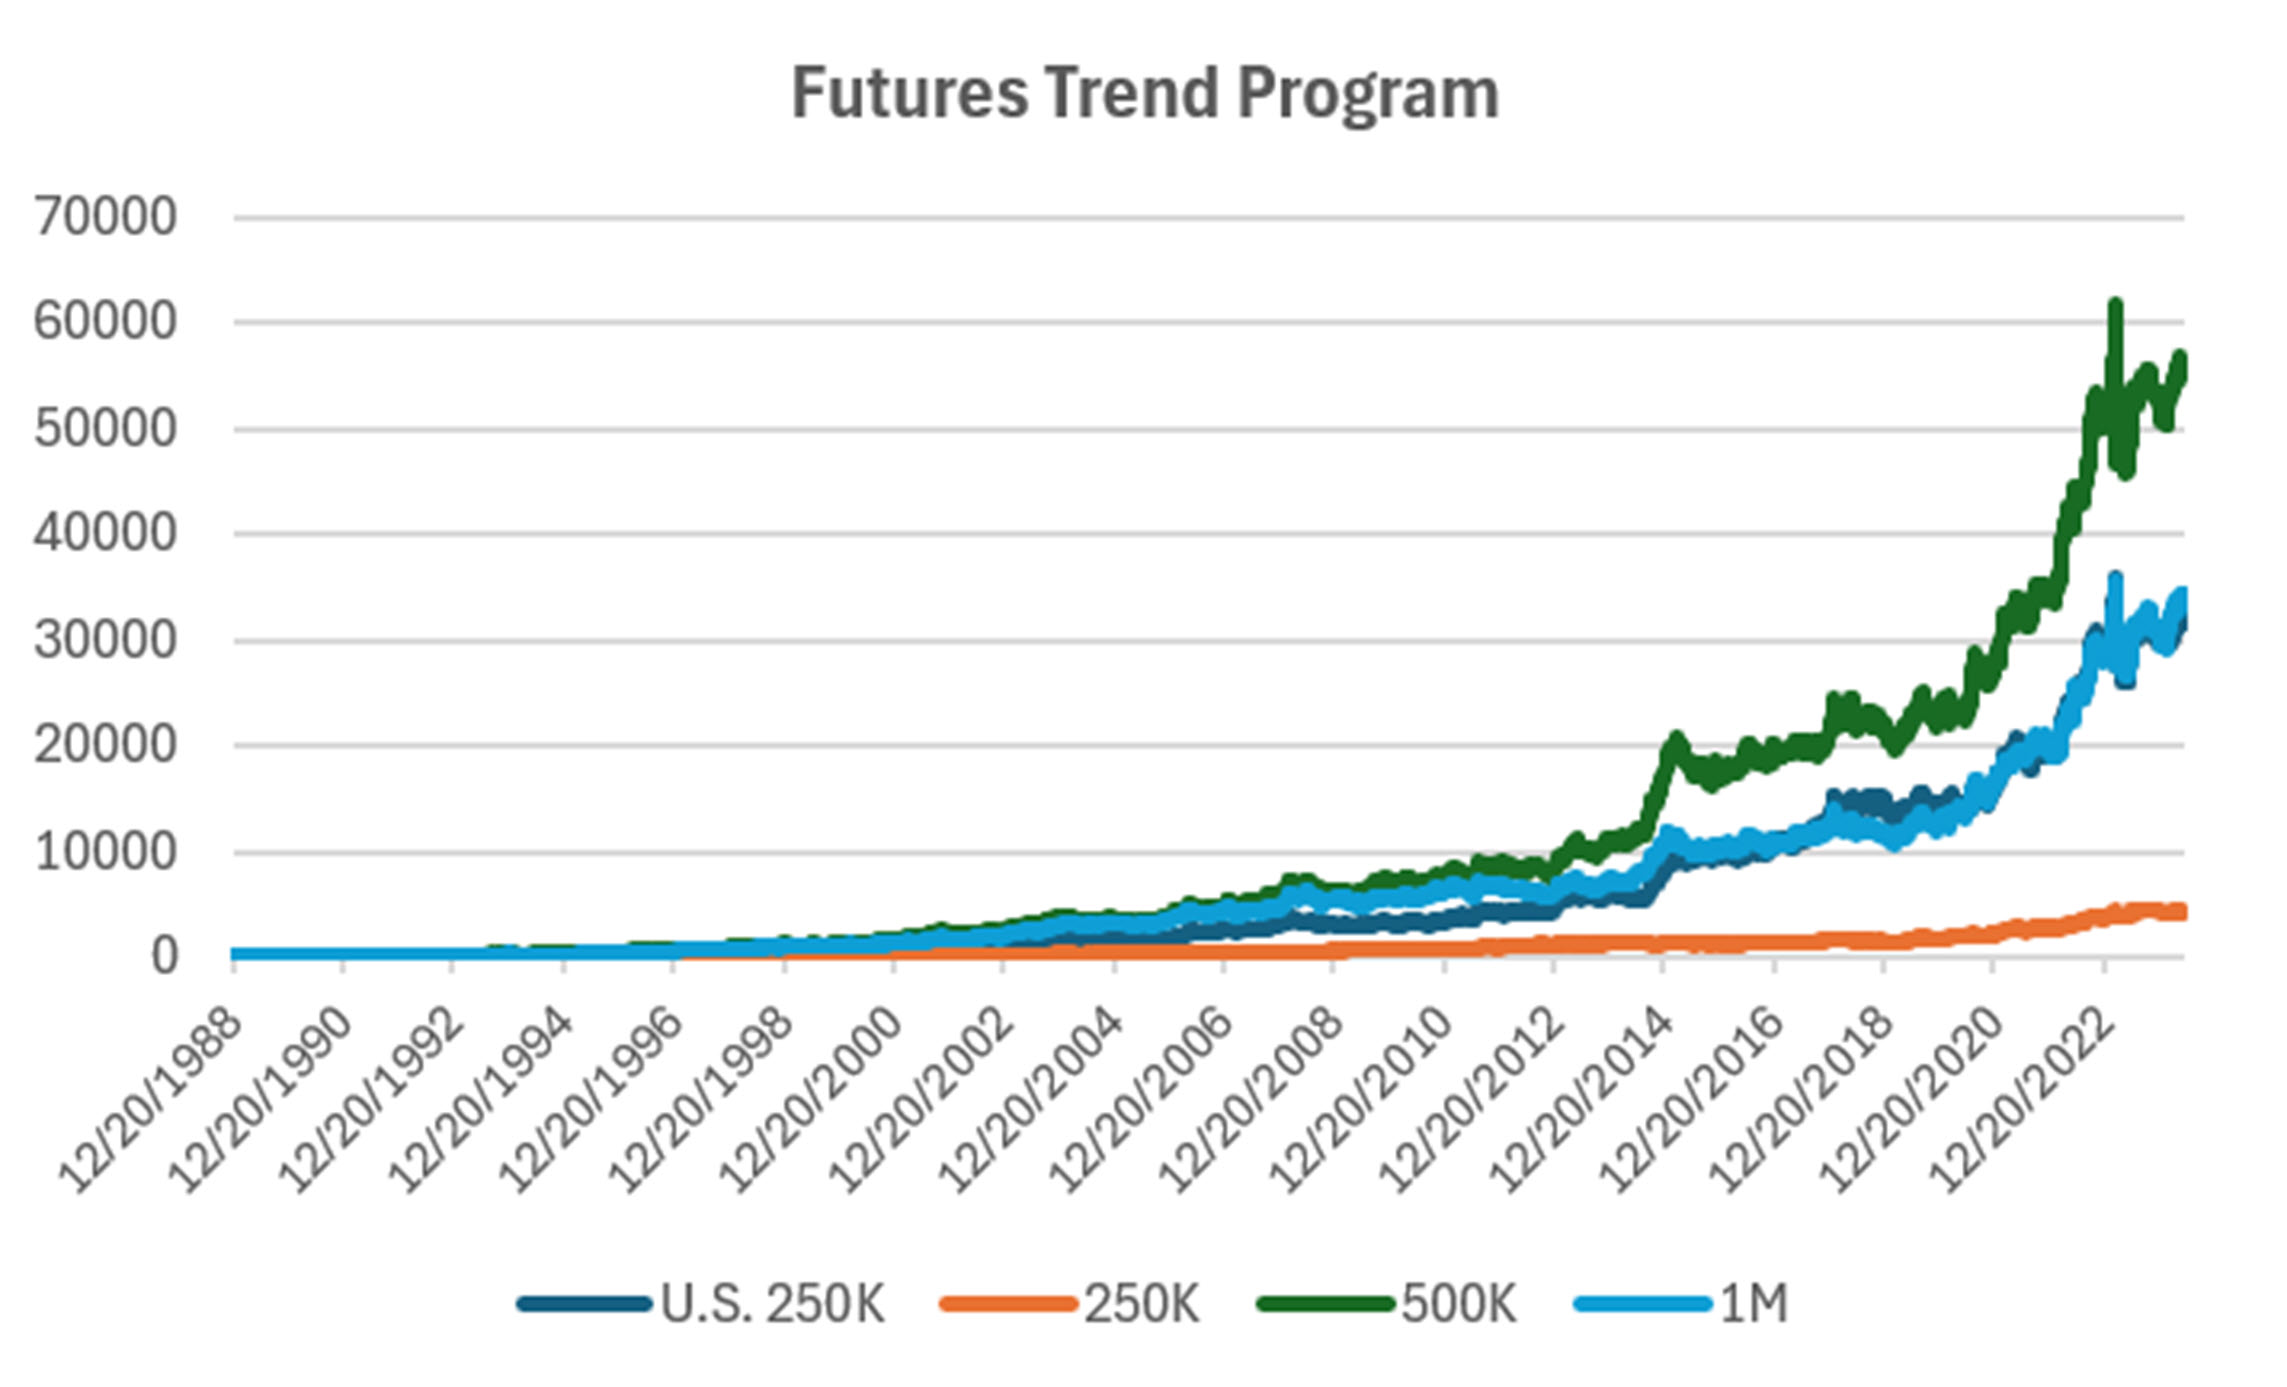
Groups DF1 and WF1: Daily and Weekly Trend Programs for Futures
Futures allow both high leverage and true diversification. The larger portfolios, such as $1million, are diversified into both commodities and world index and interest rate markets, in addition to foreign exchange. Its performance is not expected to track the U.S. stock market and is a hedge in every sense because it is uncorrelated. As the portfolio becomes more diversified its returns are more stable.
The leverage available in futures markets allows us to manage the risk in the portfolio, something not possible to the same degree with stocks. This portfolio targets 14% volatility. Investors interested in lower leverage can simply scale down all positions equally in proportion to their volatility preference. Note that these portfolios do not trade Asian futures, which we believe are more difficult for U.S. investors to execute. The “US 250K” portfolio trades only U.S. futures.
It may be hard to tell this month’s chart from last. Small losses in all portfolios leaves much the same. Still, the charts look upward slanting. As said earlier, interest rates tend to be the key to success in futures. Rates then affect currencies and lastly equities. So far, rates have gone nowhere.
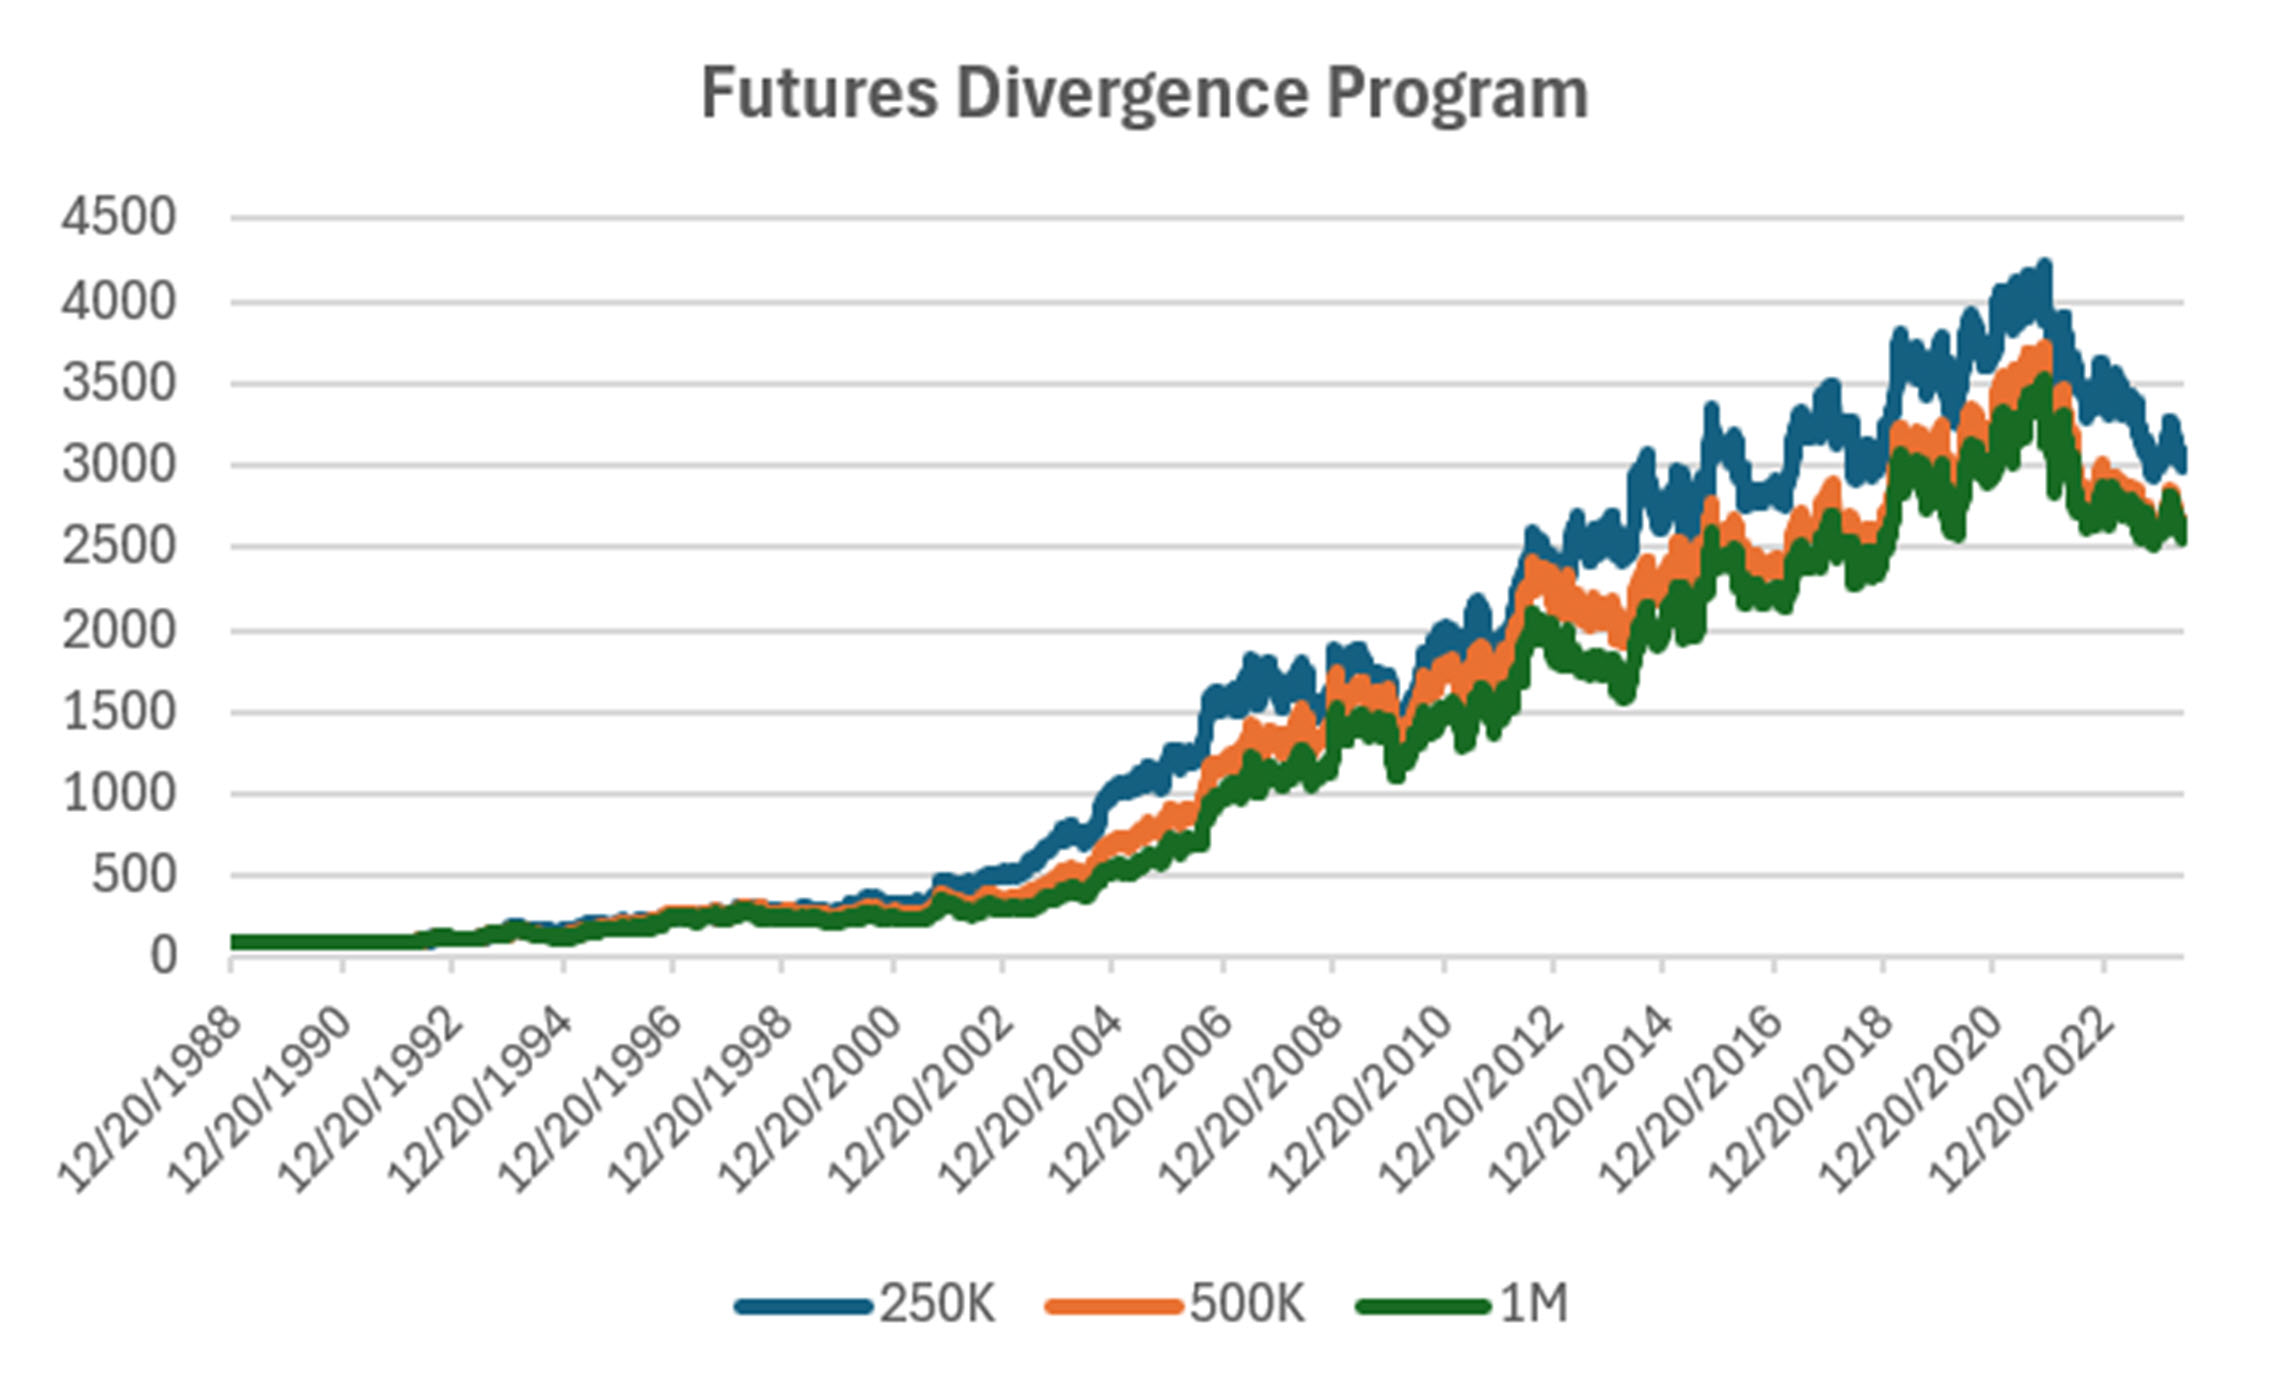
Group DF2: Divergence Portfolio for Futures
Losses of 2% to 3% cut gains in the 250K portfolio and turn larger programs marginally negative. This strategy counts on a pause in a trending market. So far there has been no trend and no way to take advantage of it.
Blogs and Recent Publications
Perry’s books are all available on Amazon or through our website, www.kaufmansignals.com.
June 2024
“Trading Extreme Gaps and Extreme Closes” looks at daily patterns in stocks, published in the June edition of Technical Analysis.
May 2024
In the April edition of Technical Analysis, Perry again deals with risk in “How Professional Assign Risk.” It is another chapter in how to protect yourself.
April 2024
Another article in the April edition of Technical Analysis, “Determining Risk Before It Happens.” Perry thinks this is an article everyone should read.
March 2024
In the 2024 Bonus Issue of Technical Analysis, Perry has an article, “Pros and Cons of Daily Versus Weekly Trend Following.” There is also a quote by him in the “Retrospective: Interviews” going back to April 1988.
Perry also posted an article on Seeking Alpha, “How To Exit a Trade.” A good reminder of the choices.
February 2024
Perry published an article on using the backwardation and contango in crude oil in “The Delta-Delta Strategy.” If not crude, the you might think of this for any commodity, including interest rates, that have a consistent term structure.
January 2024
A new article in February edition of Technical Analysis of Stocks & Commodities, “Crossover Trading: Arbitrating the Physical with the Stock.” A chance at diversification!
Perry posted 3 new articles on Seeking Alpha in December, “Where Do You Take Profits?”, “Is There a Better Day to Enter the Market,” and “Watching January Returns.”
Another article in Technical Analysis of Stocks & Commodities, “Gap Momentum,” another interesting way to identify the trend.
December 2023
Perry posted 3 new articles on Seeking Alpha, “Where Do You Take Profits?”, “Is There a Better Day to Enter the Market,” and “Watching January Returns.”
This month Technical Analysis of Stocks & Commodities published “A Strategy For Trading Seasonal and Non-Seasonal Market.” Turns out that most markets are non-seasonal!
November 2023
Perry posted two articles on Seeking Alpha, “Compression Breakout: Giving a Boost to Your Entries,” and “Volatility: The Second Most Important Indicator.” In addition, he interview Herb Friedman in Technical Analysis of Stocks & Commodities. Herb is a interest rate specialist focusing on low risk investments.
October 2023
In this month’s Technical Analysis of Stocks & Commodities Perry shows how Merger Arb works and how an investor can participate in it. Merger Arb has been the realm of Institutions, but there are opportunities for everyone.
August 2023
Two(!) new articles by Perry in the August issue of Technical Analysis of Stocks & Commodities. The first is a look at how ChatGPT might help traders. It even asks for a computer program to use trend following.
The second article is “Portfolio Risk Dilemma,” where Perry answers the question of whether to let a stock or futures profit run or rebalance, and whether you should do the same for a diversified portfolio.
Older Items of Interest
On April 18th, 2023 Perry gave a webinar to the Society of Technical Analysts (London) on how to develop and test a successful trading system. Check their website for more details, https://www.technicalanalysts.com..
Perry’s webinar on risk, given to the U.K. Society of Technical Analysts, can be seen using the following link: https://vimeo.com/708691362/04c8fb70ea
For older articles please scan the websites for Technical Analysis of Stocks & Commodities, Modern Trader, Seeking Alpha, ProActive Advisor Magazine, and Forbes. You will also find recorded presentations given by Mr. Kaufman at BetterSystemTrader.com, TalkingTrading.com, FXCM.com, systemtrade.pl, the website for Alex Gerchik, Michael Covel’s website, TrendFollowing.com, and Talking Trading.com.
You will also find up to six months of back copies of our “Close-Up” reports on our website, www.kaufmansignals.com. You can address any questions to perry@kaufmansignalsdaily.com.
© May 2024, Etna Publishing, LLC. All Rights Reserved.