Industry Benchmark Performance
Hedge funds moved higher in September. The overall market was good although AI stocks are languishing. While the Fed lowered rates, the market had already discounted it. Now it wants to discount the next Fed move. At some point, lower rates will stimulate the economy, but the markets are not yet showing it.
Note that we changed the CTA Benchmarks because Barclays is no longer showing the previous results. We now have “systematic” and “elite systematic,” whatever that means.

Source: BarclayHedge Indices.
Kaufman’sMost Popular Books (available on Amazon)
Trading Systems and Methods, 6th Edition. The complete guide to trading systems, with more than 250 programs and spreadsheets. The most important book for a system developer.
Kaufman Constructs Trading Systems. A step-by-step manual on how to develop, test, and trade an algorithmic system.
Learn To Trade. Written for both serious beginners and practiced traders, this book includes chart formations, trends, indicators, trading rules, risk, and portfolio management. You can find it in color on Amazon.
You can also find these books on our website, www.kaufmansignals.com.
Blogs and Recent Publications
Find Mr. Kaufman’s other recent publications and seminars at the end of this report. We post new interviews, seminars, and reference new articles by Mr. Kaufman each month.
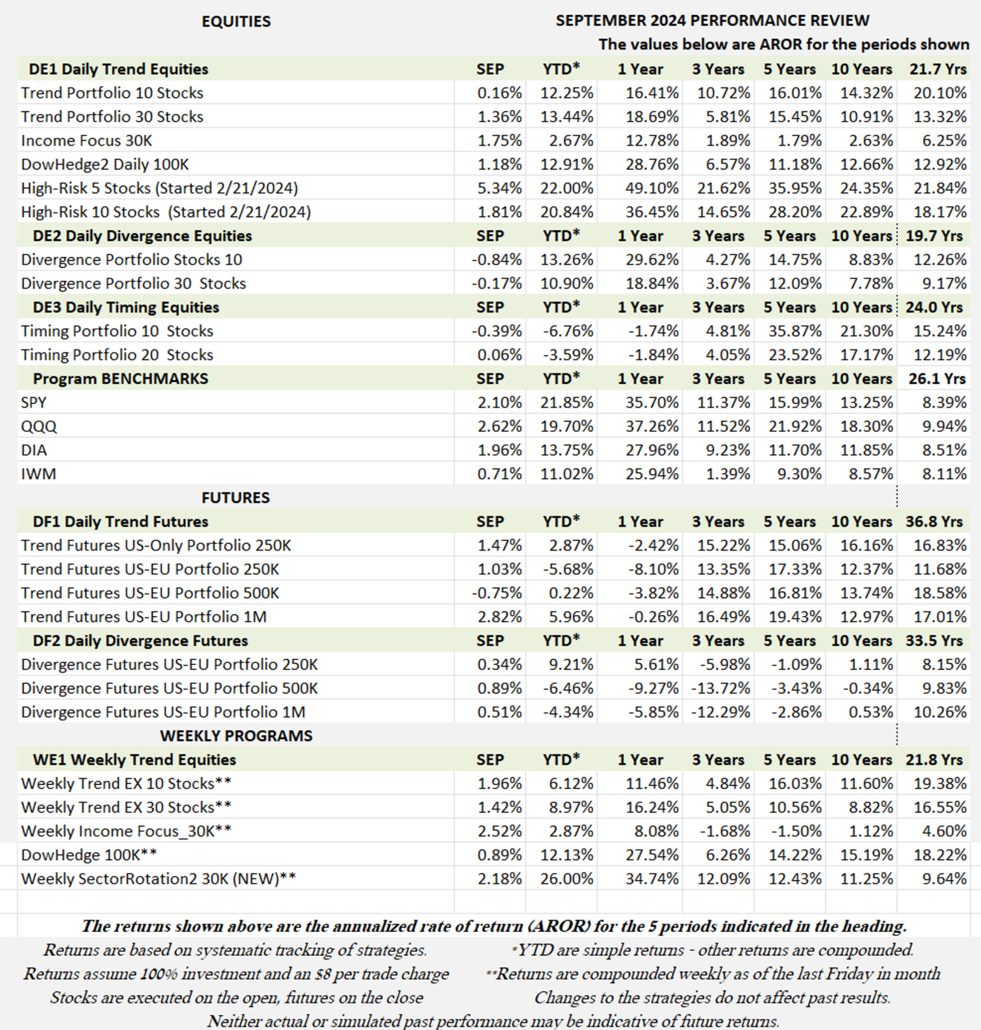
September Performance in Brief
Although we gained in nearly all portfolios, it is still a difficult market. Artificial intelligence stocks have lost their glamour but remain very volatile. Our Trend portfolio divested earlier, but are having a difficult time figuring out which new sector to trade. Meanwhile, we are holding a diversified portfolio. The surprise is that the Weekly Sector Rotation program keeps gaining.
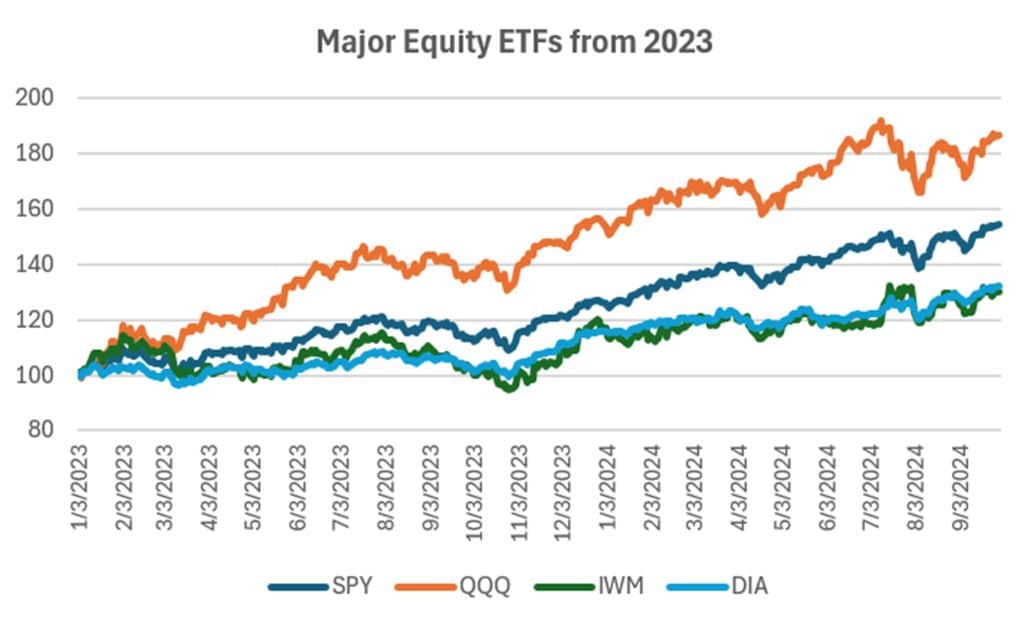
Major Equity ETFs
A small switch in the performance of the ETFs. With AI stocks stalling, the S&P has been gaining, posting new highs in September and reflecting what we think will be lower interest rates. The DOW and the small caps, IWM, are also gaining. Only Nasdaq is struggling, but as soon as it catches up to expectations, we expect Nasdaq to again take the lead.
Insert Major Index
CLOSE-UP: Trading AI
[This report used data from January 1, 2015 to mid-September 2025. It has not been updated for the last 10 days; however, 10 days out of 2500 should not affect the results!]
I posted a shorter version of this report on Seeking Alpha on September 9th. It’s important for investors who want to take advantage of artificial intelligence stocks.
We all know that artificial intelligence stocks have been driving the market, mostly higher, sometimes lower. Lately, the market is languishing, trying to catch up to expectations. In particular, Nvidia (NVDA) the most visible semiconductor company. It claims to be ahead of its peers, and the market seems to acknowledge that. But there are other companies competing. If I can get 95% of the features at a lower price and faster delivery, that might be my choice. Therefore, we’ll watch Broadcom (AVGO) and Advance Micro Devices (AMD), even the semi ETFs to see what might be the best investment.
Then there are companies using AI chips, such as Google (GOOGL) and Microsoft (MSFT). And more that are applying the technology to cybersecurity and customer service, such as Crowdstrike (CRWD) and Goldman Sachs (GS). Which are the companies with the greatest benefit?
Some Background
Searching Google, we find that Generative AI, or generative artificial intelligence, is a type of AI that can create new content such as text, images, audio, music, and videos. It's the next step in AI and uses machine “learning” to find patterns from data to create new content.
“Generative” means it creates rather than using specific rules. They are called “deep learning models.” My own take is that it doesn’t actually “learn” anything, it’s just very good at organizing and repeating what’s been done in the past. There are issues of copyright infringement that are yet to be resolved.
Generative AI can be used for a variety of purposes, including creating chatbots, virtual assistants, and media. For example, ChatGPT is a form of generative AI that uses the GPT (Generative Pre-trained Transformer) architecture to generate human-like text. I am particularly impressed by the way it can create correct sentences from disjoint facts and put them in the correct order.
Generative AI can be susceptible to bias, and the information it produces can be dangerous, unsafe, or ever wrong. For example, if a language model is trained on data that assumes doctors and judges are male, it might produce biased results. We also saw attorneys that quoted previous cases that didn’t exist! Be careful what you are willing to accept as true.
Semiconductors
There are two popular semiconductor ETFs, iShares SOXX and Philly’s SOXL (leveraged 3X). iShares has more weight on the top five assets, AVGO, NVDA, AMD, AMAT, and QCOM (AVGO at 9.93%), while SOXL has more even weighting with AMD, AMAT, QCOM, KLA, and MPWR at the top (AMD at 6.88%). But it’s the leverage that can be a problem.
But the returns are very different, SOXX returned 22.9% annually while SOXL returns were 29.9%, not anywhere near three times SOXX. The return to risk ratio of SOXX is 0.735 while SOXL is 0.325. Trading SOXX is the clear choice. The cost of leveraging is too high.
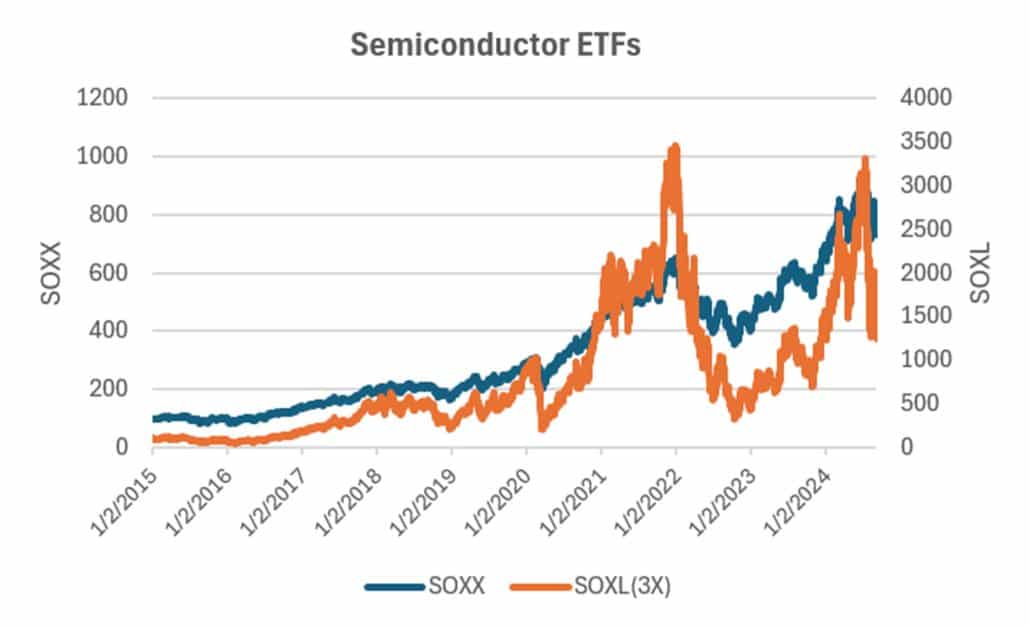
Figure 1. Comparing SOXX and SOXL (as of 9/6/2024)
Equal-Weighting of ETFs
I always prefer equal weighting to capitalization weighting. Equal weighting improves diversification and gives a better look at how the market is performing. Take NVDA. It has overwhelmed the semiconductor and AI industry. If you have it in your portfolio, using capitalization weighting, the gains and losses of your entire portfolio are the result of NVDA price fluctuations.
I also don’t like using all of the semi and AI stocks, because the ones at the bottom often don’t move and lower volatility of the ETF by doing nothing. By taking the five top allocations and equally weighting them, we can get a better idea of how each ETF differs.
In Figure 2 I have equally weighted the top 5 stocks from SOXX and SOXL. Results are clearly less volatile due to diversification. By not having NVDA in SOXL, it lags behind SOXX. But is the reward to risk ratio better? Figure 3 compares the two ETFs, first using its current weighting and next with the top five allocations equally weighted.
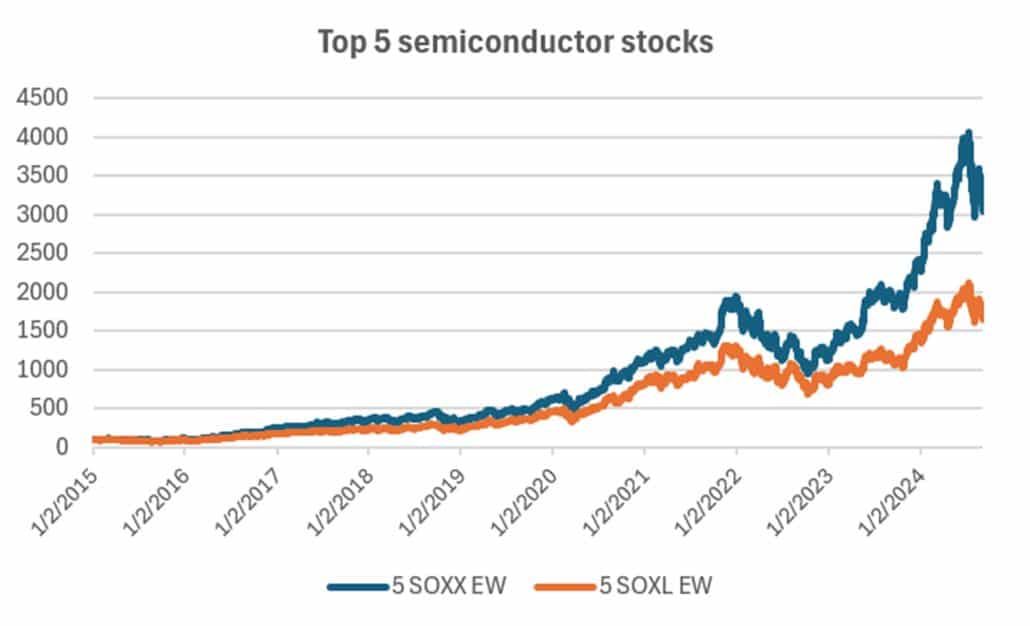
Figure 2. SOXX and SOXL using the top five allocations, equally weighted.

Figure 3. Return, risk, and return/risk ratio for the original ETFs and for the top five allocations, equally weighted.
Figure 3 shows that the equally-weighted approach (the two right columns) have much closer ratios. However, the 5-stock returns of SOXX and SOXL show the difference. Again, it is likely to be the result of NVDA. In both cases, SOXX has a better return for the risk.
Investing in Nvidia, Broadcom, and Advanced Micro Devices
While it seems that the SOXX ETFs gives an impressive return with proportionately lower risk, some traders would prefer engaging with the leader, Nvidia.
Nvidia (NVDA)
From January of 2015, NVDA has had an annualized return of 74.3% with a risk (annualized volatility) of 49.1%. That gives an information ratio of 1.51 (very high). The problem is: could you have held your NVDA position with a 49% volatility? Not likely.
Most funds target not more than a 14% volatility. That’s a 16% chance of a decline of 14%, or a 2.5% chance of a decline of 28%. A 49% volatility is a 16% chance of a 49% drop and a 2.5% chance of a 98% drop. That’s not a good picture.
If we reduce the volatility to 14%, we get a return of 21.1% (a factor of 0.285). That’s still very good. Then you can trade NVDA by reducing your standard position by a factor of 0.28, or about ¼.
AVGO
Let’s see what happens to AVGO (Broadcom) using the same method. Its return has been 34.8% with a volatility of 36.3%, giving a ratio of 0.958. To reduce that to 14%, we use a factor of 0.383. That gives a return of 13.3%. A bit disappointing, but realistic, and better than the S&P.
Trading Semis Using a Moving Average
Can a simple trend system do better than a buy-and-hold? We tested NVDA, AVGO, and AMD to see if we could find a moving average with good returns and less drawdown/volatility. A broad test of NVDA showed the best moving average at 130 days. That’s a pretty long calculation period, and likely to hold a trade well into its transition from long to short.
Our tests for semis are shown in Figure 4. I like to show the test together and choose a single calculation period that works for all the markets tested. In this case, it looks as though it’s 120 or 130. NVDA peaks at 130 while AVGO and AMD peak at 120. But since NVDA is still good at 120, that will be my choice. Let’s compare that with Buy & Hold.
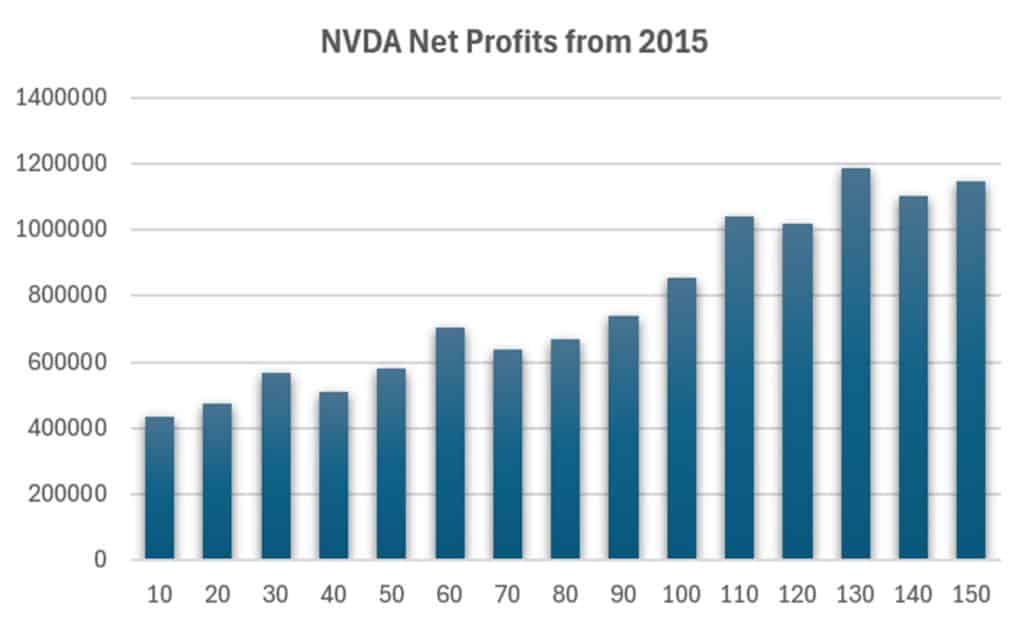
Figure 4. Moving average tests of major semiconductors, from 2015.
The table in Figure 5 shows the best moving average results, although there would be very little variation in returns between periods of 120 to 150, as you can see in Figure 4.
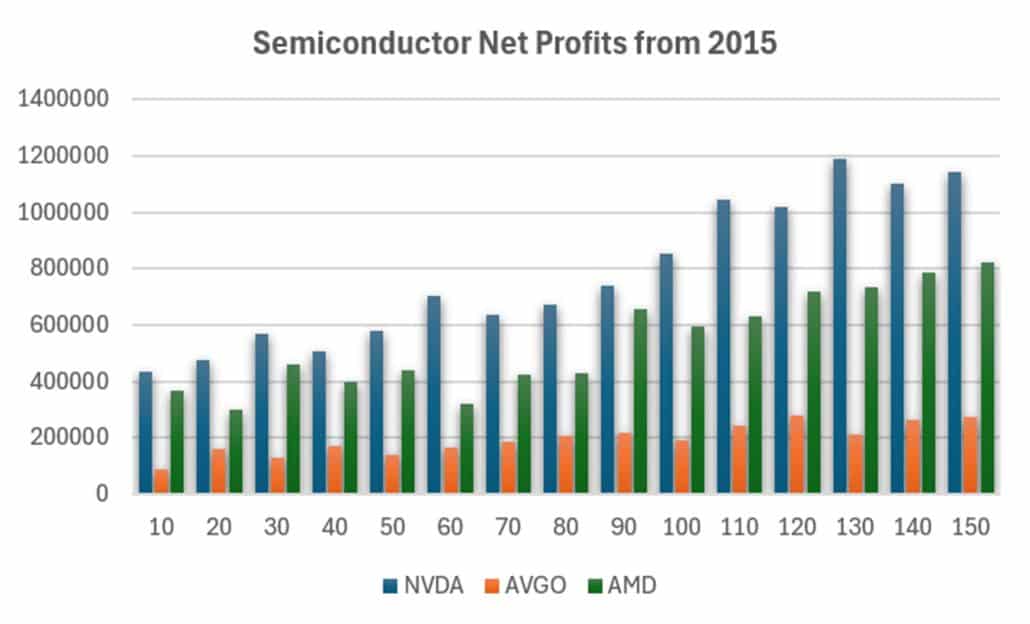
Figure 5. B&H versus best moving average calculation periods, from 2015.
The clear difference between a B&H and a moving average are the returns, 19% versus 11%, with the semi stocks showing the most returns. However, they also show the biggest drawdowns and have lower return to risk ratios. As I said earlier, can you actually trade a stock that has a 50% drawdown? Perhaps for the three semiconductor stocks, you can reduce the leverage by 50% and still get good returns. For the others, reducing leverage makes them uninteresting.
In the bottom line of Figure 5 we can get an 11% return with a 3.35 ratio. That is an extremely good return to risk.
Conclusion
Trading AI stocks is all about risk. Without either lowering leverage or trading a moving average, the risk is too high. The moving averages favor long calculation periods, which will be good if AI continues to move higher but has the disadvantage of giving back gains if prices reverse.
Semiconductors are the obvious place to invest. Next are the big software companies. META, not included, seems to be doing better. Personally, I don’t expect the same gains in semis that we have already seen in Nvidia. I always believe that competitors will surface, much like we’ve seen in Tesla. Taking a safer, lower leveraged approach to these markets will reduce the volatility and still allow for excellent returns. But prices need to catch up to expectations.
A Standing Note on Short Sales
Note that the “All Signals” reports show short sales in stocks and ETFs, even though short positions are not executed in the equity portfolios. Our work over the years shows that downturns in the stock market are most often short-lived and it is difficult to capture with a longer-term trend. The upwards bias also works against shorter-term systems unless using futures, which allows leverage. Our decision has been to take only long positions in equities and control the risk by exiting many of the portfolios when there is extreme volatility and/or an indication of a severe downturn.
PORTFOLIO METHODOLOGY IN BRIEF
Both equity and futures programs use the same basic portfolio technology. They all exploit the persistence of performance, that is, they seek those markets with good long-term and short-term returns on the specific system, rank them, then choose the best, subject to liquidity, an existing current signal, with limitations on how many can be chosen from each sector. If there are not enough stocks or futures markets that satisfy all the conditions, then the portfolio holds fewer assets. In general, these portfolios are high beta, showing higher returns and higher risk, but have had a history of consistently outperforming the broad market index in all traditional measures.
PERFORMANCE BY GROUP
NOTE that the charts show below represent performance “tracking,” that is, the oldest results since are simulated but the returns from 2013 are the systematic daily performance added day by day. Any changes to the strategies do not affect the past performance, unless noted. The system assumes 100% investment and stocks are executed on the open, futures on the close of the trading day following the signals. From time to time we make logic changes to the strategies and show how the new model performs.
Groups DE1 and WE1: Daily and Weekly Trend Program for Stocks, including Income Focus, DowHedge, Sector Rotation, and the New High-Risk Portfolio
The Trend program seeks long-term directional changes in markets and the portfolios choose stocks that have realized profitable performance over many years combined with good short-term returns. It will hold fewer stocks when they do not meet our condition and exit the entire portfolio when there is extreme risk or a significant downturn.
Equity Trend
Modest gains in both 10- and 30-stock portfolio give us good year-to-date returns, although now lagging behind both the S&P and Nasdaq. Both the S&P and Nasdaq have been driven by a few high-cap semi and software companies, while our portfolio has taken a more conservative approach with more “normal” diversification. Time will tell.

Income Focus and Sector Rotation
A continued small gain reflects the uncertainty of the interest rate markets. We would have expected them to be surging, but anticipation and uncertainty of Fed action has proved a stumbling block.

Sector Rotation
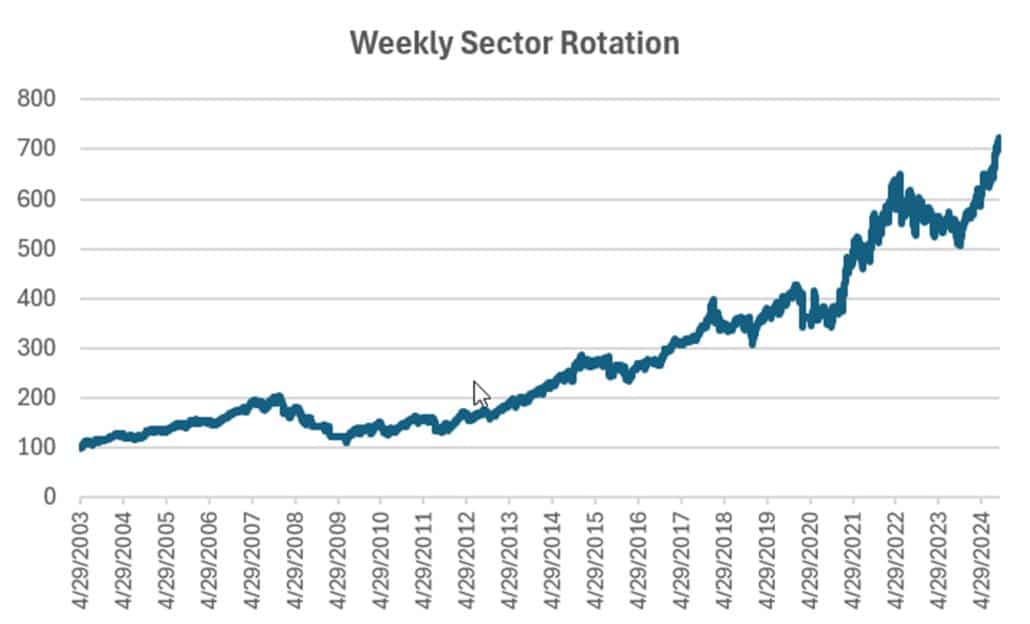
Gaining 2% in September brings the year-to-date to 26%, ahead of all other portfolios and well above the S&P and Nasdaq. This program rotated into real estate and out again into financials. It keeps holding Staples and Utilities.
DowHedge Programs
Both the Daily and Weekly DowHedge gained a bit over 1% and both are performing the same, up 12% for 2024. From the charts, the Weekly seems to be stronger.

High-Risk Portfolios
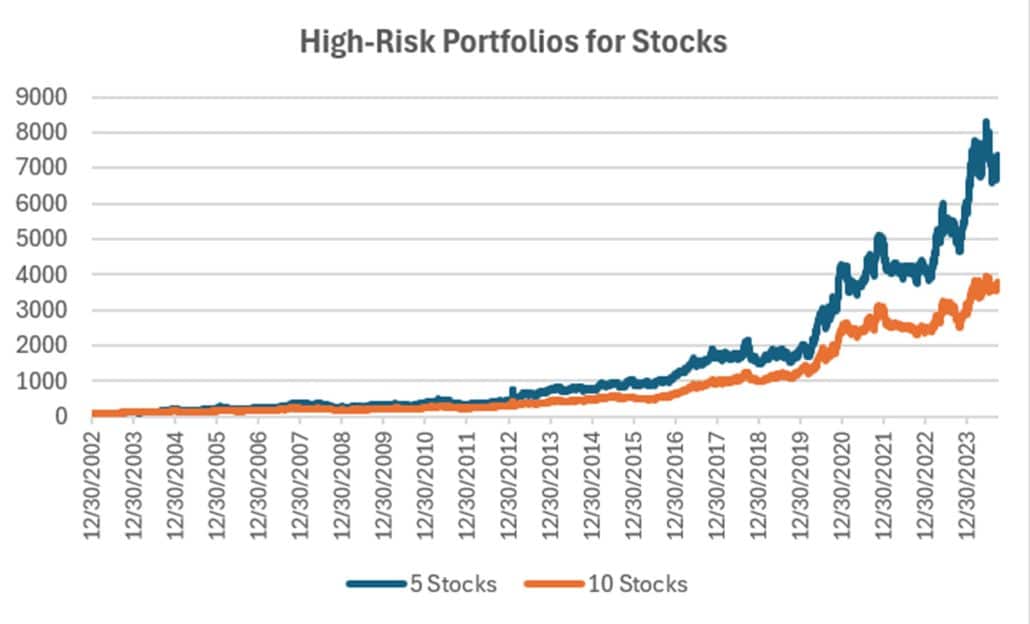
A better month for the High-Risk Portfolios, with the smaller 5-stock portfolio gaining 5.3% while the larger portfolio gained 1.8%. Both are over 20% for the year. The 5 stock portfolio is holding all the AI stocks, so it will be a good way to measure their movement.
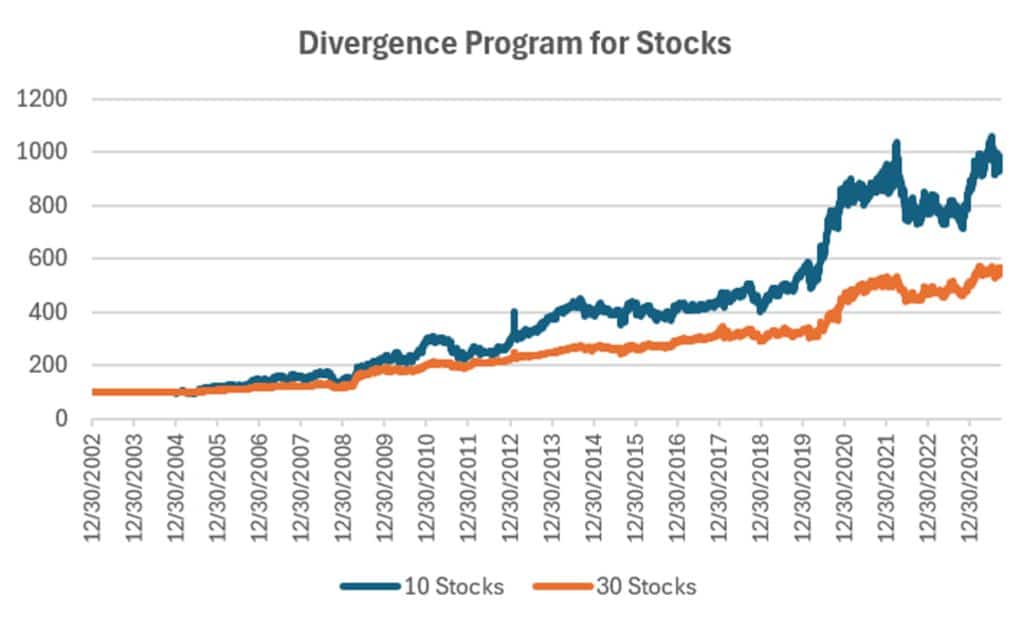
Group DE2: Divergence Program for Stocks
The Divergence program looks for patterns where price and momentum diverge, then takes a position in anticipation of the pattern resolving itself in a predictable direction, often the way prices had moved before the period of uncertainty.
Fractional loses for September, but both portfolios holding above 10%. This program needs a trend to capture the pauses. We’re still waiting!
Group DE3: Timing Program for Stocks
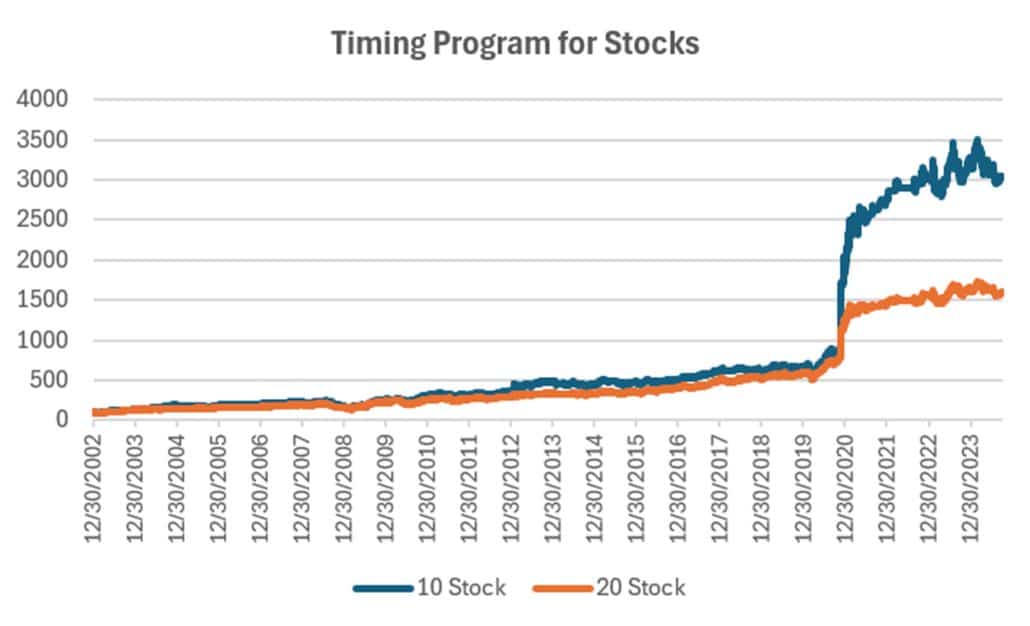
The Timing program is a relative-value arbitrage, taking advantage of undervalued stocks relative to its index. It first finds the index that correlates best with a stock, then waits for an oversold indicator within an upwards trend. It exits when the stock price normalizes relative to the index, or the trend turns down. These portfolios are long-only because the upwards bias in stocks and that they are most often used in retirement accounts.
Another month of mixed results caps a frustrating year-to-date loss for this system. It’s a classic pull-back in an uptrend. Unfortunately, that hasn’t happened yet. As interest rates decline, stocks should rally, setting up the right environment for this program to profit.
Futures Programs
Groups DF1: Daily Trend Programs for Futures
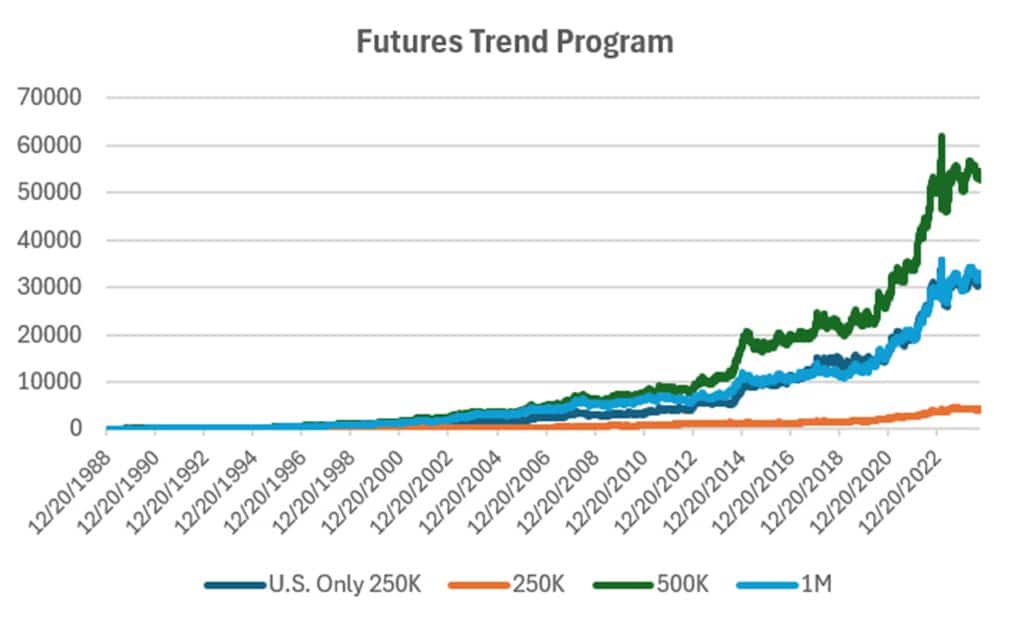
Futures allow both high leverage and true diversification. The larger portfolios, such as $1million, are diversified into both commodities and world index and interest rate markets, in addition to foreign exchange. Its performance is not expected to track the U.S. stock market and is a hedge in every sense because it is uncorrelated. As the portfolio becomes more diversified its returns are more stable.
The leverage available in futures markets allows us to manage the risk in the portfolio, something not possible to the same degree with stocks. This portfolio targets 14% volatility. Investors interested in lower leverage can simply scale down all positions equally in proportion to their volatility preference. Note that these portfolios do not trade Asian futures, which we believe are more difficult for U.S. investors to execute. The “US 250K” portfolio trades only U.S. futures.
Small gains in all but the $500K portfolio, and modest year-to-date gains. We thought that the interest rates would have contributed to a gain by now, but we have been long and short and long trying to find the right trend. With lower U.S. rates, we are now short the dollar and long interest rates. That seems like the right positions, but the market has been fickle.
Group DF2: Divergence Portfolio for Futures
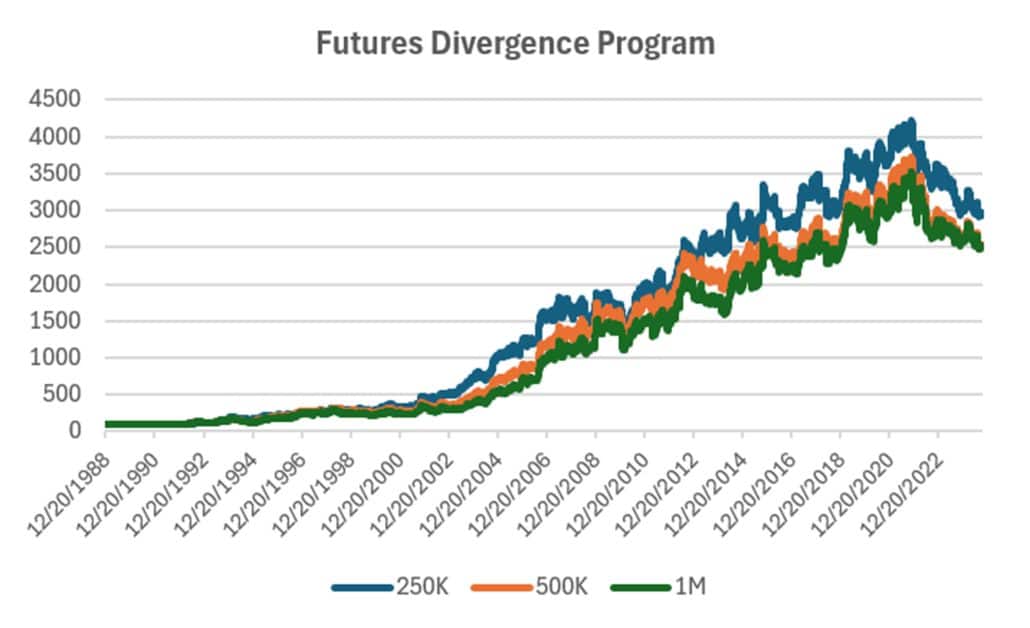
Small gains in all portfolios for September. The smallest $250K is ahead by 9% while the larger portfolios are lower for the year. This program uses the same logic as the Equity Divergence, and both are having the same issues – no trend to work with!
Blogs and Recent Publications
Perry’s books are all available on Amazon or through our website, www.kaufmansignals.com.
September 2024
Two articles posted by Perry, “The N-Day or the Swing Breakout,” (Technical Analysis of Stocks & Commodities) looking to see which is better. You would be surprised.
A look at deleveraging Artificial Intelligence stocks, a shorter version of the article posted in our “Close-Up” section. It appeared in Seeking Alpha earlier in September.
August 2024
“Theory Versus Reality” was published in the August issue of Technical Analysis of Stocks & Commodities. It discusses price shocks, diversification, predicting performance, and more.
July 2024
Perry posted a new article on Seeking Alpha, “Capturing Fund Flows.” It a good strategy for someone that wants to add some diversification. It only trades 3 days each month!
June 2024
Perry was interviewed on June 27th by Simon Mansell and Richard Brennan at QuantiveAlpha (Queensland, Australia), a website heavy into technical trading. It should be posted in a week or so.
“Trading Extreme Gaps and Extreme Closes” looks at daily patterns in stocks, published in the June edition of Technical Analysis.
May 2024
In the April edition of Technical Analysis, Perry again deals with risk in “How Professional Assign Risk.” It is another chapter in how to protect yourself.
April 2024
Another article in the April edition of Technical Analysis, “Determining Risk Before It Happens.” Perry thinks this is an article everyone should read.
March 2024
In the 2024 Bonus Issue of Technical Analysis, Perry has an article, “Pros and Cons of Daily Versus Weekly Trend Following.” There is also a quote by him in the “Retrospective: Interviews” going back to April 1988.
Perry also posted an article on Seeking Alpha, “How To Exit a Trade.” A good reminder of the choices.
February 2024
Perry published an article on using the backwardation and contango in crude oil in “The Delta-Delta Strategy.” If not crude, the you might think of this for any commodity, including interest rates, that have a consistent term structure.
January 2024
A new article in February edition of Technical Analysis of Stocks & Commodities, “Crossover Trading: Arbitrating the Physical with the Stock.” A chance at diversification!
Perry posted 3 new articles on Seeking Alpha in December, “Where Do You Take Profits?”, “Is There a Better Day to Enter the Market,” and “Watching January Returns.”
Another article in Technical Analysis of Stocks & Commodities, “Gap Momentum,” another interesting way to identify the trend.
December 2023
Perry posted 3 new articles on Seeking Alpha, “Where Do You Take Profits?”, “Is There a Better Day to Enter the Market,” and “Watching January Returns.”
This month Technical Analysis of Stocks & Commodities published “A Strategy For Trading Seasonal and Non-Seasonal Market.” Turns out that most markets are non-seasonal!
November 2023
Perry posted two articles on Seeking Alpha, “Compression Breakout: Giving a Boost to Your Entries,” and “Volatility: The Second Most Important Indicator.” In addition, he interviewed Herb Friedman in Technical Analysis of Stocks & Commodities. Herb is a interest rate specialist focusing on low risk investments.
October 2023
In this month’s Technical Analysis of Stocks & Commodities Perry shows how Merger Arb works and how an investor can participate in it. Merger Arb has been the realm of Institutions, but there are opportunities for everyone.
Older Items of Interest
On April 18th, 2023, Perry gave a webinar to the Society of Technical Analysts (London) on how to develop and test a successful trading system. Check their website for more details, https://www.technicalanalysts.com..
Perry’s webinar on risk, given to the U.K. Society of Technical Analysts, can be seen using the following link: https://vimeo.com/708691362/04c8fb70ea
For older articles please scan the websites for Technical Analysis of Stocks & Commodities, Modern Trader, Seeking Alpha, ProActive Advisor Magazine, and Forbes. You will also find recorded presentations given by Mr. Kaufman at BetterSystemTrader.com, TalkingTrading.com, FXCM.com, systemtrade.pl, the website for Alex Gerchik, Michael Covel’s website, TrendFollowing.com, and Talking Trading.com.
You will also find up to six months of back copies of our “Close-Up” reports on our website, www.kaufmansignals.com. You can address any questions to perry@kaufmansignalsdaily.com.
© September 2024, Etna Publishing, LLC. All Rights Reserved.
