
Industry Benchmark Performance
Marginal gains for equities and marginal losses for futures seems to be a continuation of the first half of the year. Overall, the industry did better than our programs in July, but our year-to-date is still doing well.
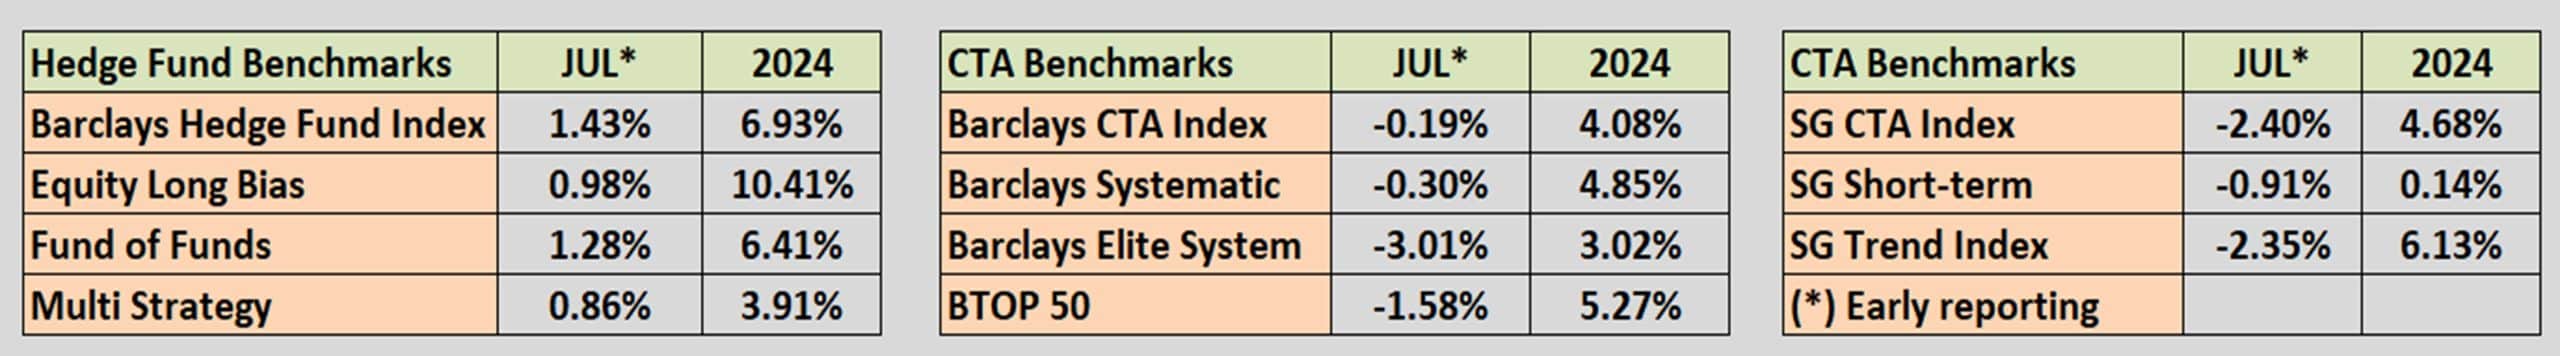
Source: BarclayHedge Indices.
Kaufman’sMost Popular Books (available on Amazon)
Trading Systems and Methods, 6th Edition. The complete guide to trading systems, with more than 250 programs and spreadsheets. The most important book for a system developer.
Kaufman Constructs Trading Systems. A step-by-step manual on how to develop, test, and trade an algorithmic system.
Learn To Trade. Written for both serious beginners and practiced traders, this book includes chart formations, trends, indicators, trading rules, risk, and portfolio management. You can find it in color on Amazon.
You can also find these books on our website, www.kaufmansignals.com.
Blogs and Recent Publications
Find Mr. Kaufman’s other recent publications and seminars at the end of this report. We post new interviews, seminars, and reference new articles by Mr. Kaufman each month.
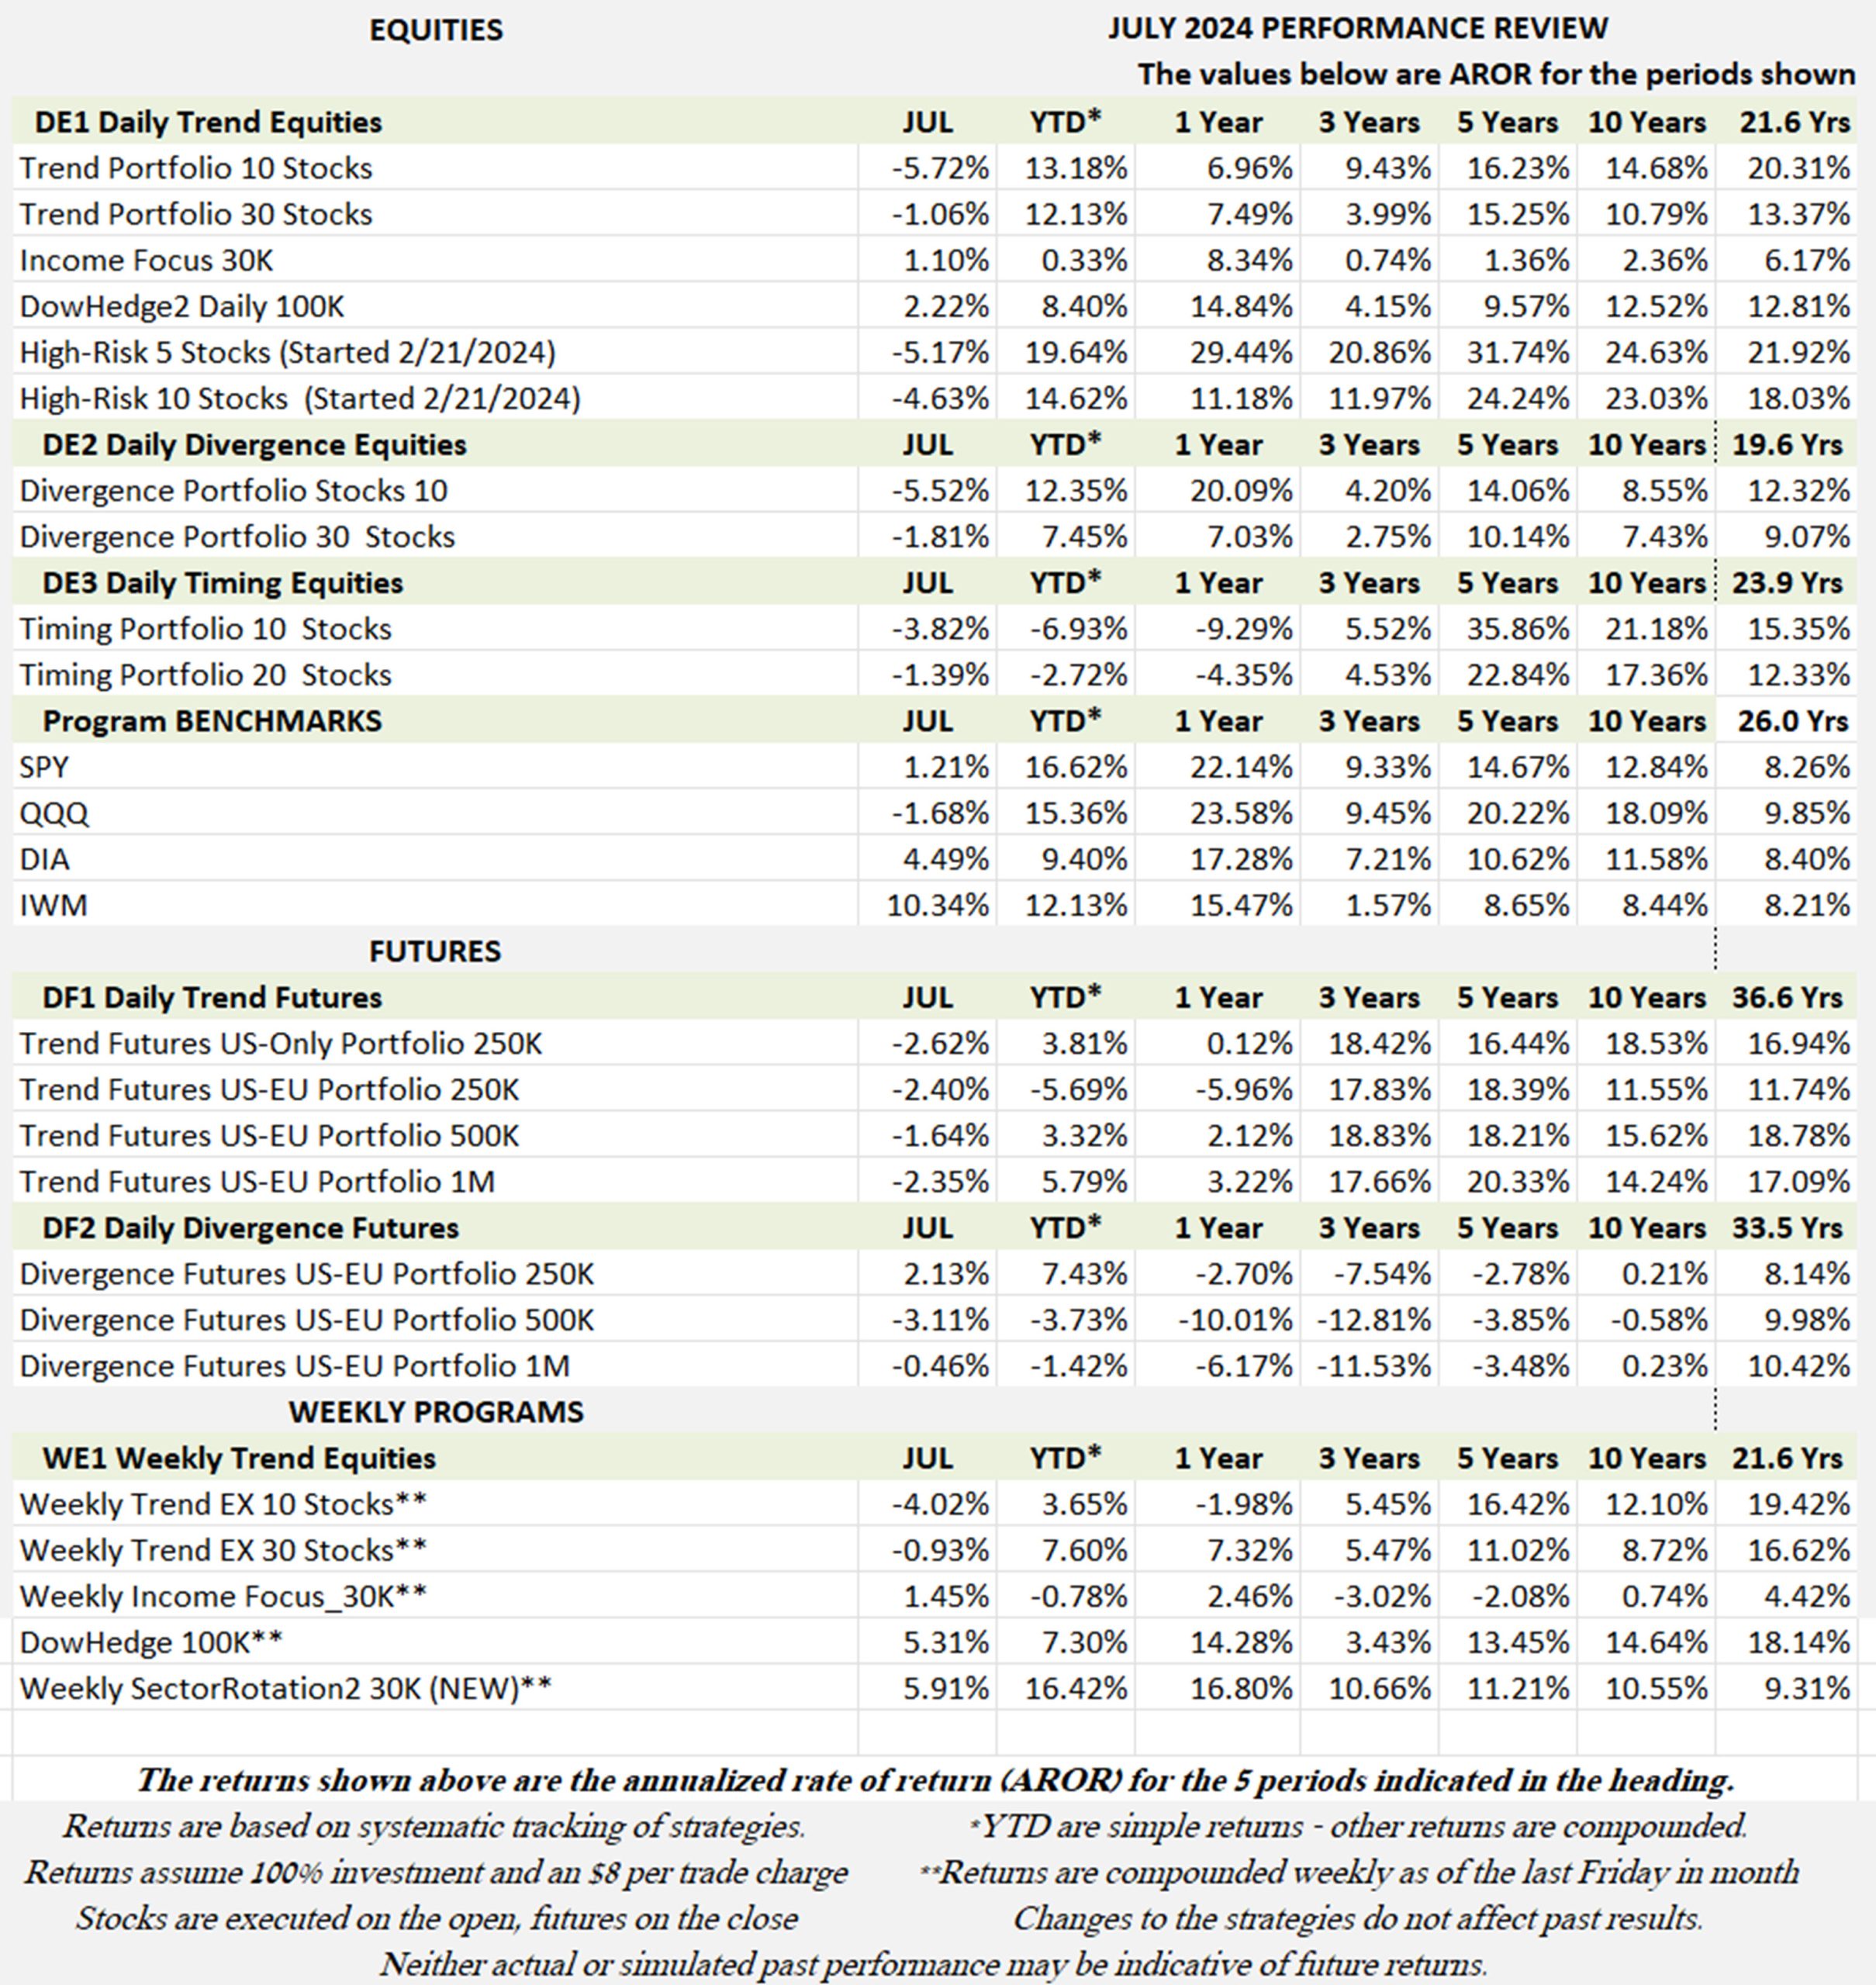
July Performance in Brief
Losses in most programs due to erratic prices, failed anticipation of the Fed policy, and a precipitous decline in semiconductor and AI stocks. Uncertain economic policy makes this a difficult market.
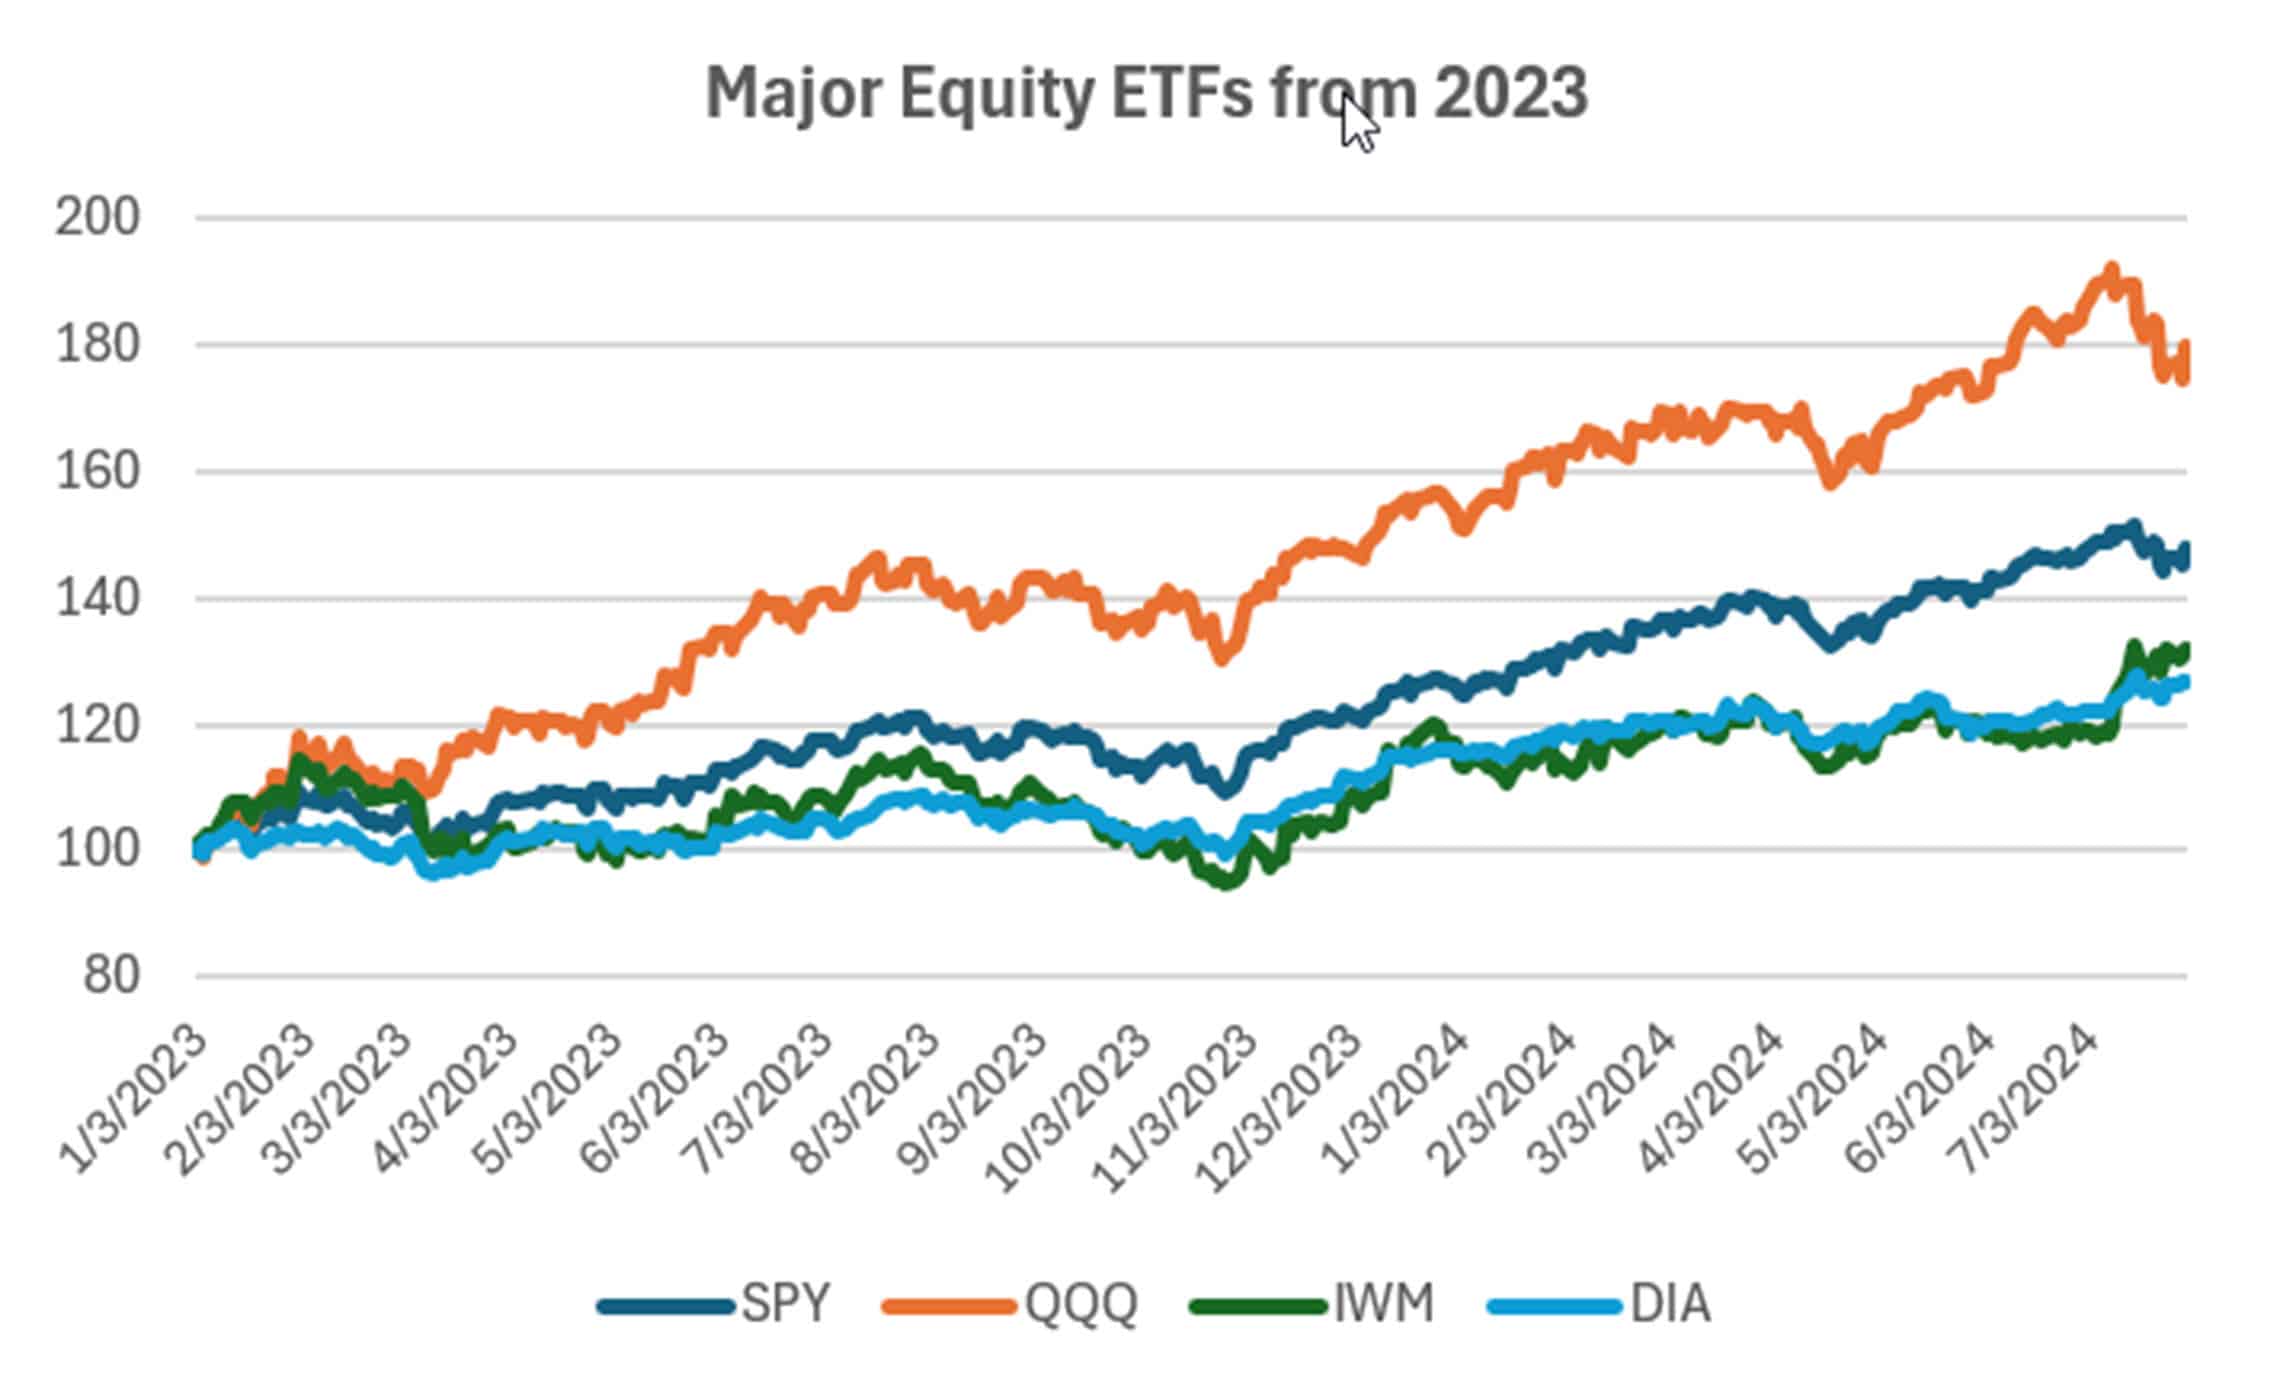
Major Equity ETFs
An odd move with the S&P and Nasdaq declining while the Dow and small caps rise. But then Nasdaq has been strong based on semiconductors and AI users. That seems to be fading, even though it’s not going away. So far, it’s a normal retracement. If the Fed lowers rates, it’s likely to turn around.
CLOSE-UP: Comparing Market Performance
There is a lot of competition for investment dollars (or euros and yebn), electric cars, semiconductors, interest rates, and index markets. Which are the best to trade? I’ll go through a list of alternatives to see if we can find the best. It is always a good idea to look at the charts. A picture tells a lot. In the case of stocks, it’s about volatility, Chinese competition, and the U.S. Economy.
We will also compare index markets and interest rates to see which countries are likely to give the best returns for the risk.
Electric Cars
Is China now the leading manufacturer of electric cars? Are they making inroads into Europe? We may not be able to buy BYD stock (BYDDY), but it may tell us a lot about Telsa competition. If we start from 2019, when Tesla started its move up, we can see in Figure 1 that Tesla stock peaked in 2022, two years ago. Does that make it a worse investment than other electric car companies?
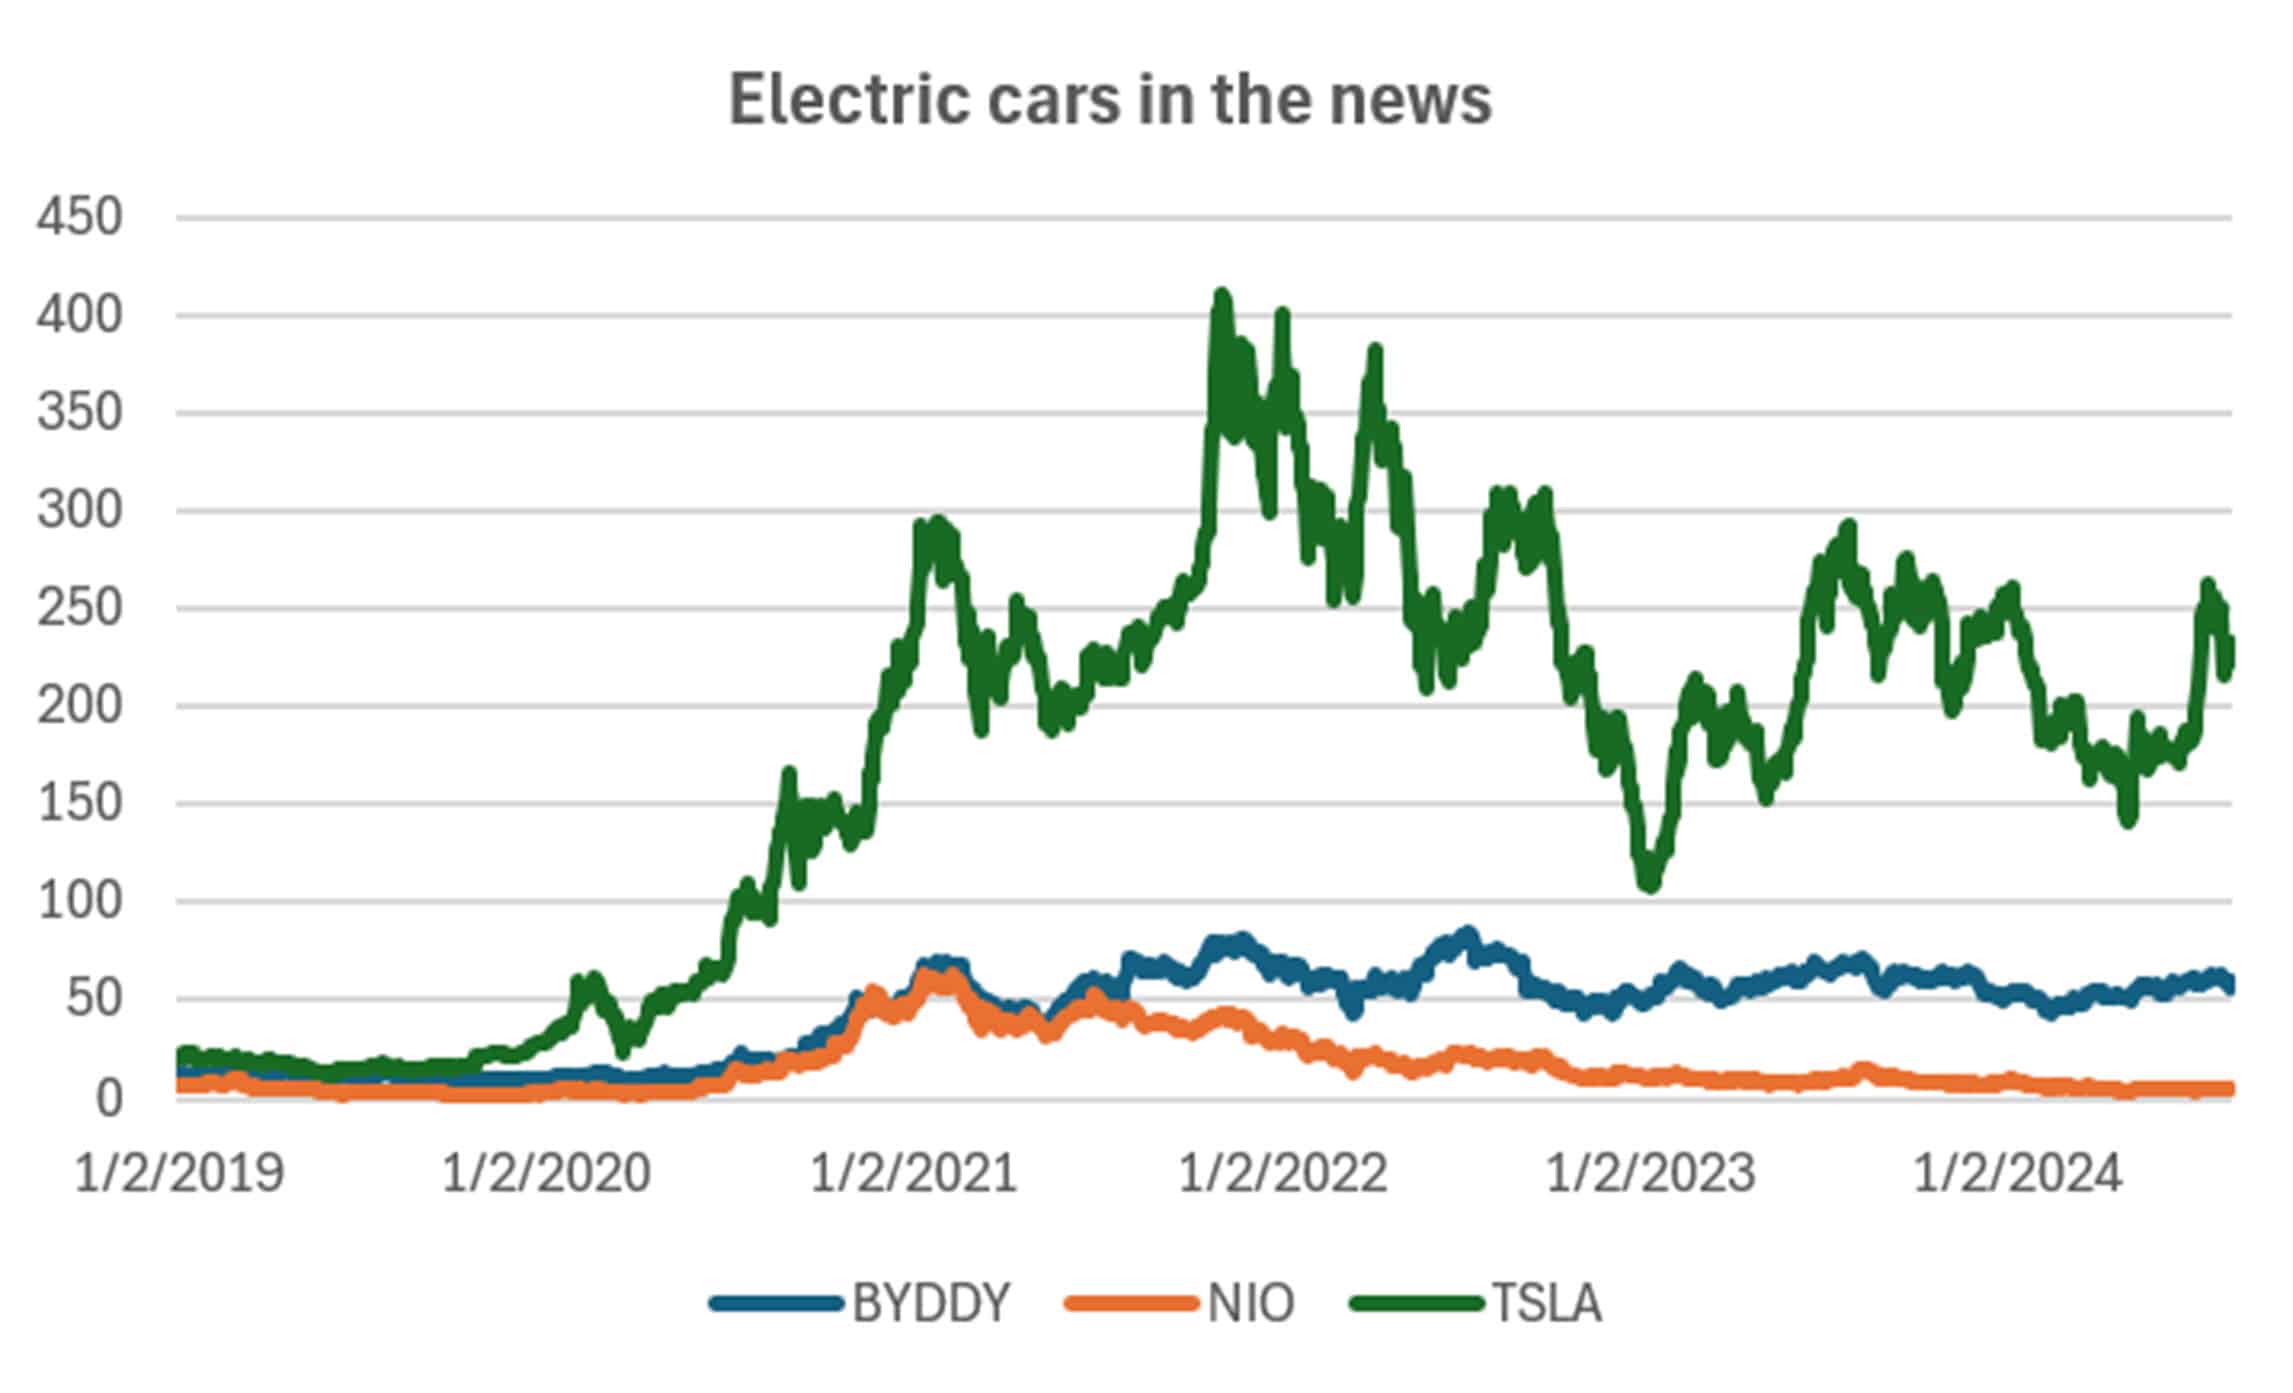
Figure 1. Electric cars. (Source: CSI and Yahoo Finance)
Nio, once thought to be a U.S. competitor, has not lived up to expectations. While there are other contenders (such as Rivian, and all the other major car companies), investing in electric cars may not be the best way to produce excess profits. Competition is keen, and buyers have found that the resale price is weak and recharging makes it difficult to take the car on a long drive. The tendency at the moment, is to revert to hybrids. I don’t see any of these markets as having much potential.
From 2019, when the industry gained traction, BYD has gained 32% annually, but mostly through 2020. TSLA is higher by 52%. Both have extremely high volatility, as you can see in the chart. My suggestion is that you look at General Motors and Toyota, with a wide range of model, rather than focusing on electric only.
On-Line Retailers
How is China’s Alibaba doing compared to Amazon? We know that Walmart has a good online presence, but let’s just compare Alibaba and Amazon. Personally, I bought BABA just after the IPO, thinking that it could surge, much like Google. I was disappointed and got out shortly after.
The Chinese economy has been in a slump (see Figure 10 at the end), and while AMZN recovered after 2022, BABA has not. BABA is now back to its IPO price, while AMZN has had an annualized return of 23% but with volatility of 33%. Not a steady move, but better than the S&P. Again, we see that investing in Chinese stocks would have been disappointing. You also need to be careful of sudden shifts in Chinese economic policy. If you are going to trade AMZN, you’ll want to reduce your position by half to bring volatility in line with an acceptable risk.
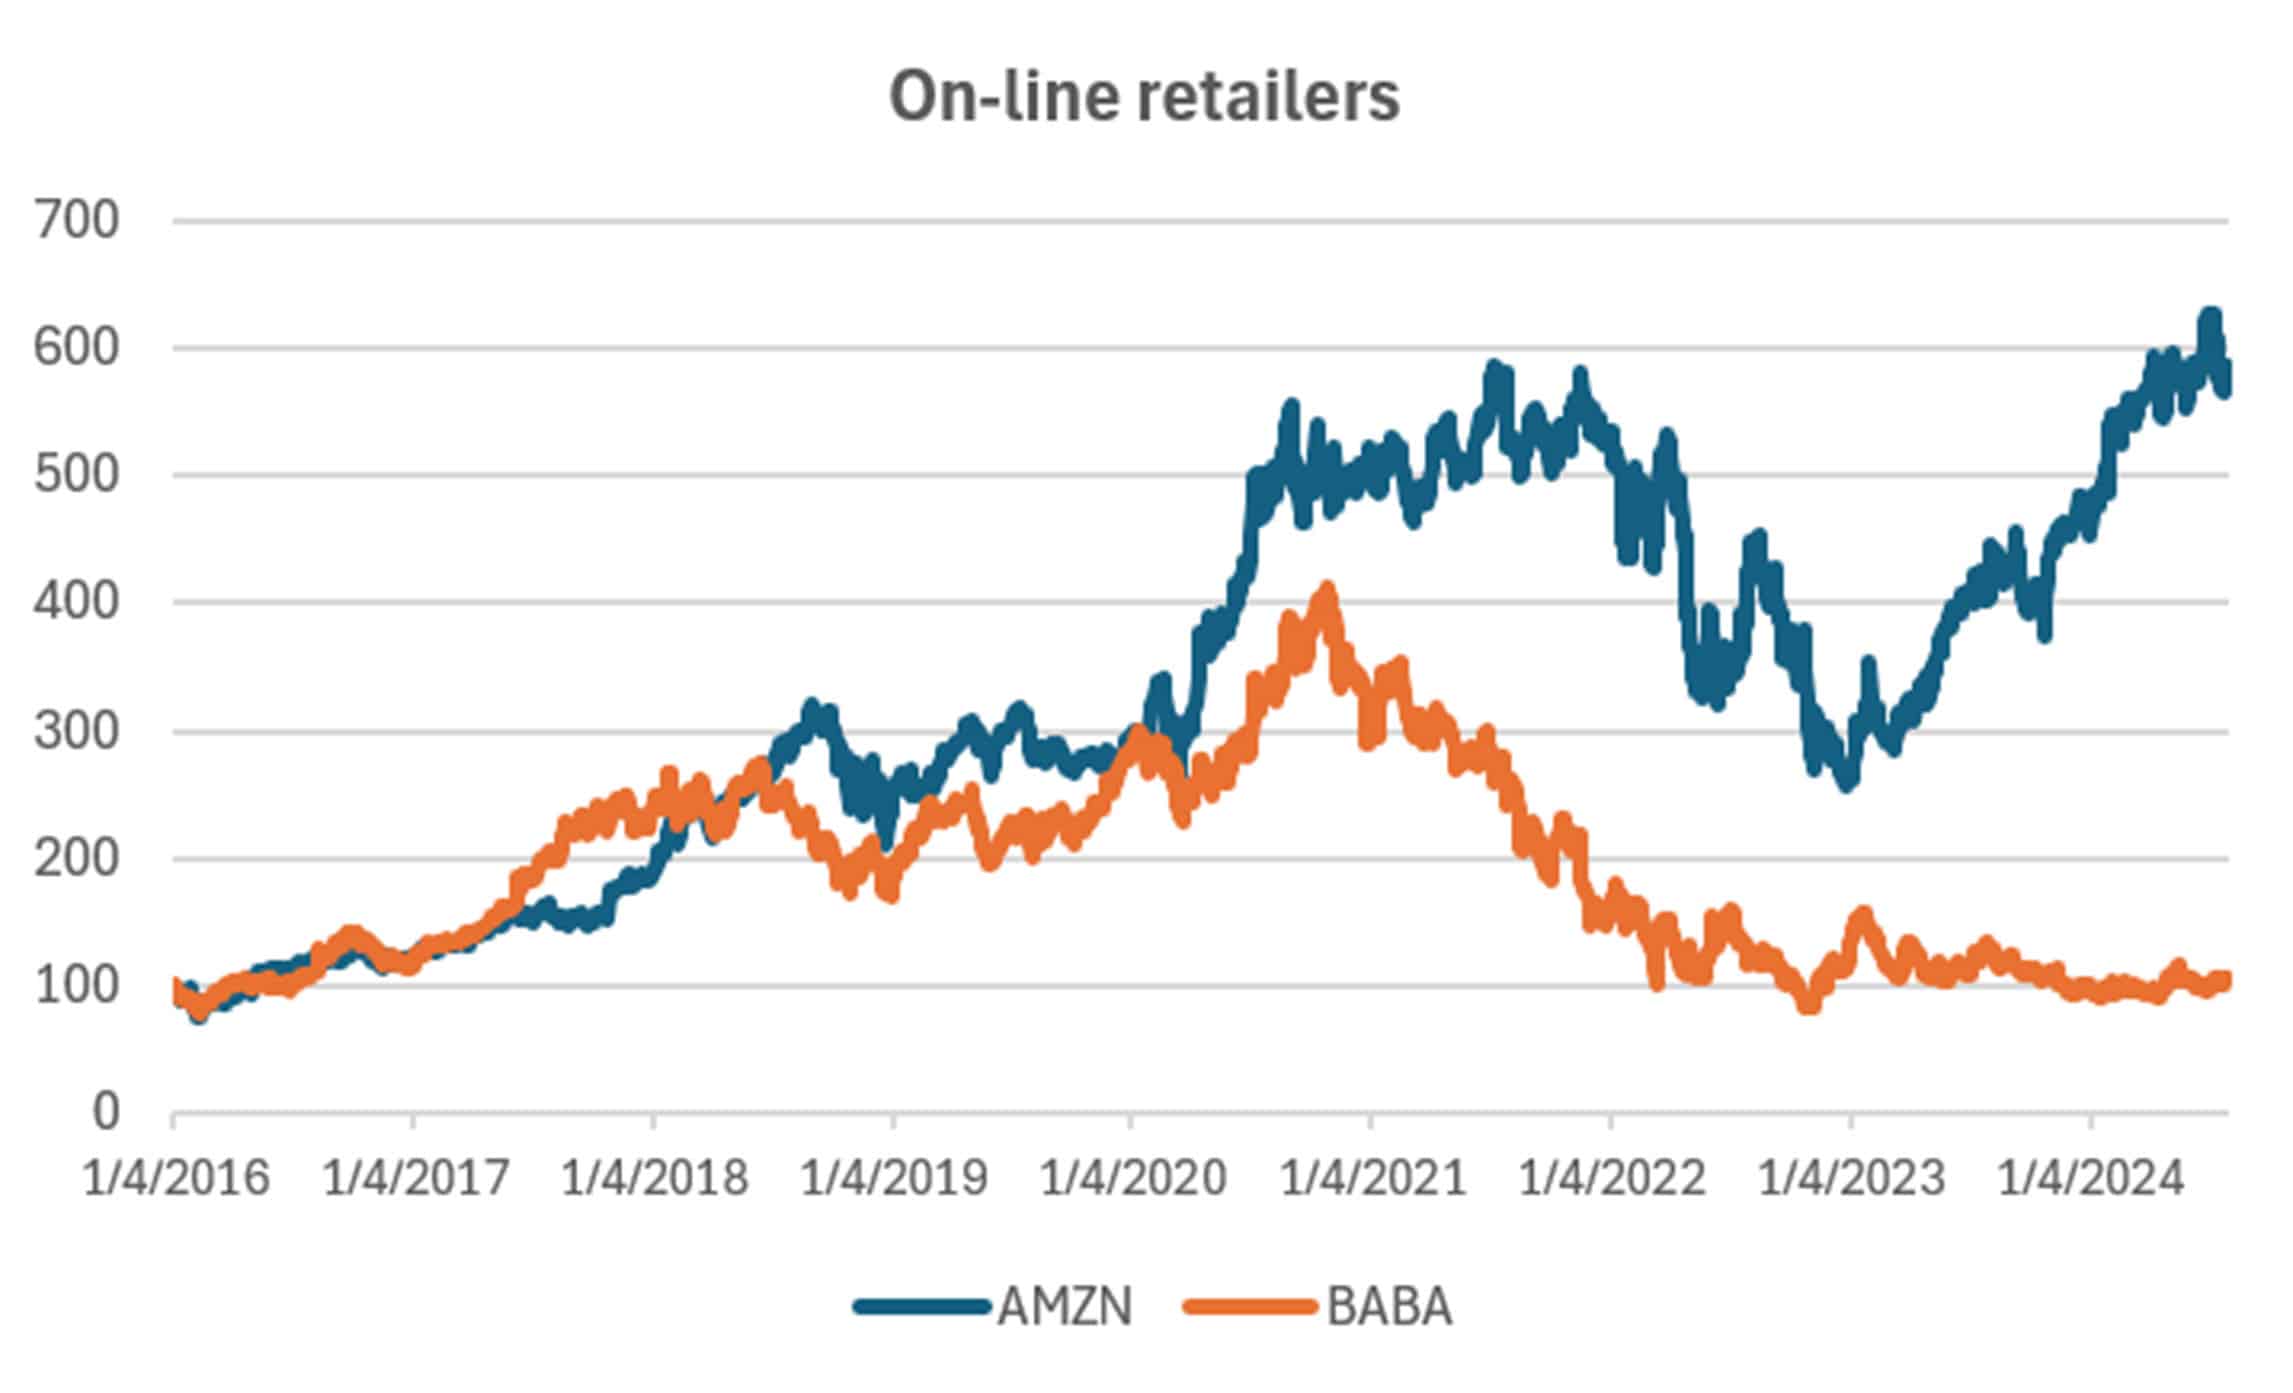
Figure 2. On-Line Retailers (Source: CSI)
Semiconductors
Nvidia has been the leading player in the semiconductor market, creating chips that have helped spur on the artificial intelligence phenomenon. However, the initial enthusiasm may be fading. That is not to say that it has disappeared. The initial comments that “this changes the world,” may not be quite there yet.
As with Tesla, success comes with competition. So far, the likely rival is Broadcom (AVGO), although it is lagging behind. Intel (INTC) is another competitor, also lagging. Taiwan Semiconductor (TSM) is the foundry that produces the chips, and has moved higher with Nvidia, although at a subdued level.
Figure 3 shows the prices of INTC, NVDA, TSM, and AVGO. Investors have taken NVDA to a remarkable level, a return of 89% annualized since 2019, that’s double the returns of AVGO at 44%. Remember that volatility can be dangerous. NVDA volatility is 52%, about 4 or 5 times the safe volatility used by funds. AVGO has a volatility of 38%. Most investors should not go above 14%, so scaling size is going to be necessary. Both NVDA and AVGO are good candidates for trading, as long as you understand and account for the risk. TSM has a return of 34% with volatility of 36%, not quite as good, but still a good candidate.
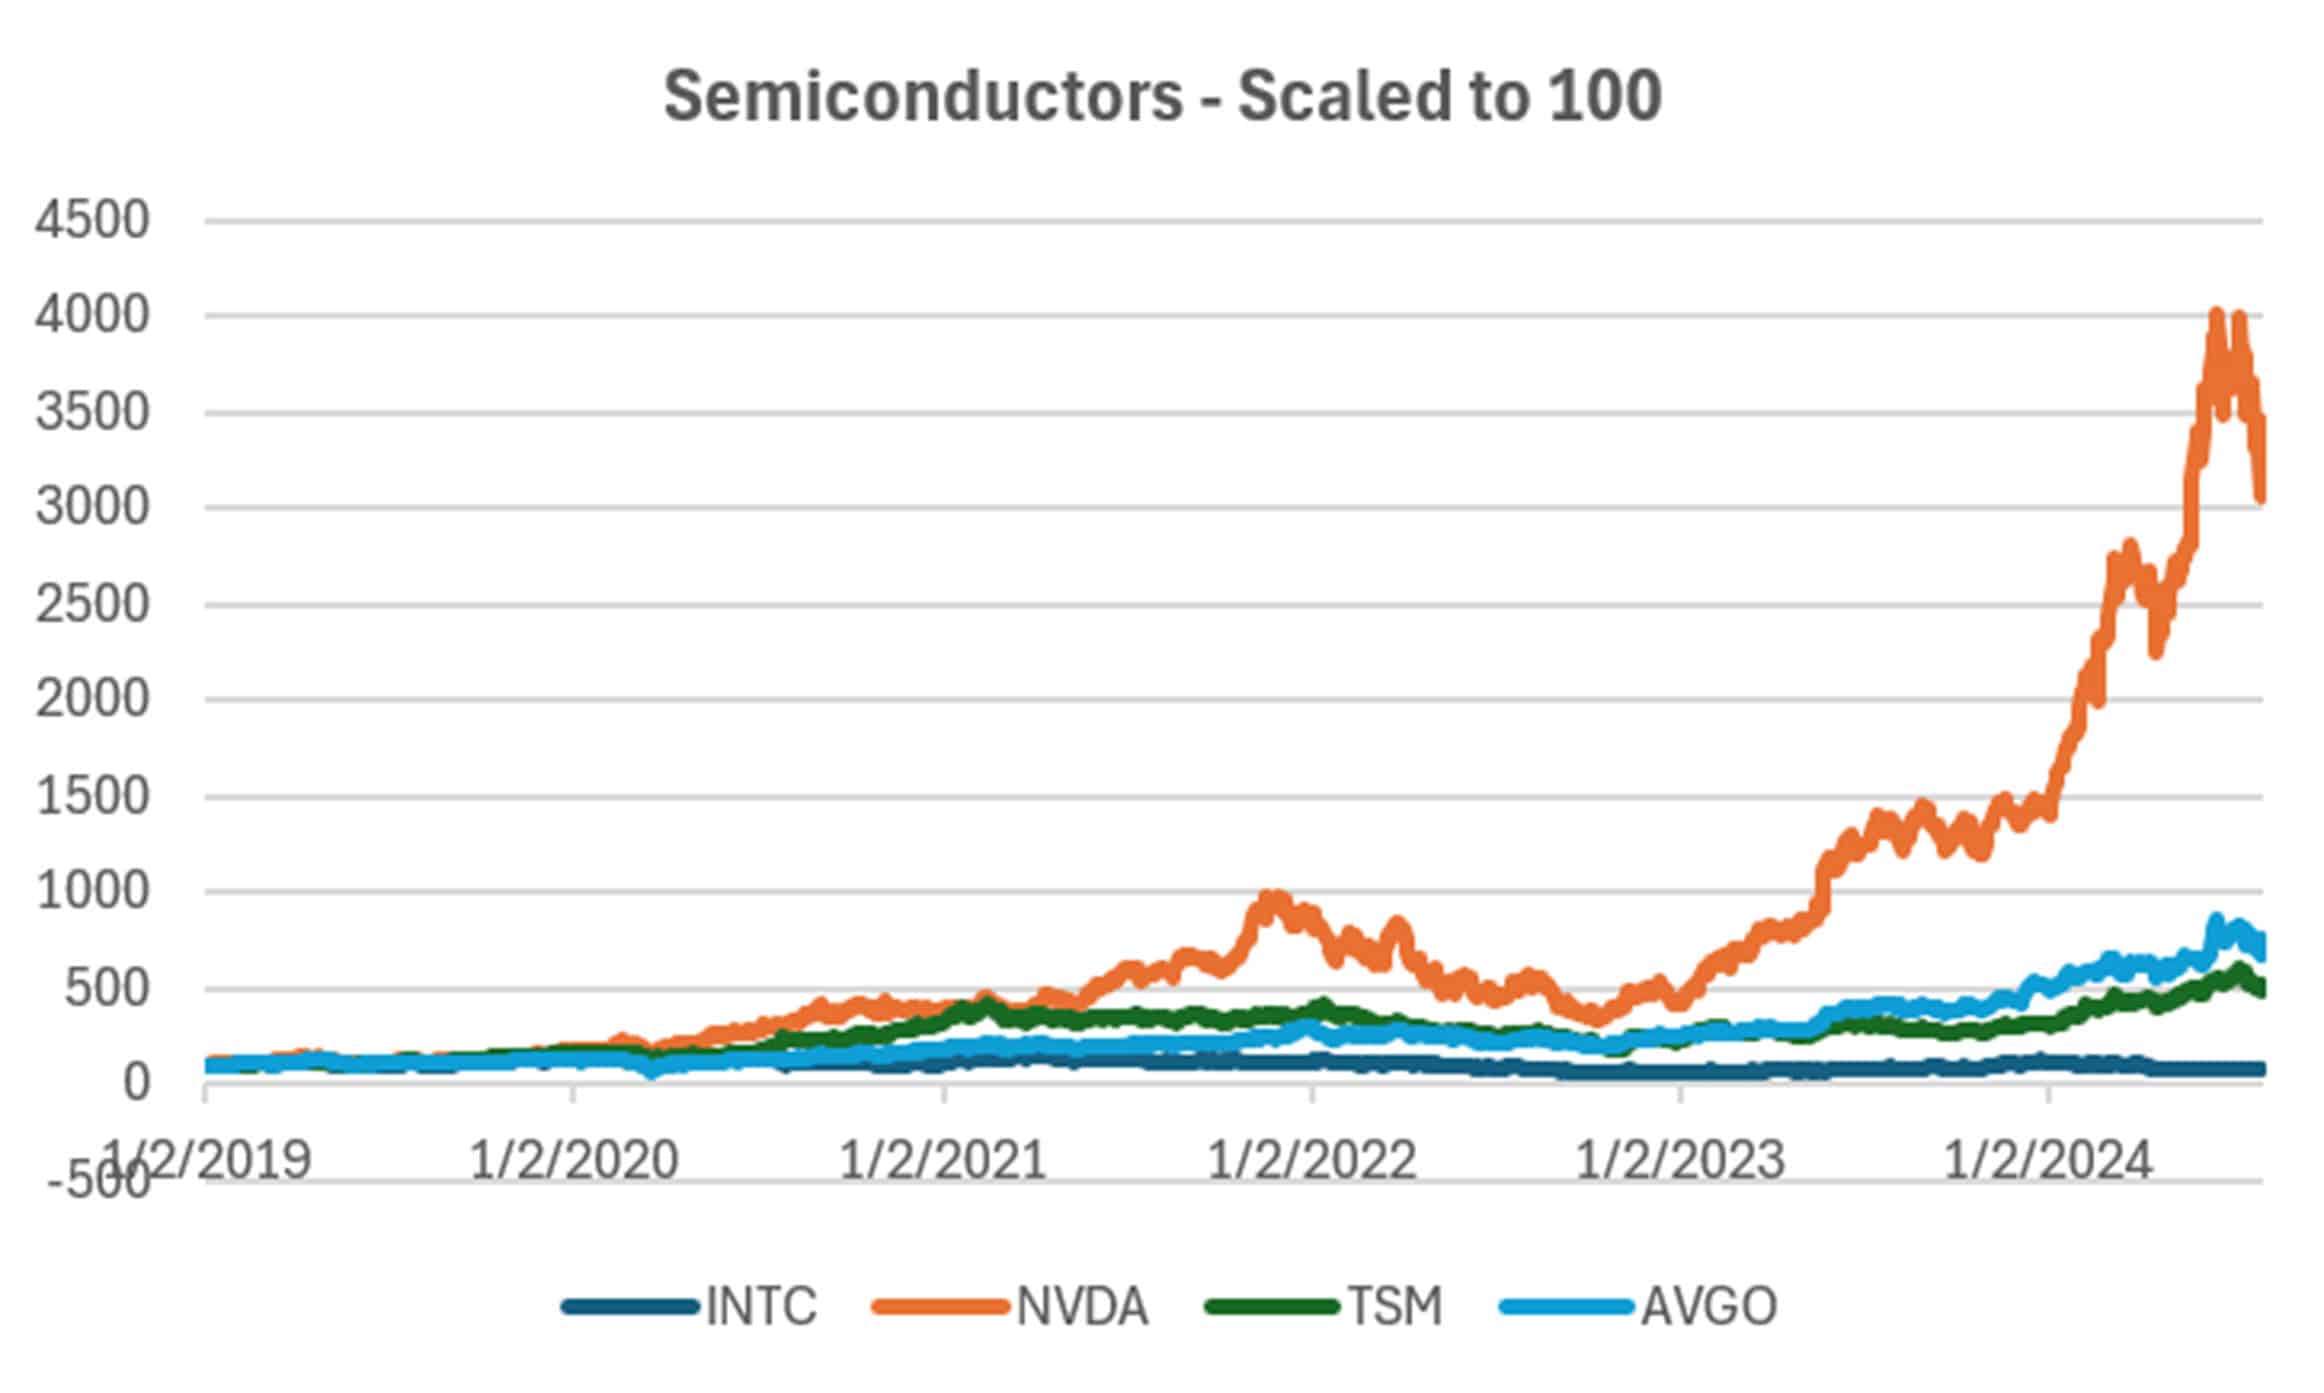
Figure 3. Semiconductor stocks from 2019, scaled to 100. (Source: CSI)
Pharmaceuticals
Pharmaceutical stocks paint an interesting picture. During COVID, which showed its effects in 2020, Pfizer and Moderna were the favored vaccines. Yet Moderna soared while Pfizer did little. The Covid vaccine comprised most of Moderna’s revenue while it was only a small part of Pfizer.
Figure 4 shows why Lilly is now the best investment. Lilly has similar annualized returns, 42%, as does Moderna, at 45%, but Lilly has a volatility of 31% to Moderna’s 73%. Reducing the Lilly position to ½ brings the volatility back to 15.5% with a return of 21%, a good candidate for a portfolio. The chart shows Merck with a gain of 9% and volatility of 23%, and Pfizer with a negative return (but a good vaccine!).
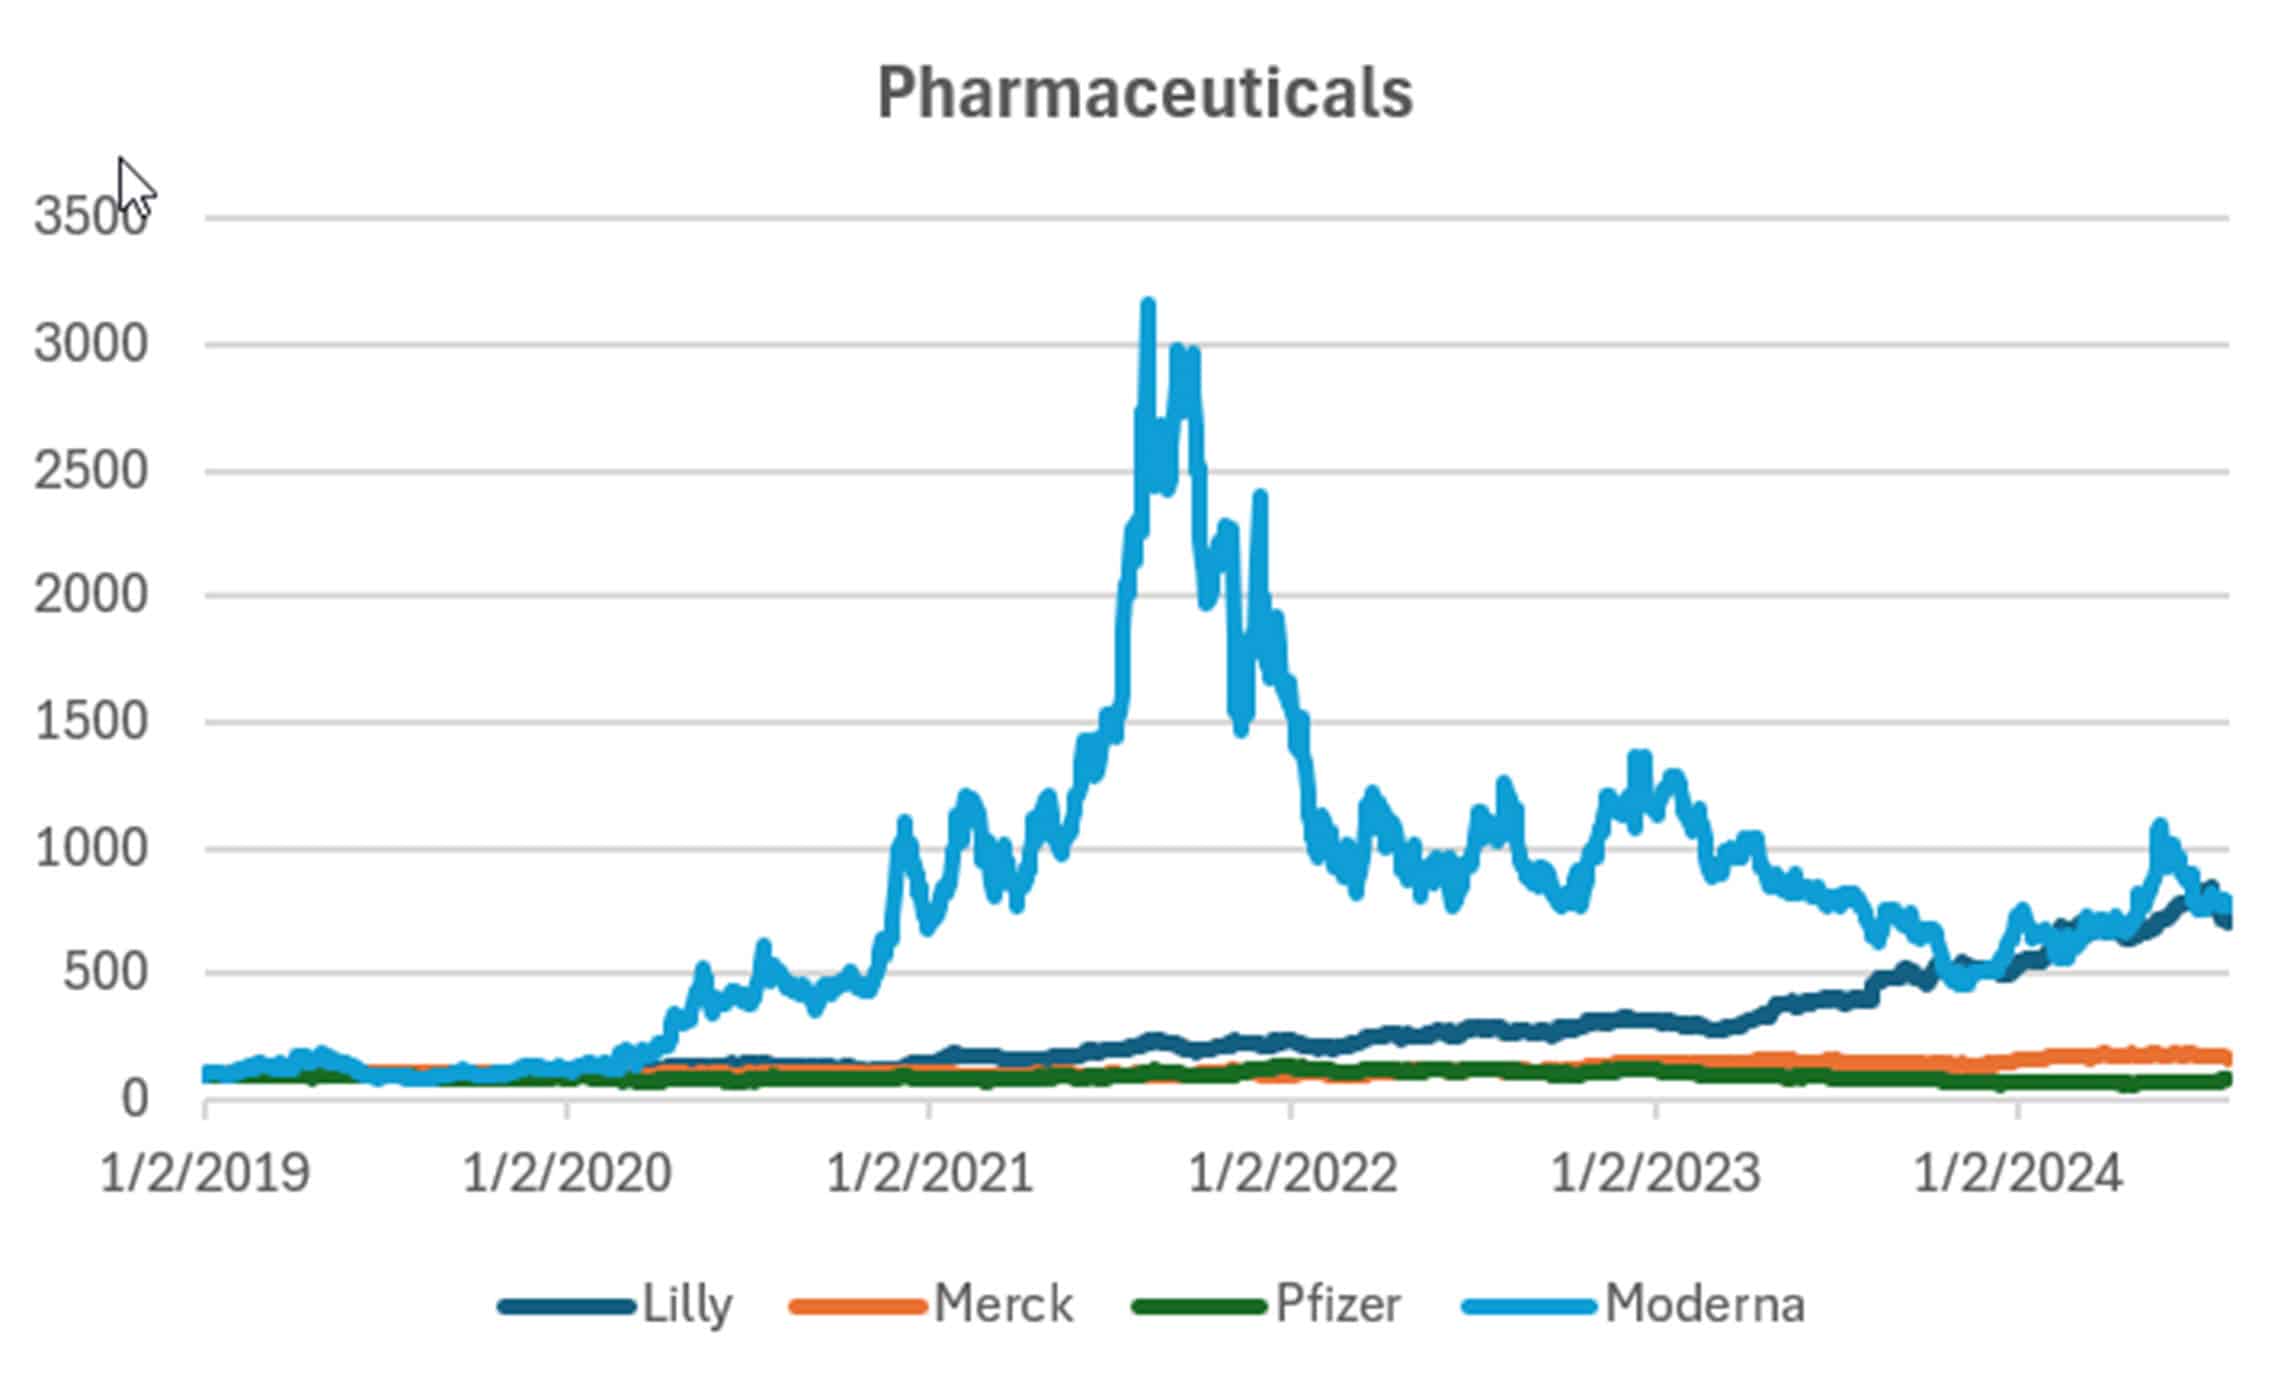
Figure 4. Pharmaceuticals from 2019. (Source: CSI)
Interest Rates
If we look at the three major regions of the world, the U.S., Europe, and Asia, we can see the long-term interest rate picture in Figure 5. Rates have declined, essentially since 1980 although this chart starts in 1990.
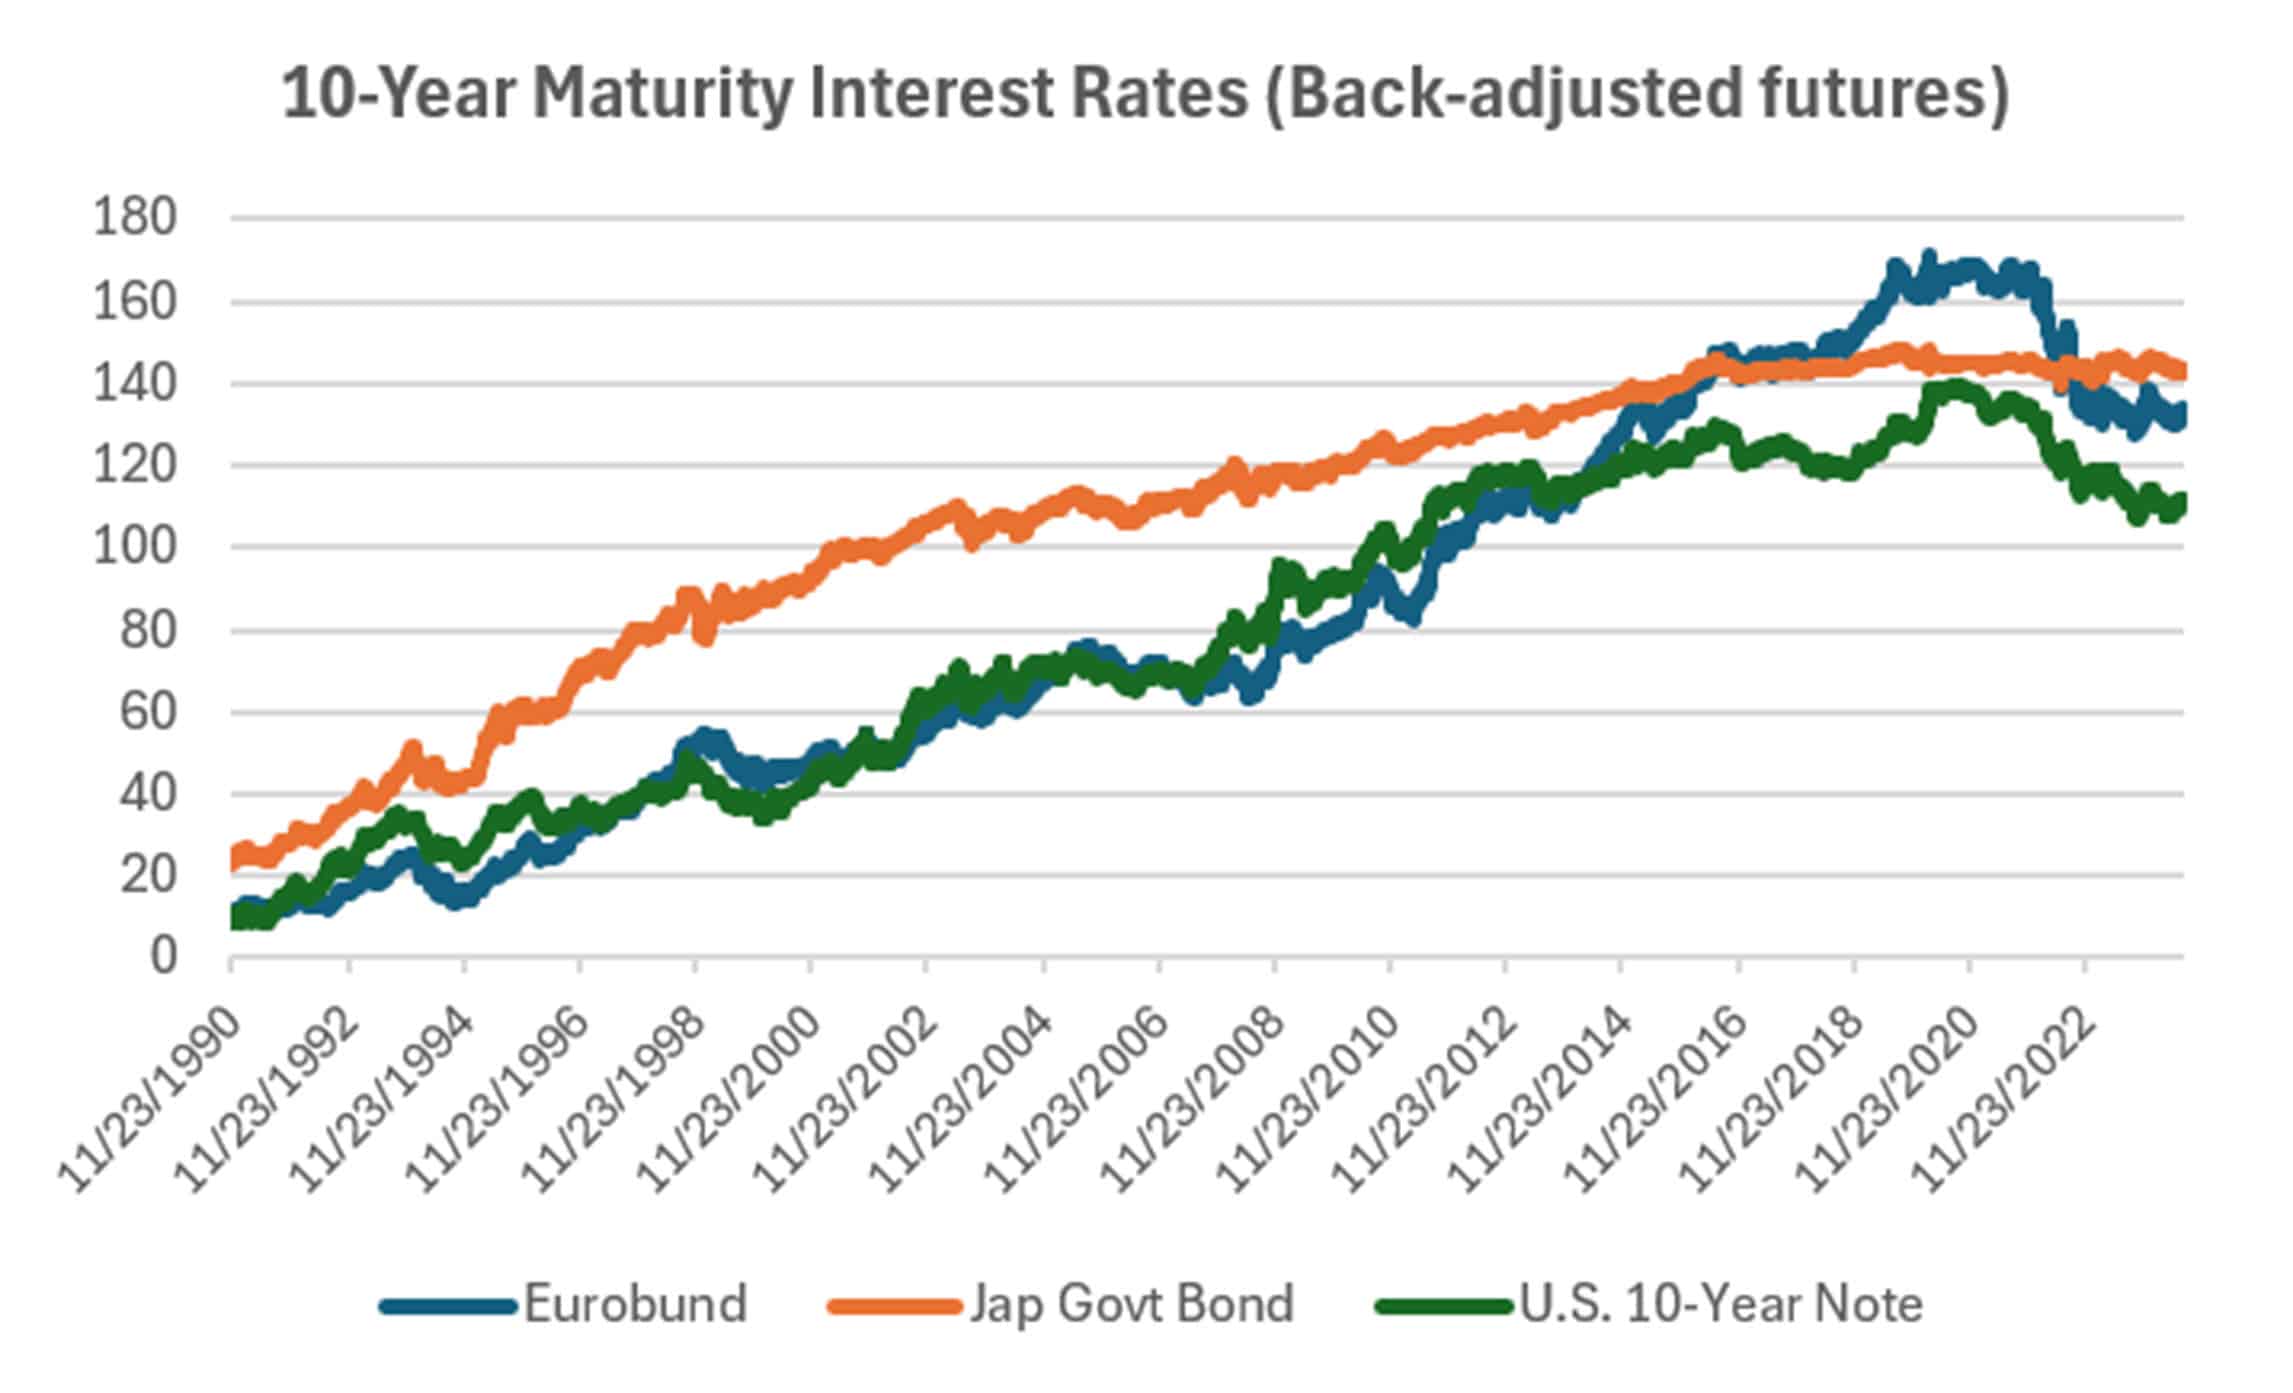
Figure 5. History of interest rates. Back-adjusted futures nearest month. (Source: CSI)
Interest rate trading has been the benchmark of most futures funds. Some have 50% of their liquidity in interest rates. They tend to be smooth and predictable. In our own programs we only trade rates on the long side, that is, expecting yields to go down.
How do we decide how to trade interest rates? Using back-adjusted futures, we can test a simple moving average. The results appear in Figure 6. The good news is that every trend calculation period is profitable for all rates. By looking at the average results, we can get an idea of which of the three rates can have the best return and the lowest risk. These results are long-only. Short-sales tend to be erratic and any gains are eventually offset by losses.
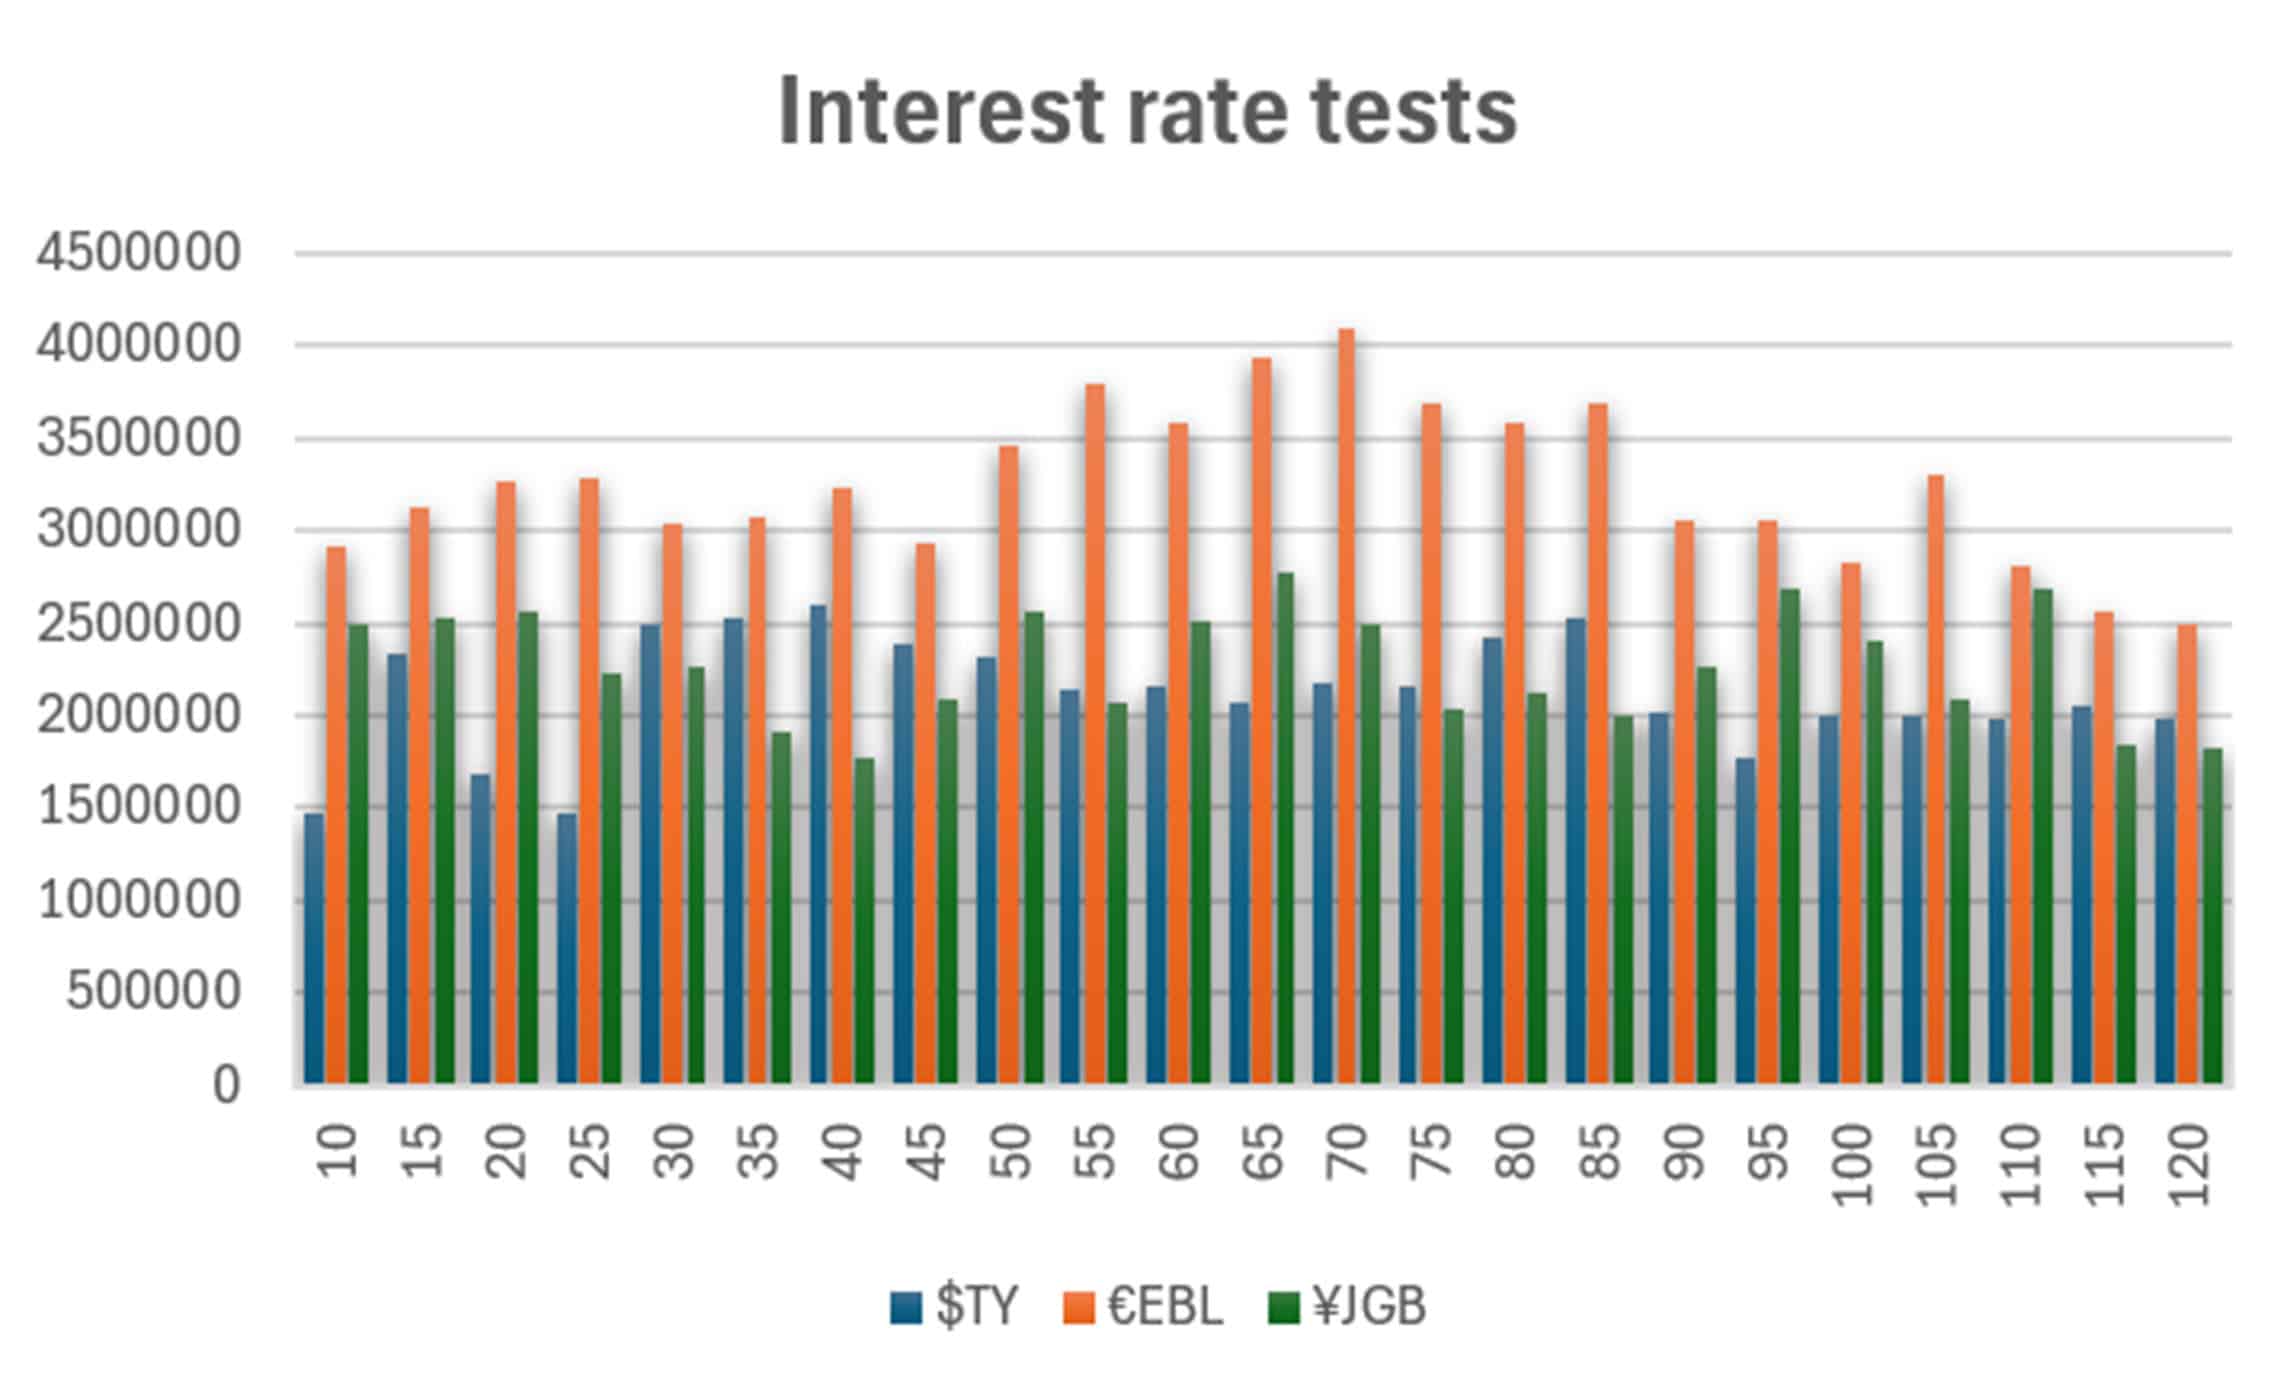
Figure 6. Tests of the U.S. 10-year note (TY), the Euro long bund (EBL) and the Japanese Govt Bond (JGB). Each result is in local currency.
The outstanding results are the Eurobund, the orange bar in Figure 6. I know it looks as though the JGB is the smoothest, but that doesn’t produce the best trending returns. Given that the euro is stronger than the dollar, those results would be higher. For the yen, the results would be lower against the dollar. The average of all tests were $2,120,610, €3,253,333, and ¥2,271,130. The Eurobund is clearly the best market to trade. When trading the Japanese markets, we need to be careful of frequent intervention. At the moment, the yen is weak, so intervention would be to strengthen the yen. This could cause the Japanese stock market to decline.
Index Markets
Nearly all countries have index markets that are traded as futures. It would be difficult to show them all, so I’ll select a few. We will do the same tests as interest rates, looking for the most stable results based on a moving average system. As with rates, these results are long-only and in local currencies. While there are periods of declines, very few traders make money on short sales.
U.S. and European Index Markets
The U.S. index markets are the most liquid, but not always the best for trading. In Figure 7 we see that Nasdaq has the best returns, followed by the S&P. The DAX and EuroStoxx, to the right of Nasdaq, will be a bit higher if we converted to U.S. dollars. The DAX is consistently profitable, and Europe has different economic dynamics, so trading both could offer diversification.
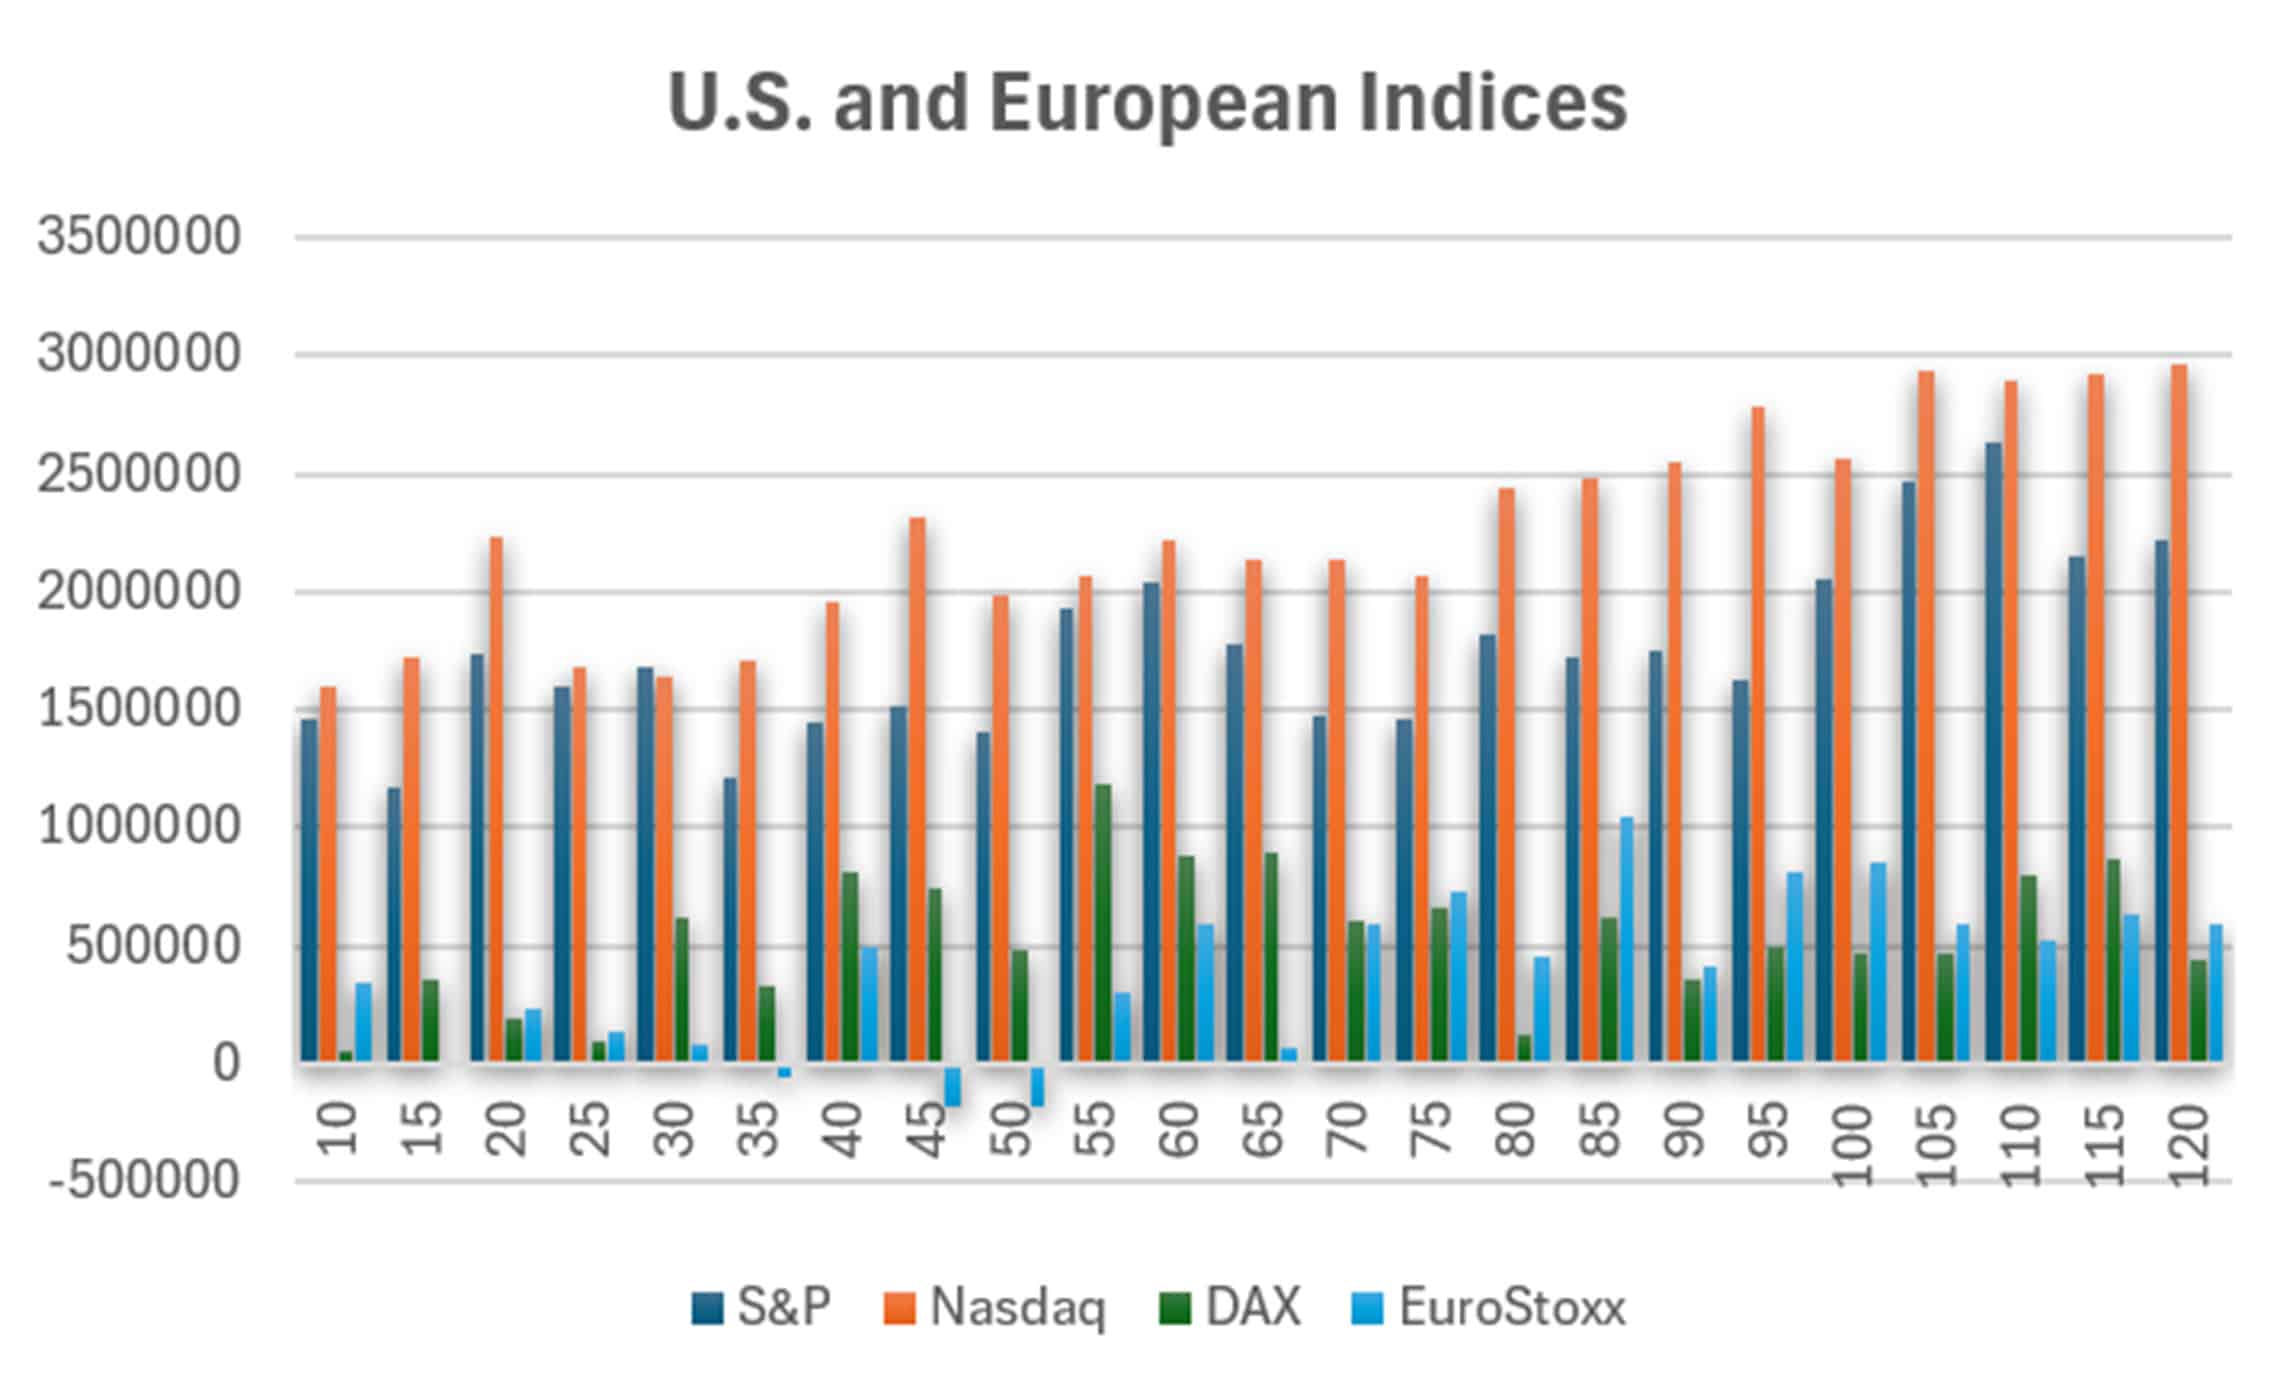
Figure 7. U.S. and European Index markets from 2010. (Source: CSI)
Not to forget some other markets, Figure 8 shows the results of the Hang Seng, the Nikkei, and the FTSE. There are also possibilities for India’s Nifty, but we’ll skip that for now. The chart shows that the Nikkei is profitable, but with no particular pattern, unlike the U.S. and even the DAX. The Hang Seng is less profitable, also inconsistent, but tradeable. The FTSE represents an economy that has been struggling. The FTSE average results are negative.
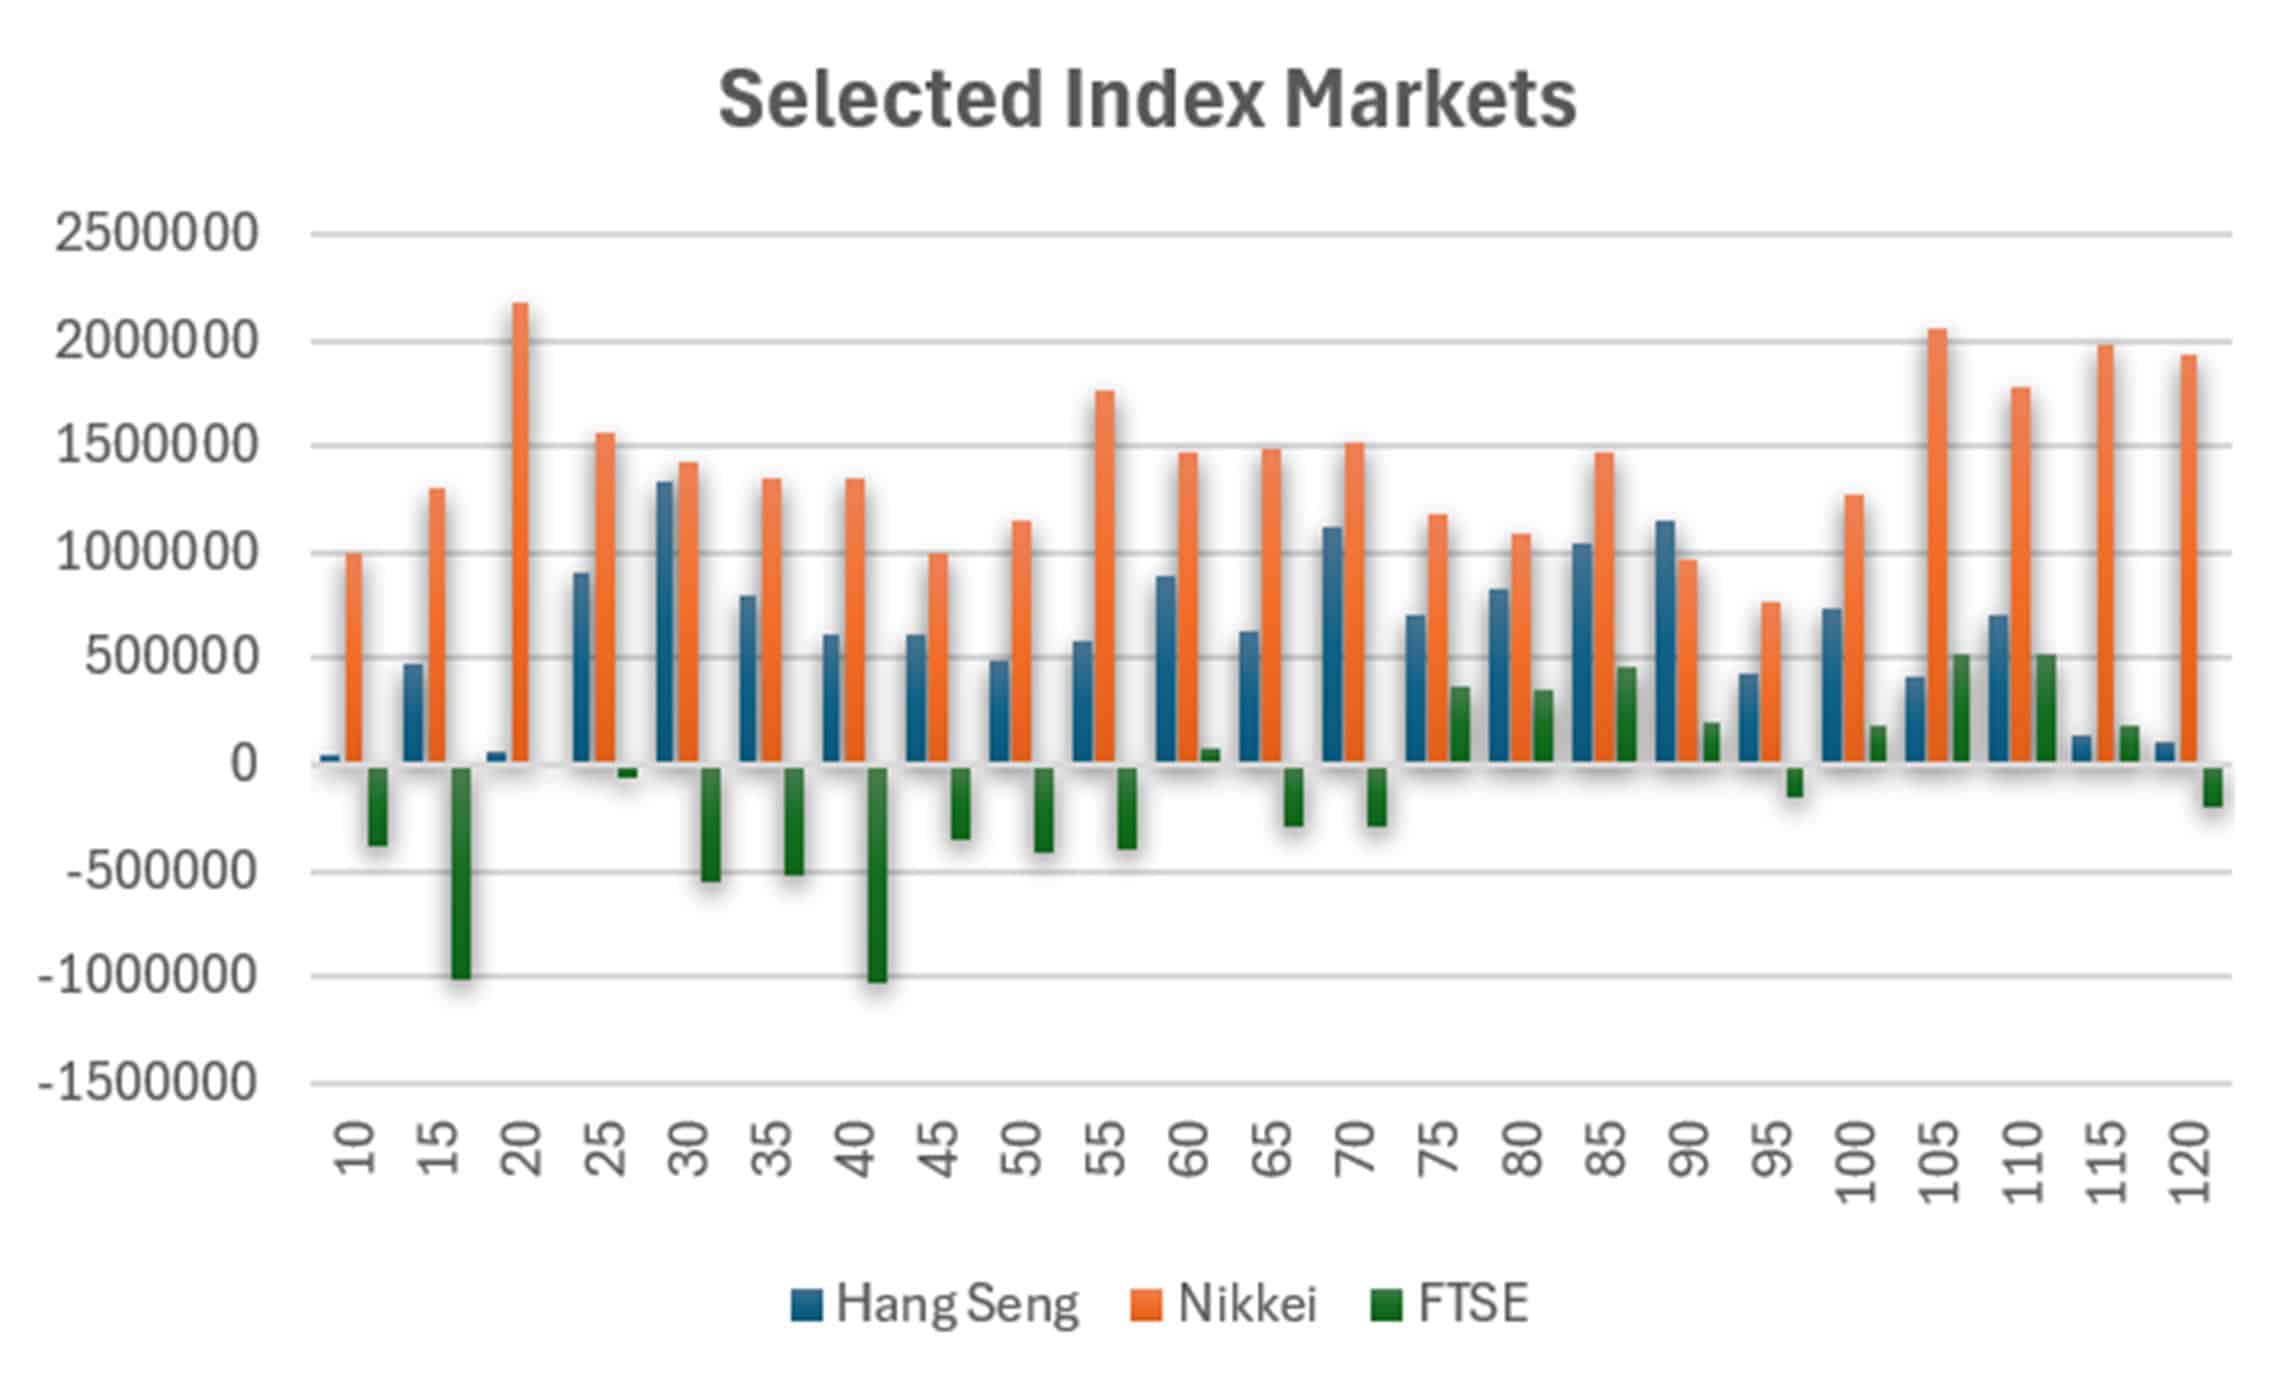
Figure 8. Selected Index markets. (Source: CSI)
For those looking to trade the Chinese market, either using a U.S. index or directly into Shanghai, Figure 9 might discourage you. While China is trying to revive the economy, it hasn’t happened yet.
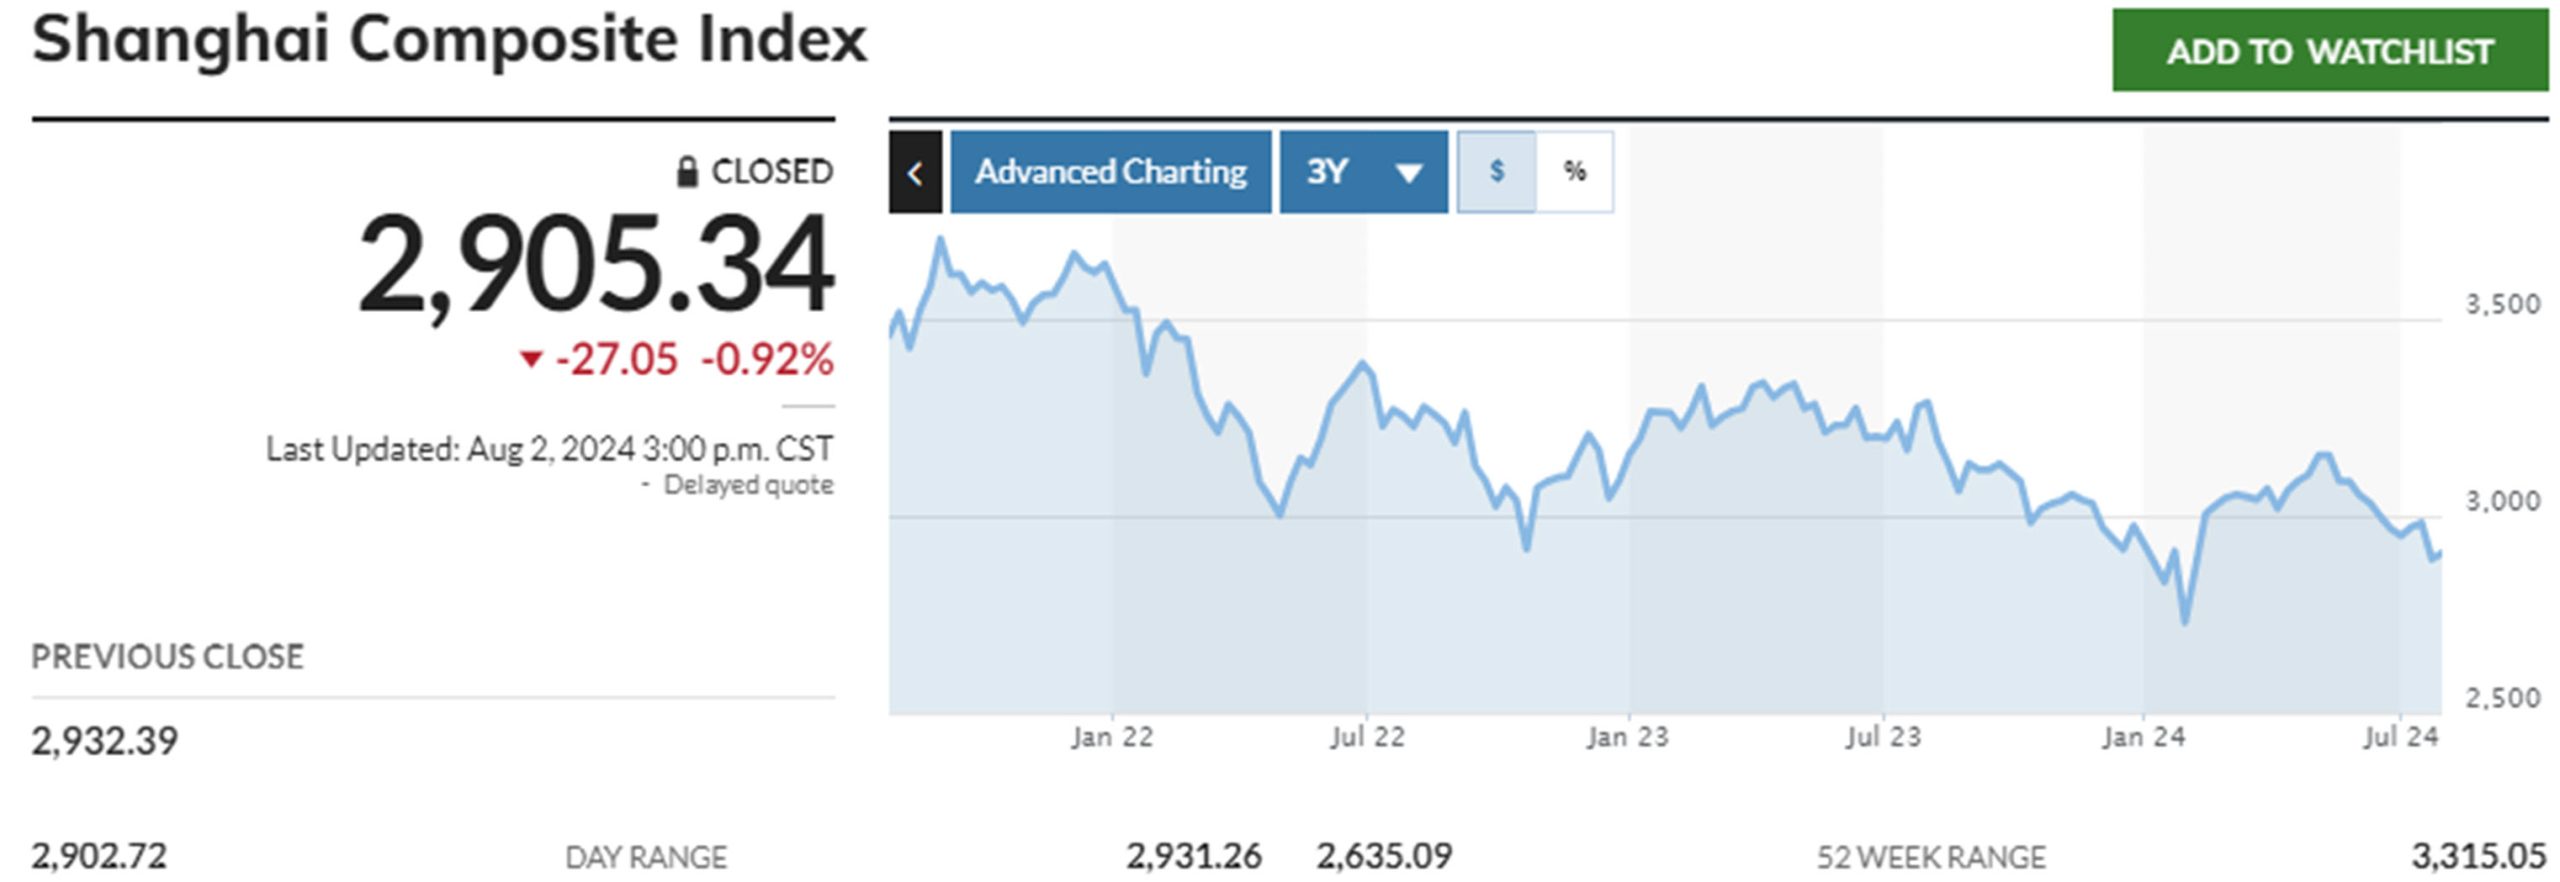
Figure 9. Shanghai Composite (Source: MarketWatch)
Summary
My purpose here is to show the markets that have the best chance of returning profits. I don’t find listening to the financial news as enlightening as looking at a chart. I’m looking for markets that are “robust,” that can be profitable with any moving average. Some of the choices require that you severely reduce your exposure to keep volatility to no more than 14%.
Sometimes it’s good not to trade. Interest rates are the primary source of profits for most funds, but only on the long side (yields declining). That’s not happening yet. So far, there has been a lot of stops and starts. However, a cut in the interest rate is likely soon.
For those markets that have had good results, trade equal risk, and keep that risk under 14%. Wait for a buy signal!
A Standing Note on Short Sales
Note that the “All Signals” reports show short sales in stocks and ETFs, even though short positions are not executed in the equity portfolios. Our work over the years shows that downturns in the stock market are most often short-lived and it is difficult to capture with a longer-term trend. The upwards bias also works against shorter-term systems unless using futures, which allows leverage. Our decision has been to take only long positions in equities and control the risk by exiting many of the portfolios when there is extreme volatility and/or an indication of a severe downturn.
PORTFOLIO METHODOLOGY IN BRIEF
Both equity and futures programs use the same basic portfolio technology. They all exploit the persistence of performance, that is, they seek those markets with good long-term and short-term returns on the specific system, rank them, then choose the best, subject to liquidity, an existing current signal, with limitations on how many can be chosen from each sector. If there are not enough stocks or futures markets that satisfy all the conditions, then the portfolio holds fewer assets. In general, these portfolios are high beta, showing higher returns and higher risk, but have had a history of consistently outperforming the broad market index in all traditional measures.
PERFORMANCE BY GROUP
NOTE that the charts show below represent performance “tracking,” that is, the oldest results since are simulated but the returns from 2013 are the systematic daily performance added day by day. Any changes to the strategies do not affect the past performance, unless noted. The system assumes 100% investment and stocks are executed on the open, futures on the close of the trading day following the signals. From time to time we make logic changes to the strategies and show how the new model performs.
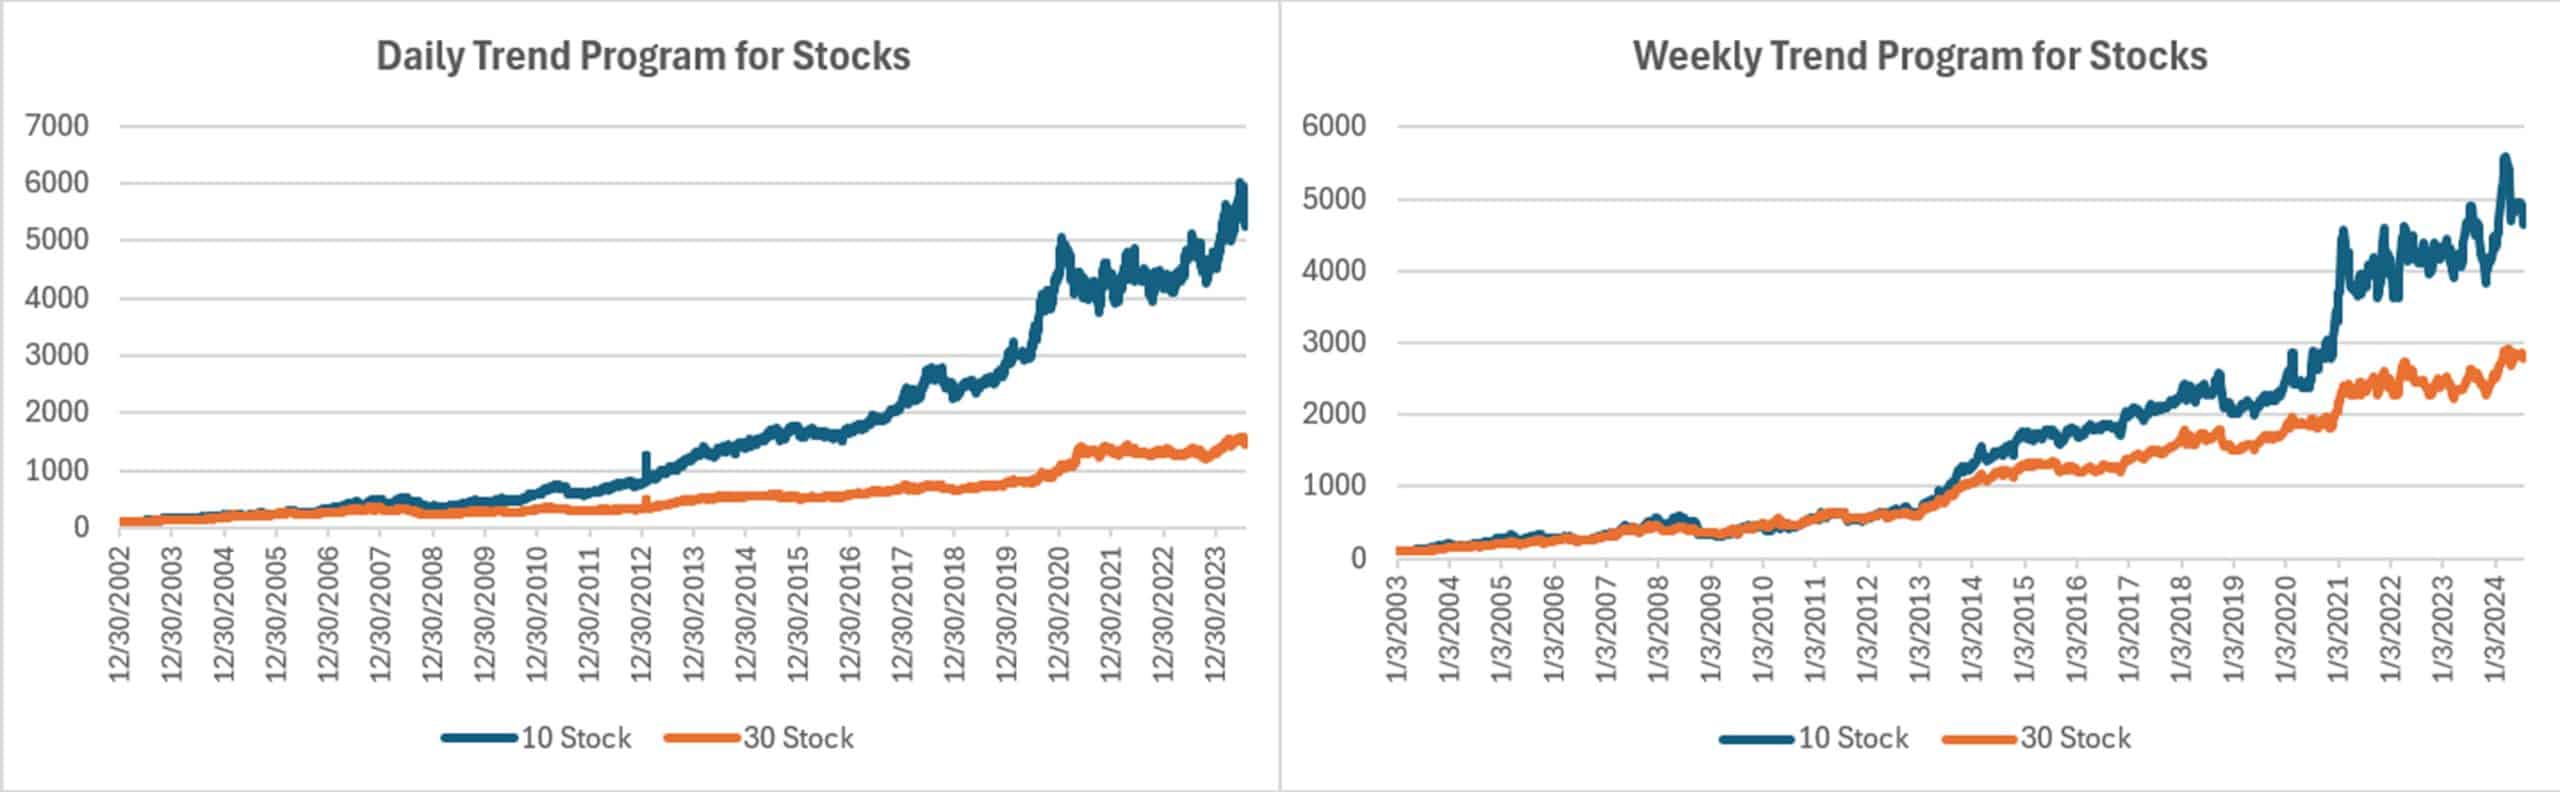
Groups DE1 and WE1: Daily and Weekly Trend Program for Stocks, including Income Focus, DowHedge, Sector Rotation, and the New High-Risk Portfolio
The Trend program seeks long-term directional changes in markets and the portfolios choose stocks that have realized profitable performance over many years combined with good short-term returns. It will hold fewer stocks when they do not meet our condition and exit the entire portfolio when there is extreme risk or a significant downturn.
Equity Trend
The Weekly portfolios are showing more volatility than the Daily, although both continue to move higher. This is a case where the Daily program has the advantage of exiting the semiconductors and high-tech stocks sooner than the Weekly program. Once there is a trend, the Weekly tends to be better by not jumping in and out.
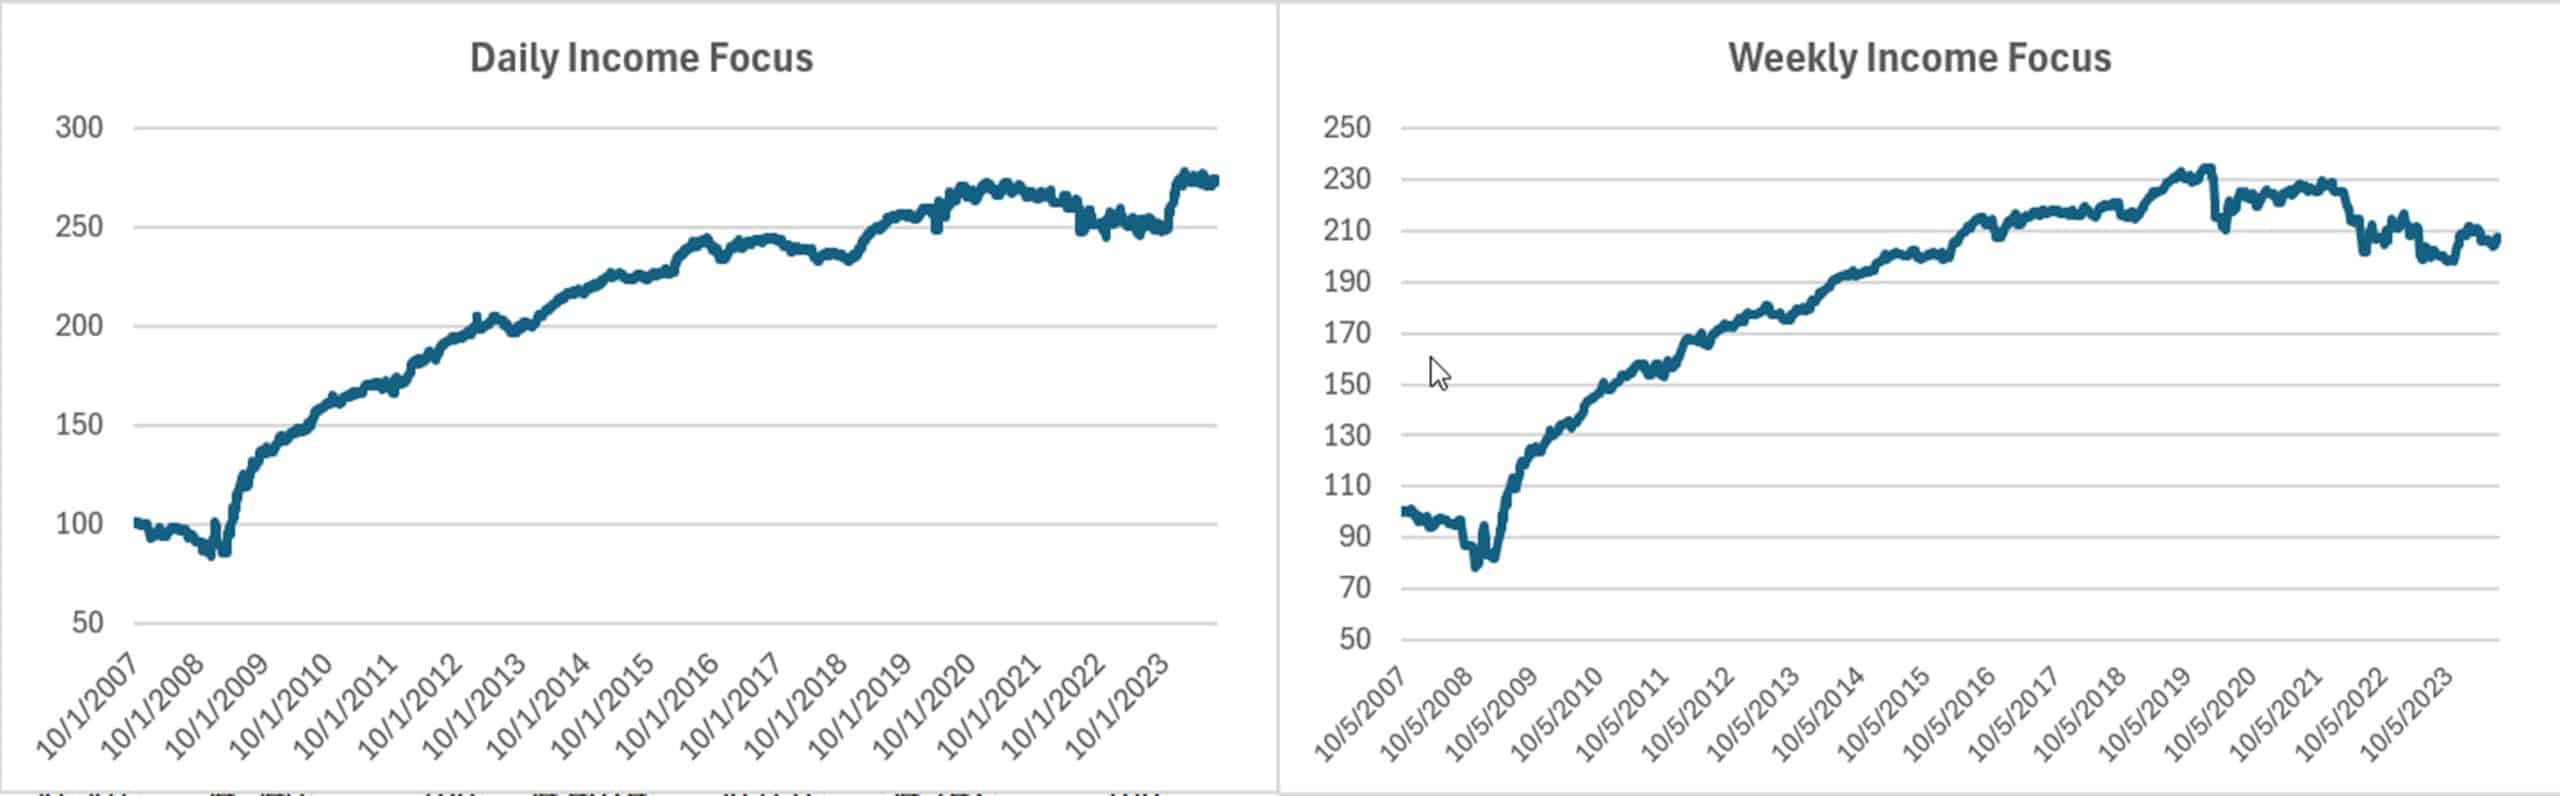
Income Focus and Sector Rotation
Gains in both the Daily and Weekly Income Focus portfolio as investors look towards lower rates. The Daily program has margin gains for the year while the Weekly program has marginal losses. If the Fed lowers rates in September, we should s good rally in this program.
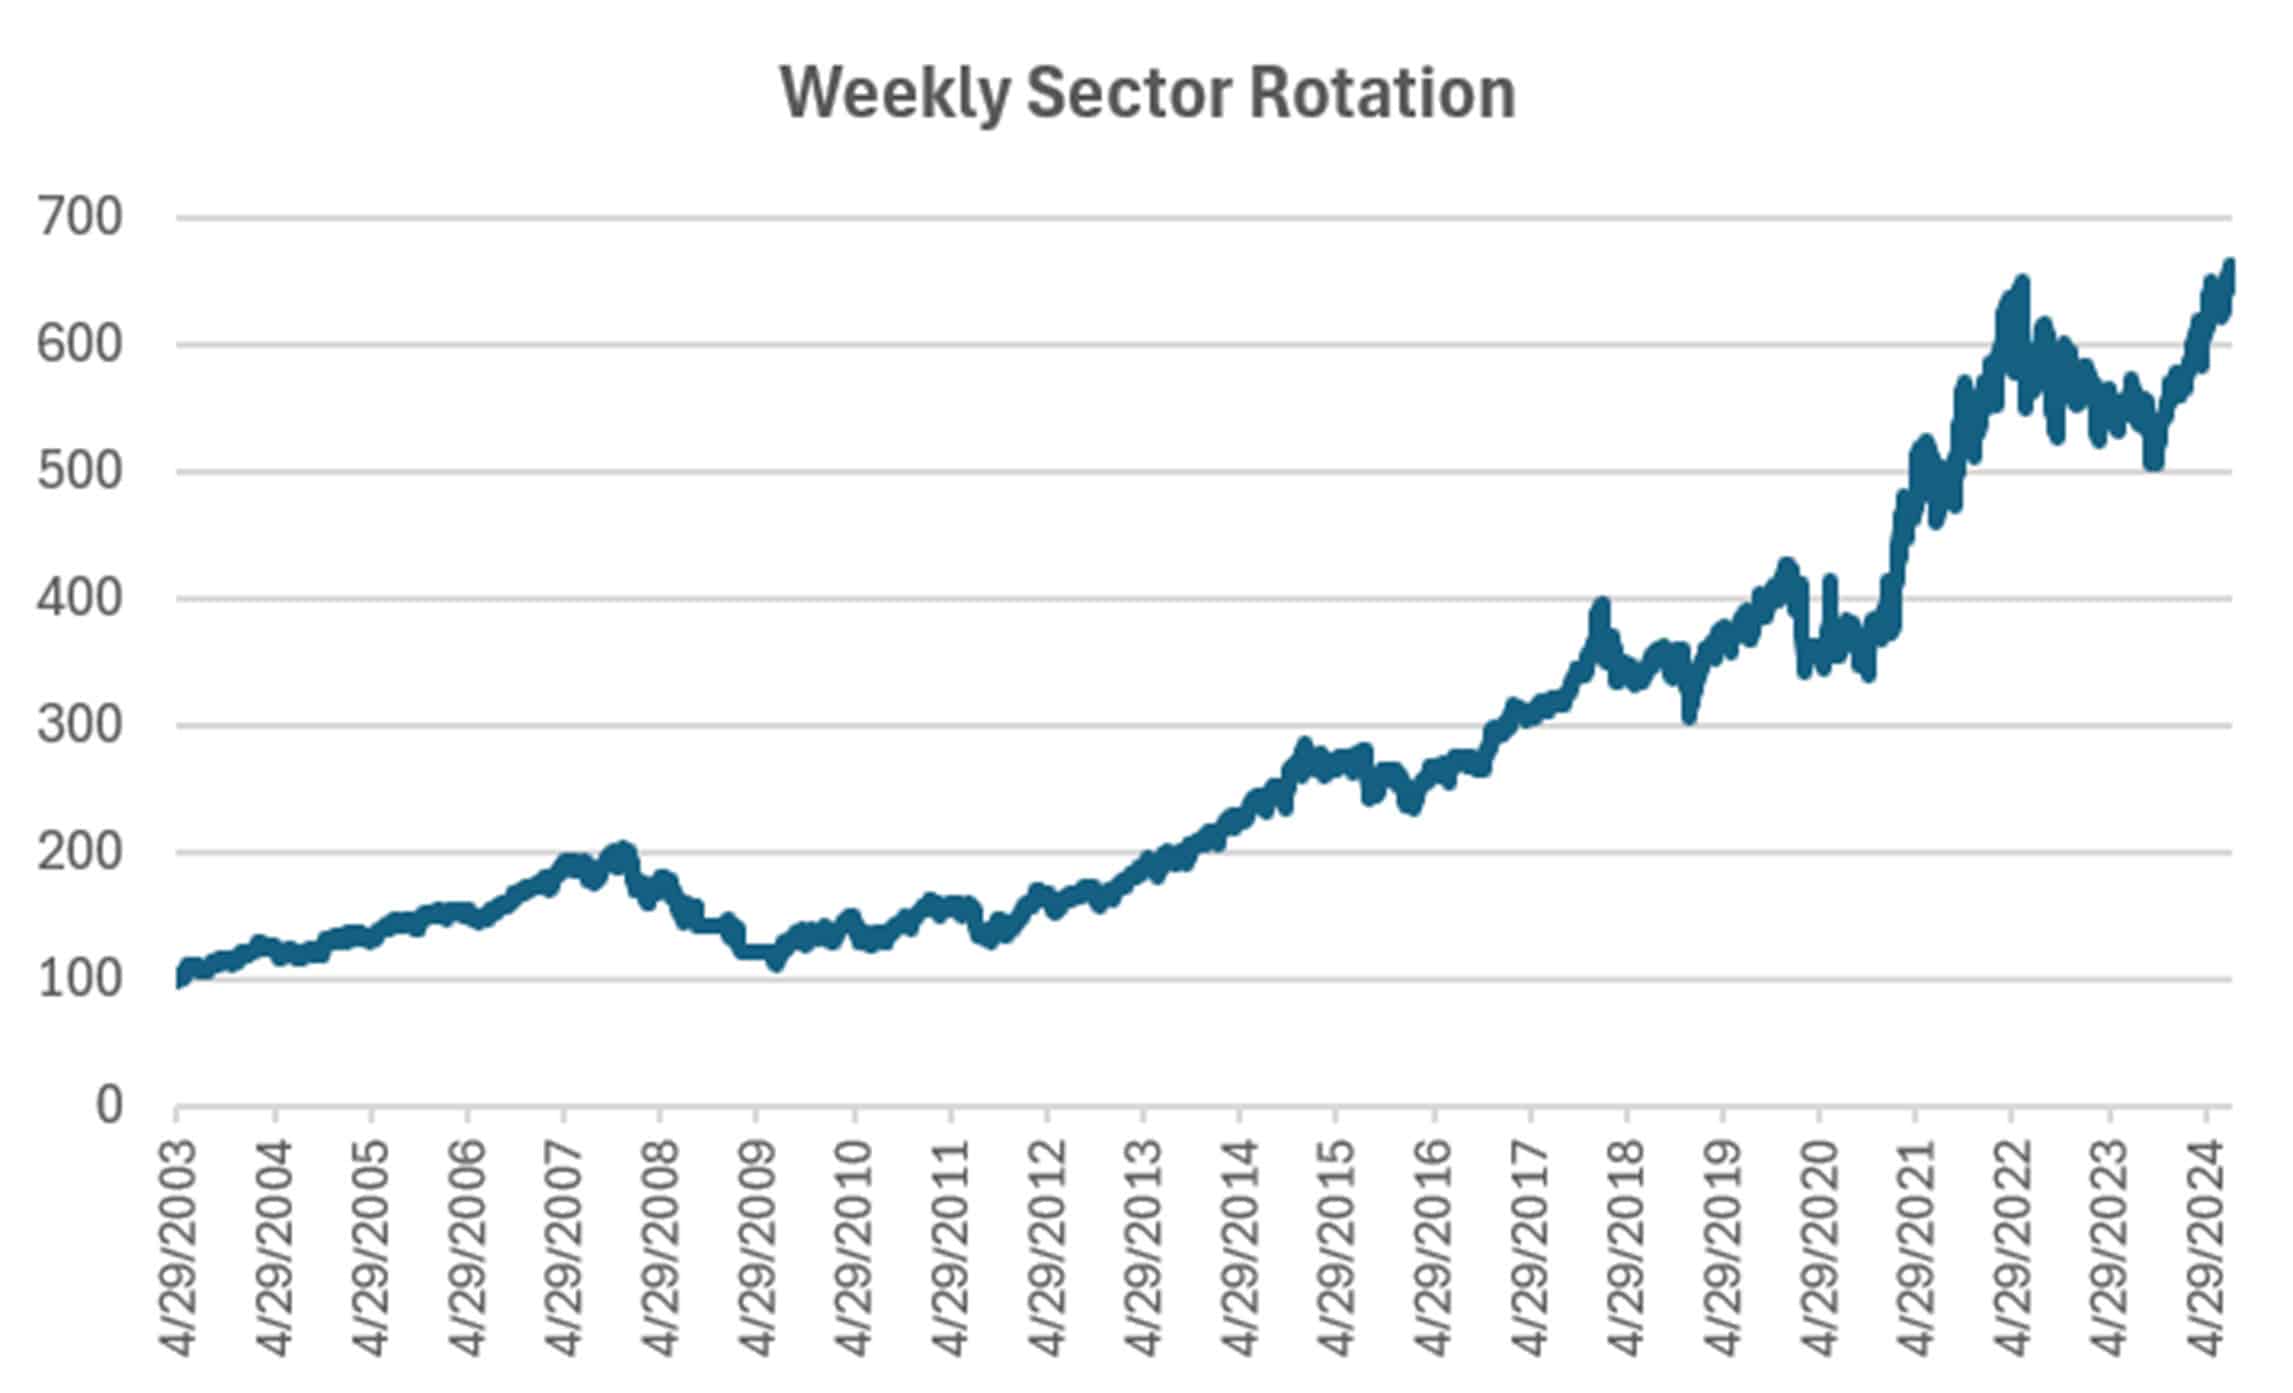
Sector Rotation
We continue to the same ETFs for most of this year, Financials, Staples, and Utilities. Who would have thought that we would have been up by nearly 6% in July and 16% for the year? It’s now at the top of our year-to-date performance.
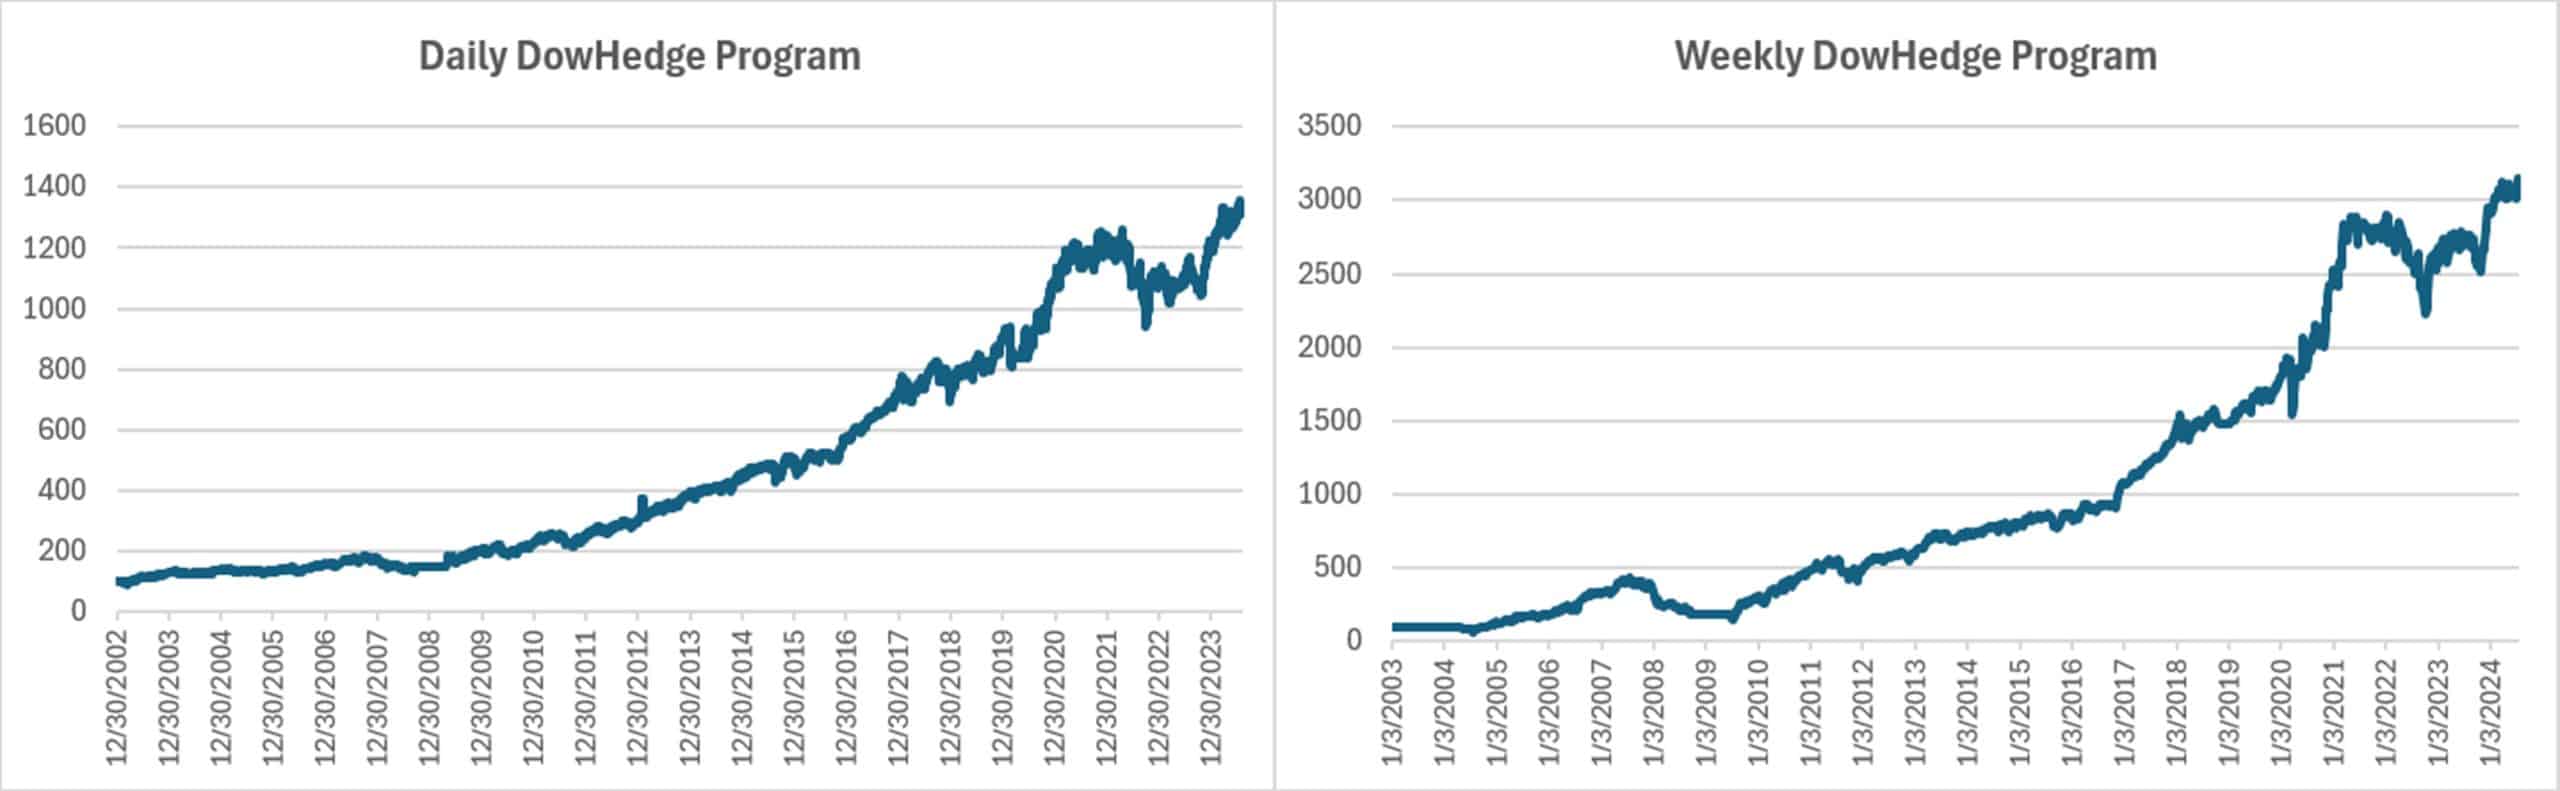
DowHedge Programs
Another program that gained in July was the DowHedge. Although the program will exit when volatility is high, it hasn’t done that in a while. This month might test that rule! The Daily program gained over 2% and the Weekly more than 5%. Hopefully, the is more to come.
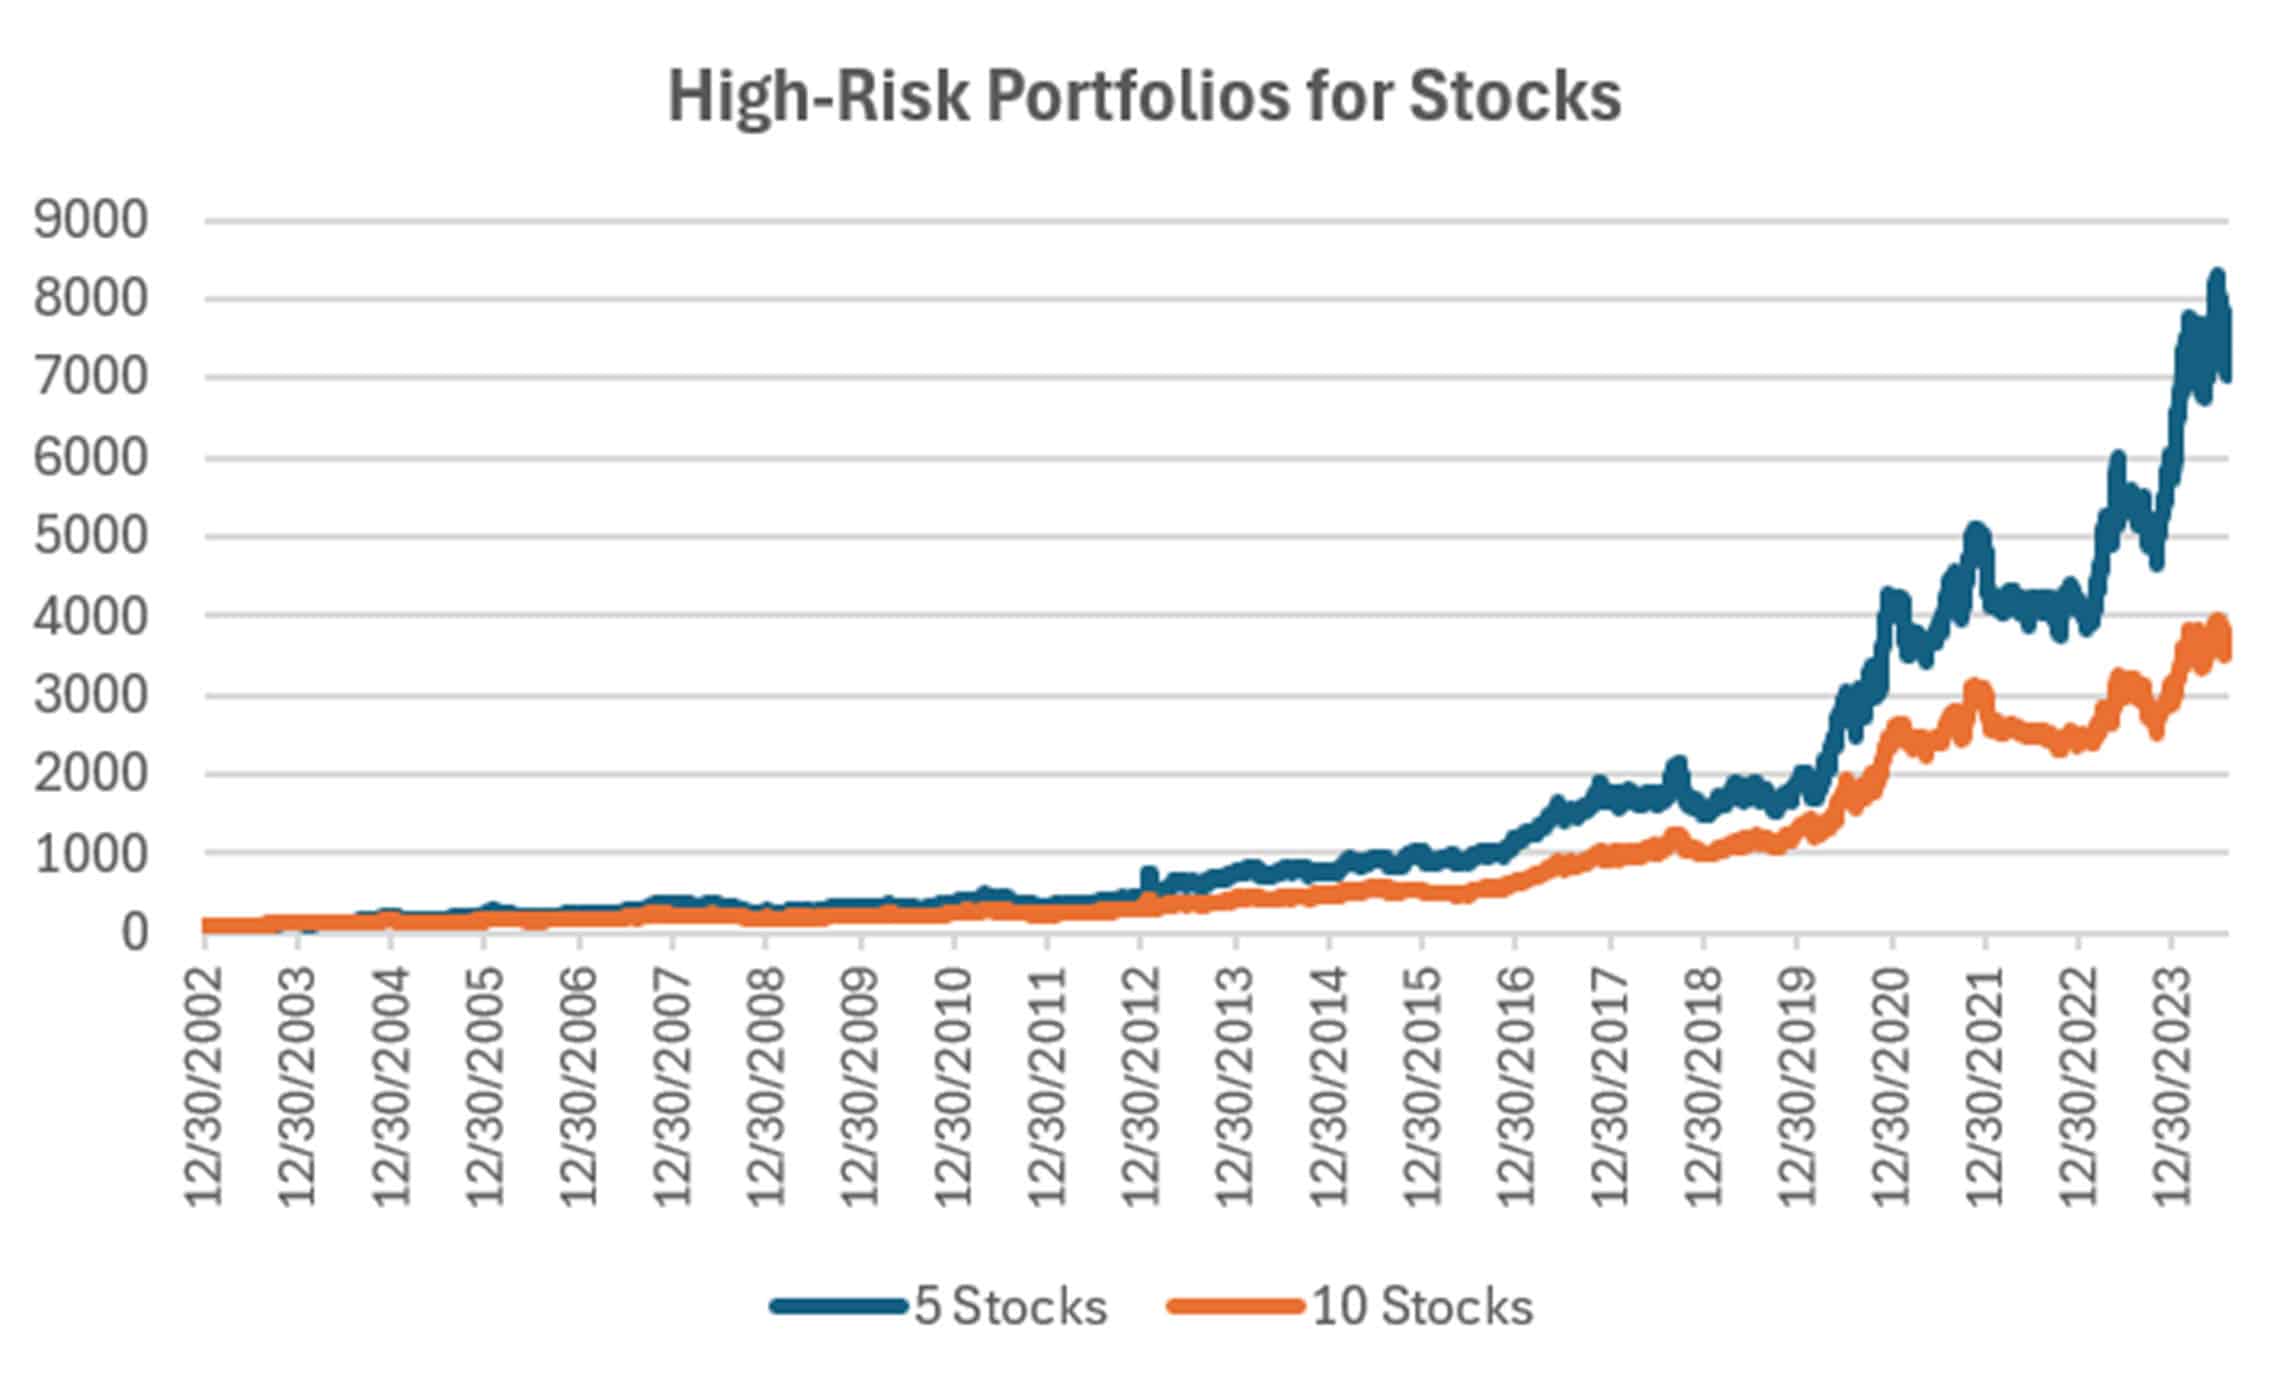
High-Risk Portfolios
Similar losses in the High-Risk portfolios that we have seen in the benchmark trend program. However, the regular Trend program has mostly divested high-tech stocks, so the performance should diverge in August. Now we get to see if high-tech is really sustainable.
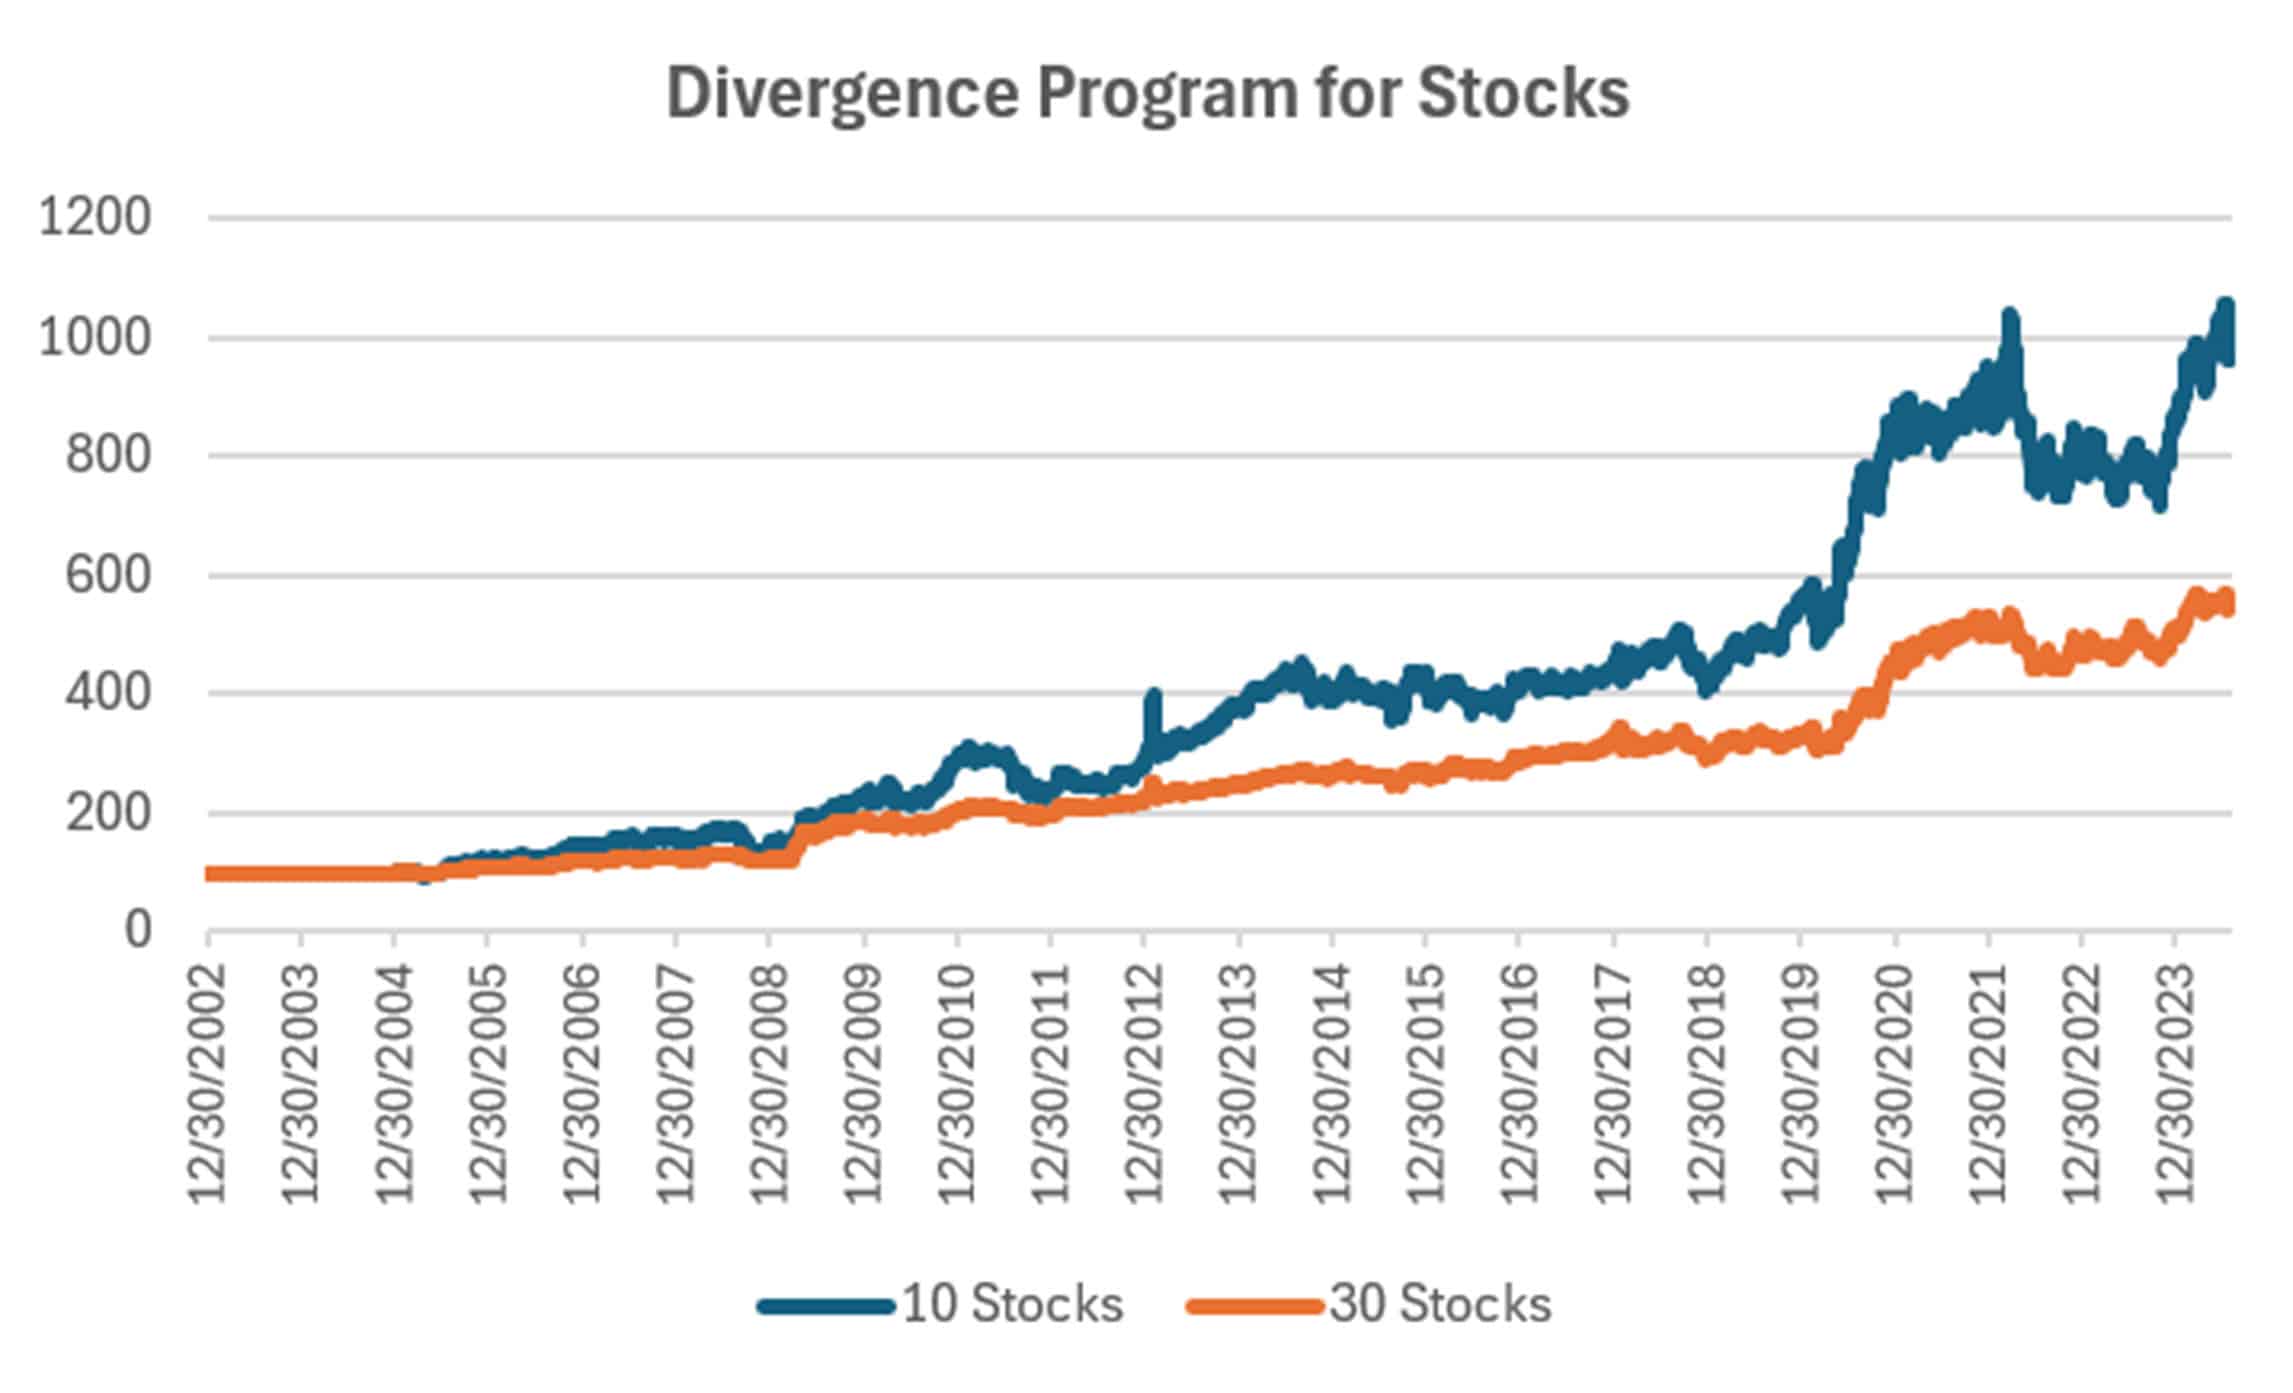
Group DE2: Divergence Program for Stocks
The Divergence program looks for patterns where price and momentum diverge, then takes a position in anticipation of the pattern resolving itself in a predictable direction, often the way prices had moved before the period of uncertainty.
Another case of losses of 5.5%, similar to the Trend program. As we have been mentioning all year, is program needs a trend before it can generate profits. That’s been hard to come by.
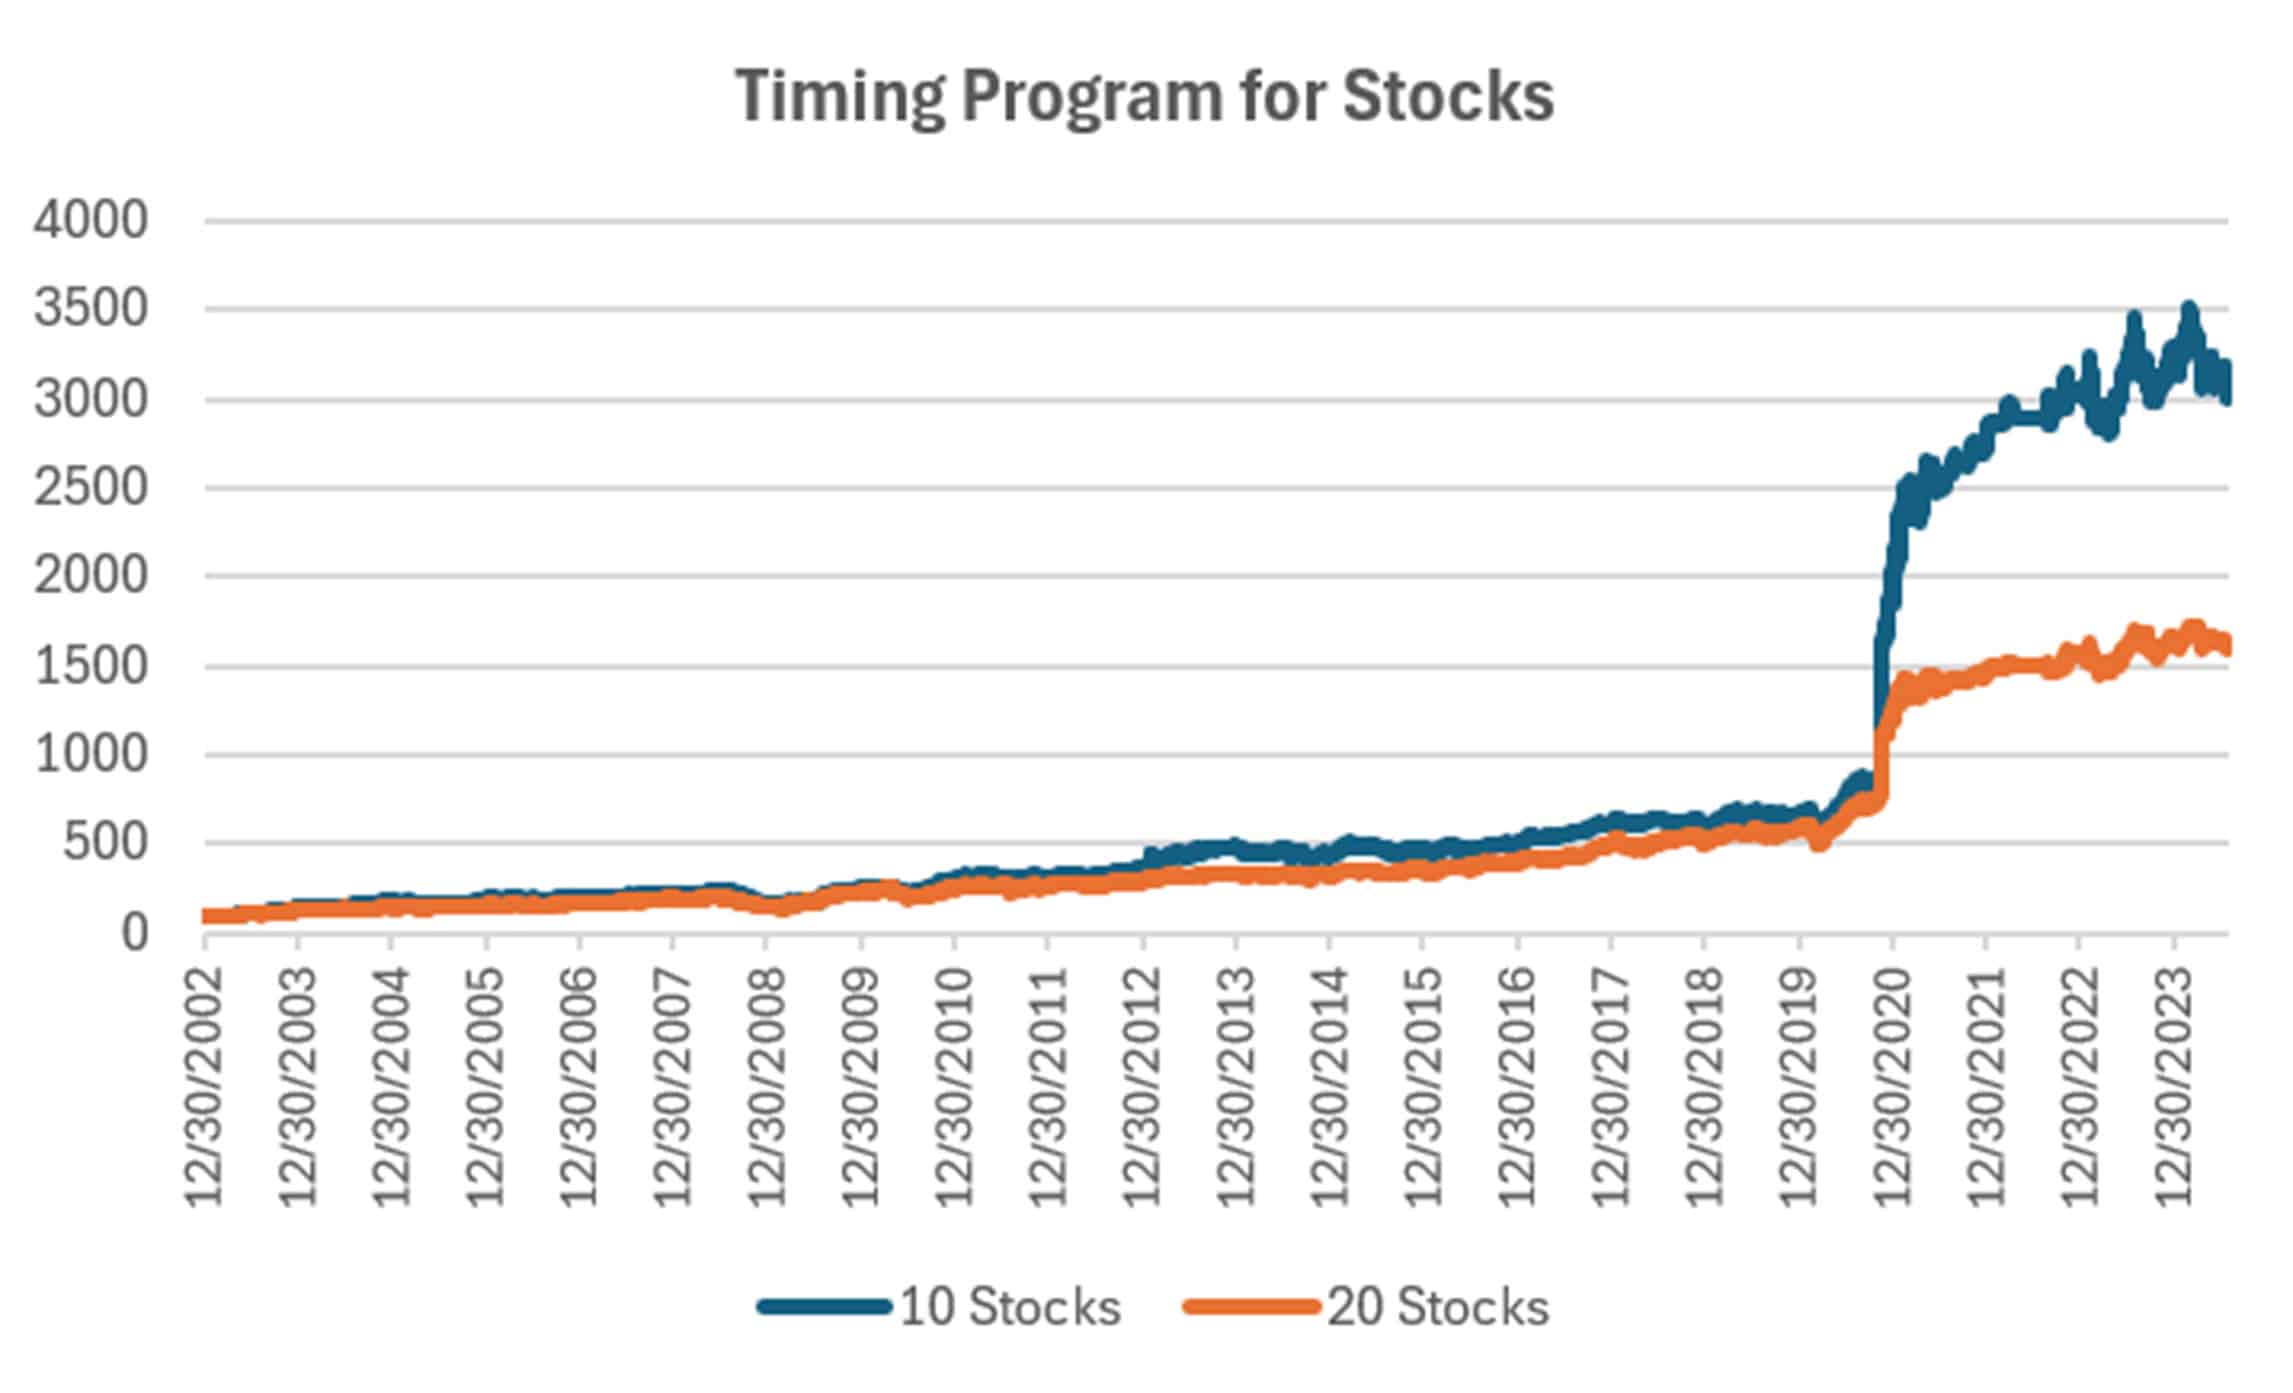
Group DE3: Timing Program for Stocks
The Timing program is a relative-value arbitrage, taking advantage of undervalued stocks relative to its index. It first finds the index that correlates best with a stock, then waits for an oversold indicator within an upwards trend. It exits when the stock price normalizes relative to the index, or the trend turns down. These portfolios are long-only because the upwards bias in stocks and that they are most often used in retirement accounts.
After this month’s losses. The equity is hanging at the low end of its range. This is another program that needs a trend to enter on a pullback. So far, the pullbacks have continued lower! We look forward to that changing soon.
Futures Programs
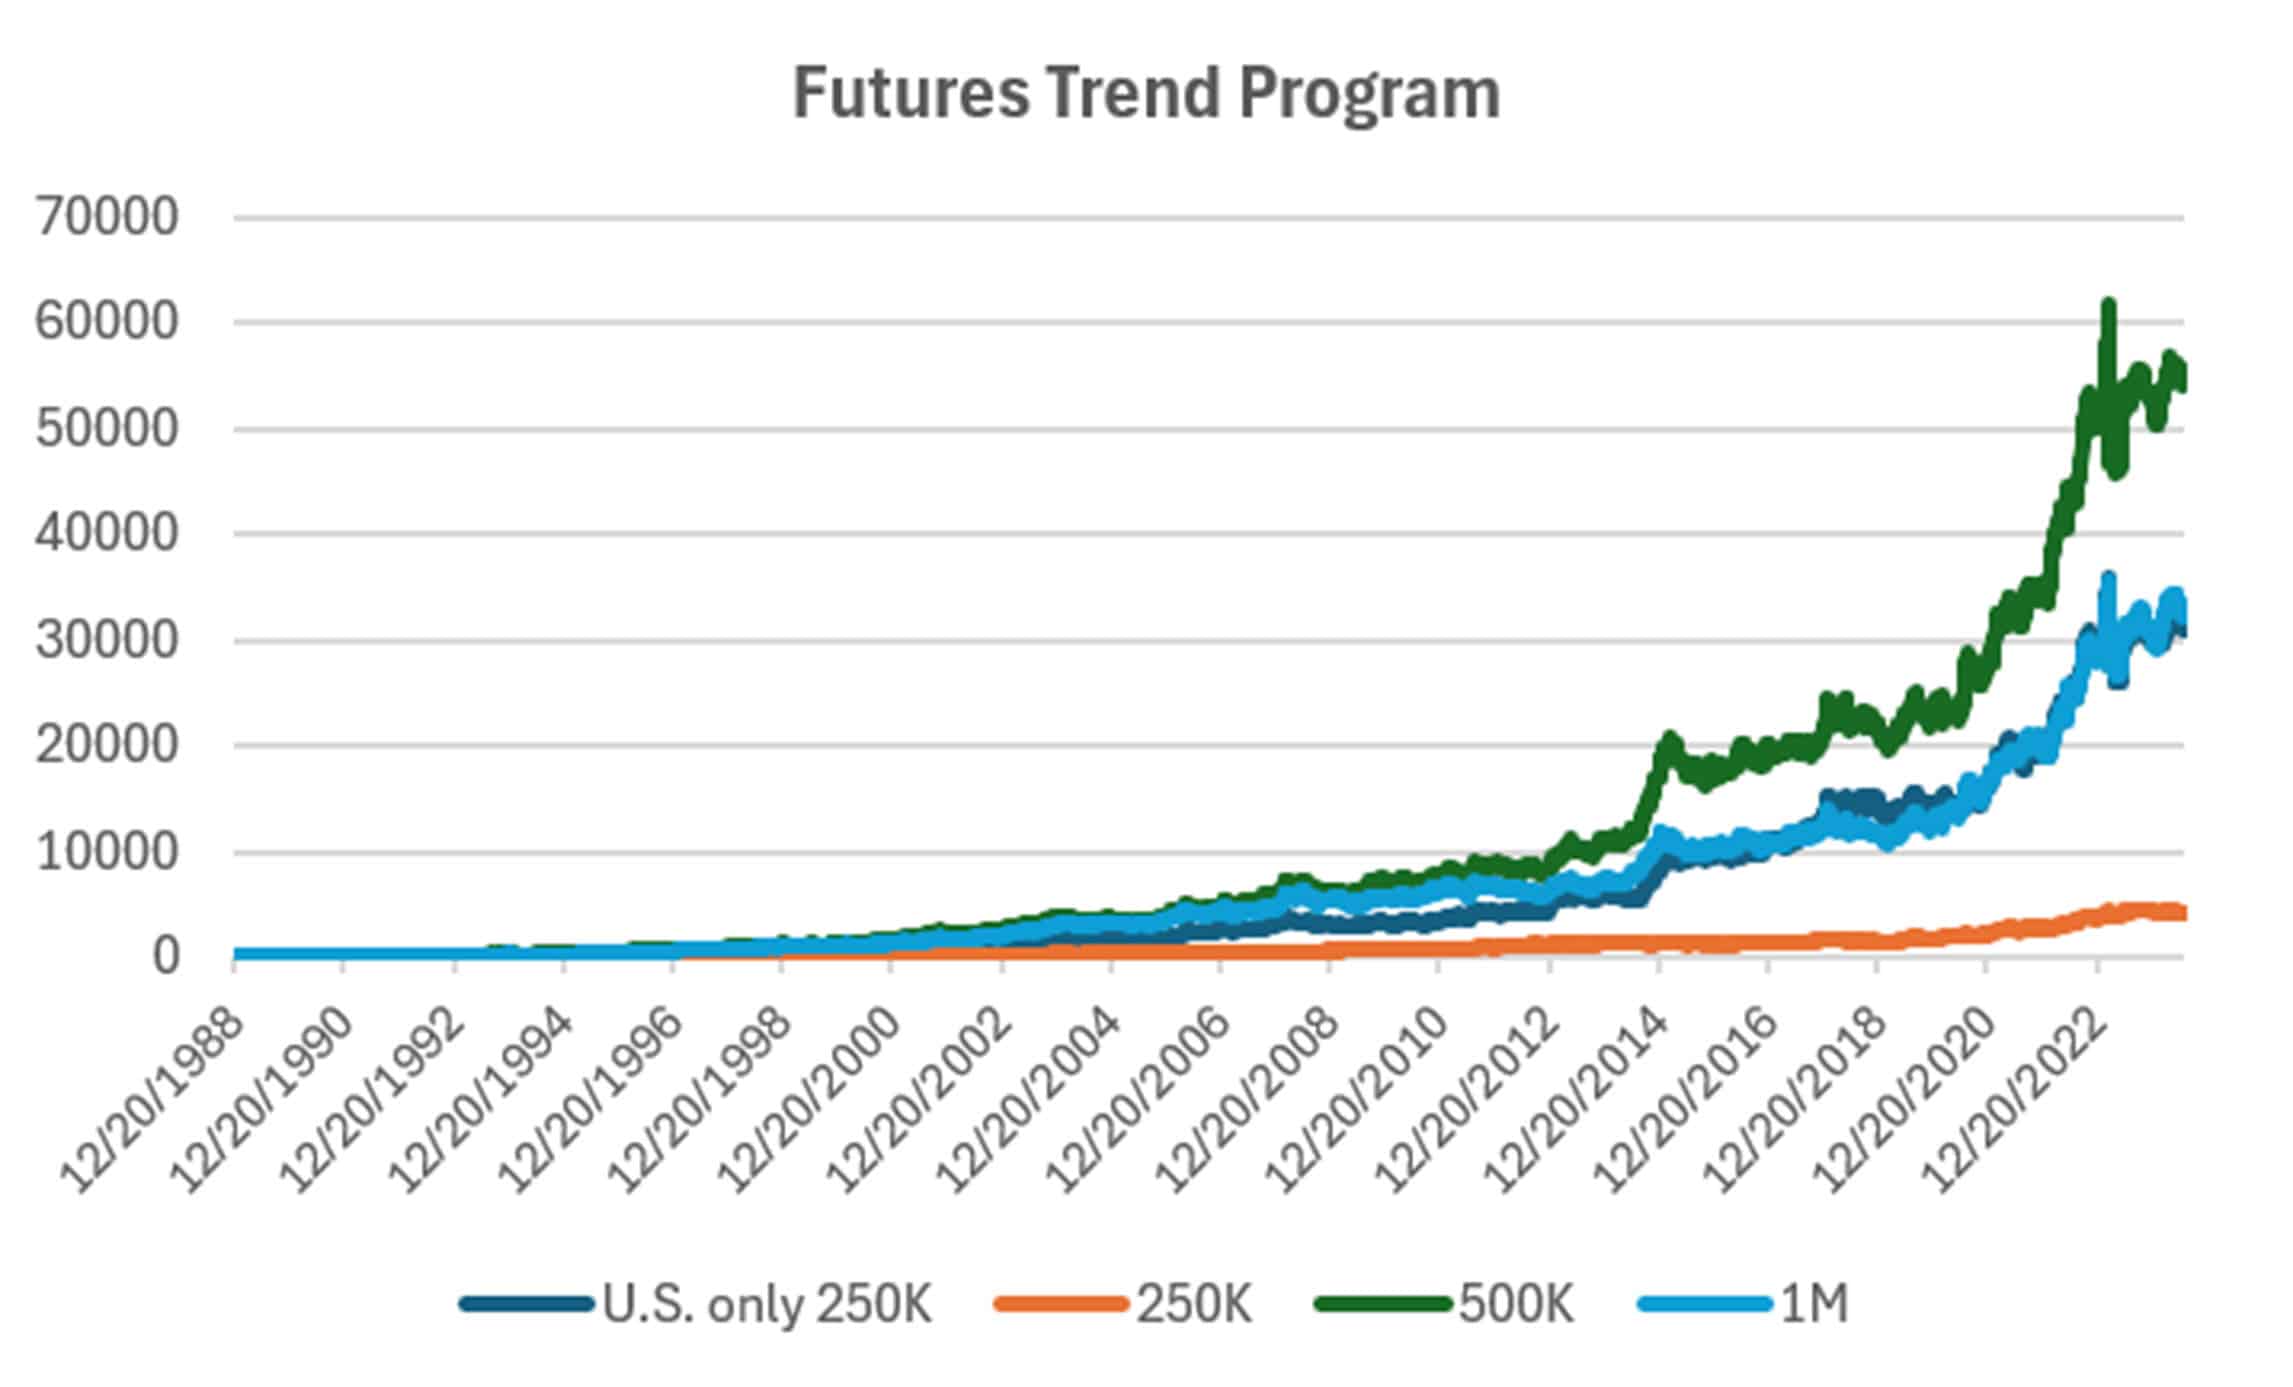
Groups DF1 and WF1: Daily and Weekly Trend Programs for Futures
Futures allow both high leverage and true diversification. The larger portfolios, such as $1million, are diversified into both commodities and world index and interest rate markets, in addition to foreign exchange. Its performance is not expected to track the U.S. stock market and is a hedge in every sense because it is uncorrelated. As the portfolio becomes more diversified its returns are more stable.
The leverage available in futures markets allows us to manage the risk in the portfolio, something not possible to the same degree with stocks. This portfolio targets 14% volatility. Investors interested in lower leverage can simply scale down all positions equally in proportion to their volatility preference. Note that these portfolios do not trade Asian futures, which we believe are more difficult for U.S. investors to execute. The “US 250K” portfolio trades only U.S. futures.
Modest losses in all portfolios leaves us slightly ahead for the year. Most futures program count on interest rates to produce the bulk of the profits. A situation that has not happen so far this year. Programs are hanging up at the top of the chart waiting for rates to trend!
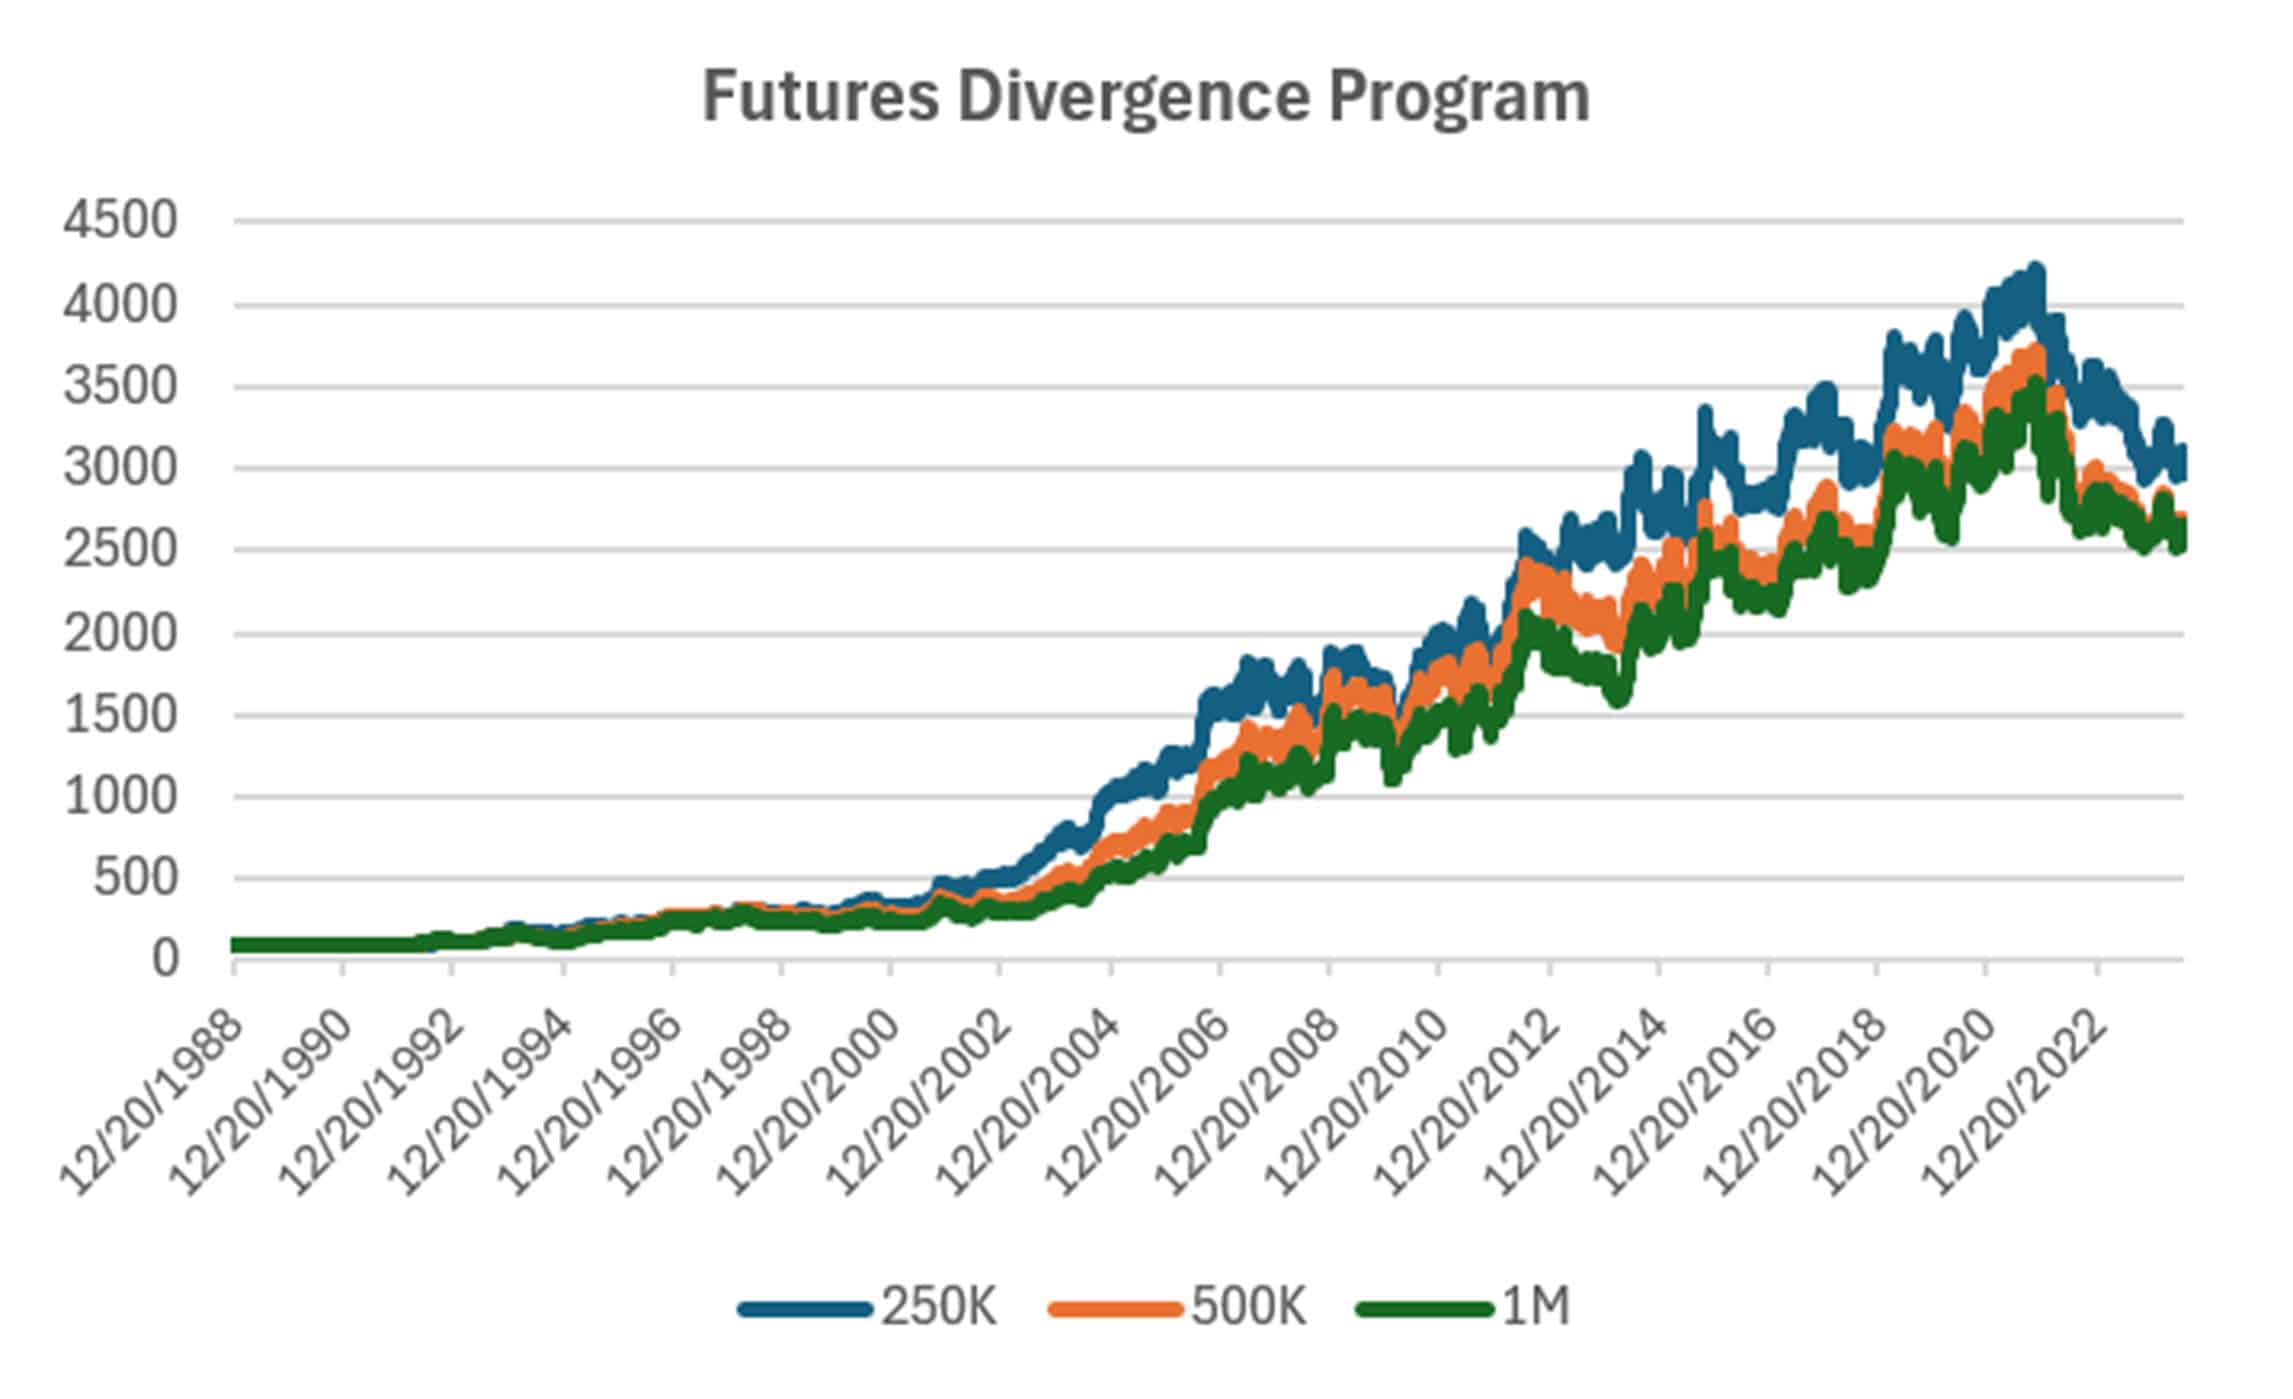
Group DF2: Divergence Portfolio for Futures
Mixed results for the Divergence program, with the $250 gaining, the $500 losing and the $1M mostly unchanged. As with the Equity Divergence program, this strategy needs a trend in order to capture the period where the trend pauses. Well, first we need a trend!
Blogs and Recent Publications
Perry’s books are all available on Amazon or through our website, www.kaufmansignals.com.
July 2024
Perry posted a new article on Seeking Alpha, “Capturing Fund Flows.” It a good strategy for someone that wants to add some diversification. It only trades 3 days each month!
Another article, “Theory Versus Reality” published in the August issue of Technical Analysis of Stocks & Commodities. It discusses price shocks, diversification, predicting performance, and more.
June 2024
Perry was interviewed on June 27th by Simon Mansell and Richard Brennan at QuantiveAlpha (Queensland, Australia), a website heavy into technical trading. It should be posted in a week or so.
“Trading Extreme Gaps and Extreme Closes” looks at daily patterns in stocks, published in the June edition of Technical Analysis.
May 2024
In the April edition of Technical Analysis, Perry again deals with risk in “How Professional Assign Risk.” It is another chapter in how to protect yourself.
April 2024
Another article in the April edition of Technical Analysis, “Determining Risk Before It Happens.” Perry thinks this is an article everyone should read.
March 2024
In the 2024 Bonus Issue of Technical Analysis, Perry has an article, “Pros and Cons of Daily Versus Weekly Trend Following.” There is also a quote by him in the “Retrospective: Interviews” going back to April 1988.
Perry also posted an article on Seeking Alpha, “How To Exit a Trade.” A good reminder of the choices.
February 2024
Perry published an article on using the backwardation and contango in crude oil in “The Delta-Delta Strategy.” If not crude, the you might think of this for any commodity, including interest rates, that have a consistent term structure.
January 2024
A new article in February edition of Technical Analysis of Stocks & Commodities, “Crossover Trading: Arbitrating the Physical with the Stock.” A chance at diversification!
Perry posted 3 new articles on Seeking Alpha in December, “Where Do You Take Profits?”, “Is There a Better Day to Enter the Market,” and “Watching January Returns.”
Another article in Technical Analysis of Stocks & Commodities, “Gap Momentum,” another interesting way to identify the trend.
December 2023
Perry posted 3 new articles on Seeking Alpha, “Where Do You Take Profits?”, “Is There a Better Day to Enter the Market,” and “Watching January Returns.”
This month Technical Analysis of Stocks & Commodities published “A Strategy For Trading Seasonal and Non-Seasonal Market.” Turns out that most markets are non-seasonal!
November 2023
Perry posted two articles on Seeking Alpha, “Compression Breakout: Giving a Boost to Your Entries,” and “Volatility: The Second Most Important Indicator.” In addition, he interview Herb Friedman in Technical Analysis of Stocks & Commodities. Herb is a interest rate specialist focusing on low risk investments.
October 2023
In this month’s Technical Analysis of Stocks & Commodities Perry shows how Merger Arb works and how an investor can participate in it. Merger Arb has been the realm of Institutions, but there are opportunities for everyone.
August 2023
Two(!) new articles by Perry in the August issue of Technical Analysis of Stocks & Commodities. The first is a look at how ChatGPT might help traders. It even asks for a computer program to use trend following.
The second article is “Portfolio Risk Dilemma,” where Perry answers the question of whether to let a stock or futures profit run or rebalance, and whether you should do the same for a diversified portfolio.
Older Items of Interest
On April 18th, 2023 Perry gave a webinar to the Society of Technical Analysts (London) on how to develop and test a successful trading system. Check their website for more details, https://www.technicalanalysts.com..
Perry’s webinar on risk, given to the U.K. Society of Technical Analysts, can be seen using the following link: https://vimeo.com/708691362/04c8fb70ea
For older articles please scan the websites for Technical Analysis of Stocks & Commodities, Modern Trader, Seeking Alpha, ProActive Advisor Magazine, and Forbes. You will also find recorded presentations given by Mr. Kaufman at BetterSystemTrader.com, TalkingTrading.com, FXCM.com, systemtrade.pl, the website for Alex Gerchik, Michael Covel’s website, TrendFollowing.com, and Talking Trading.com.
You will also find up to six months of back copies of our “Close-Up” reports on our website, www.kaufmansignals.com. You can address any questions to perry@kaufmansignalsdaily.com.
© July 2024, Etna Publishing, LLC. All Rights Reserved.