

Industry Benchmark Performance
Small gains nearly everywhere, given the 7% drop a week ago when DeepSeek announced that it could produce AI as fast and much cheaper. That is, if you don’t mind Chinese censoring and you don’t mind using someone else’s data. It seems strange that, given all the issues about Tik-Tok being a Chinese firm, that the market has accepted DeepSeek. Perhaps it only proves that there are better ways to implement AI.
We also need to deal with the administration’s tariffs, or the threat of tariffs. That would lower stock returns by a few points, if not more… if they happen. Stay tuned.

Source: BarclayHedge Indices.
Kaufman’sMost Popular Books (available on Amazon)
Trading Systems and Methods, 6th Edition. The complete guide to trading systems, with more than 250 programs and spreadsheets. The most important book for a system developer.
Kaufman Constructs Trading Systems. A step-by-step manual on how to develop, test, and trade an algorithmic system.
Learn To Trade. Written for both serious beginners and practiced traders, this book includes chart formations, trends, indicators, trading rules, risk, and portfolio management. You can find it in color on Amazon.
You can also find these books on our website, www.kaufmansignals.com.
Blogs and Recent Publications
Find Mr. Kaufman’s other recent publications and seminars at the end of this report. We post new interviews, seminars, and reference new articles by Mr. Kaufman each month.
January Performance in Brief
Much like the equities market, our Trend program gains a few points in January. Some programs did better and some were down a small amount. Early days.
The only problem we see is the interest rate markets, which are the big contributors to the Futures portfolios. While we once hoped for a steady decline in rates, resulting in a trend, we now see unchanged rates, and possibly even higher rates if tariffs are imposed. But there is the possibility of profits while rates go higher – not a good sign for the economy, but OK for trading.
Agricultural commodities have been the focus of any profits made in Futures funds, and we talk about that in our “Close-Up” report this month.
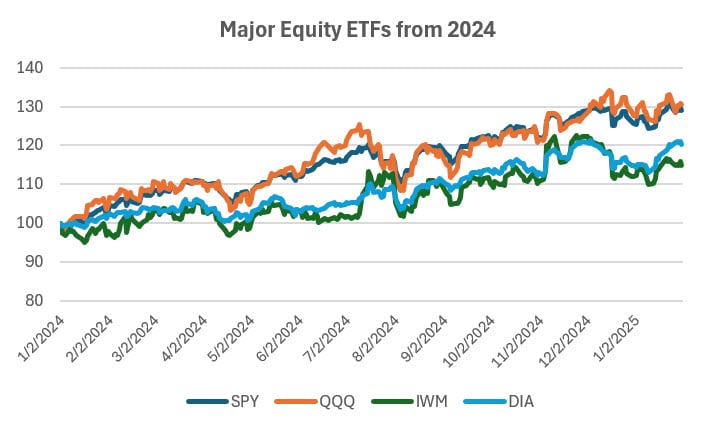
Major Equity ETFs
Moving our chart to begin in January 2024, the pattern is more volatile. SPY and QQQ are tracking together, probably because the biggest capitalization stocks in both indices. The DOW (DIA) and the small caps (IWM) are also tracking together. December did not turn out to be a bullish month, and January seems to be a “wait-and-see.” Given the shock to the IA sector, and potential tariffs, performance of 2025 is highly uncertain.
CLOSE-UP: Trading Seasonal Commodities
Aren’t all commodities seasonal? Probably not oil, and precious metals are also unlikely. Copper and lumber move with housing, but agricultural products depend on both the weather and demand. Well, all commodities depend on demand. This is the time of year to think about seasonals.
In 2024, cocoa, coffee, and orange juice were big winners for futures funds, provided there was enough volume and you entered at the right time (and exited).
You need to understand the ag market before trading seasonality. More than other markets, commodities require some special knowledge of how the market works, how supply and demand works, and how nature works.
A Classic Seasonal Chart
When I think of seasonals, I always start with U.S. grains: corn, soybeans, and wheat. Corn and soybeans are planted in the spring and harvested in the fall. Wheat is harvested in the Spring. To get a seasonal chart, we average the yearly results and divide the monthly results by the yearly average. In Chart 1, we see that January Corn is higher by 2% compared to the rest of the year.
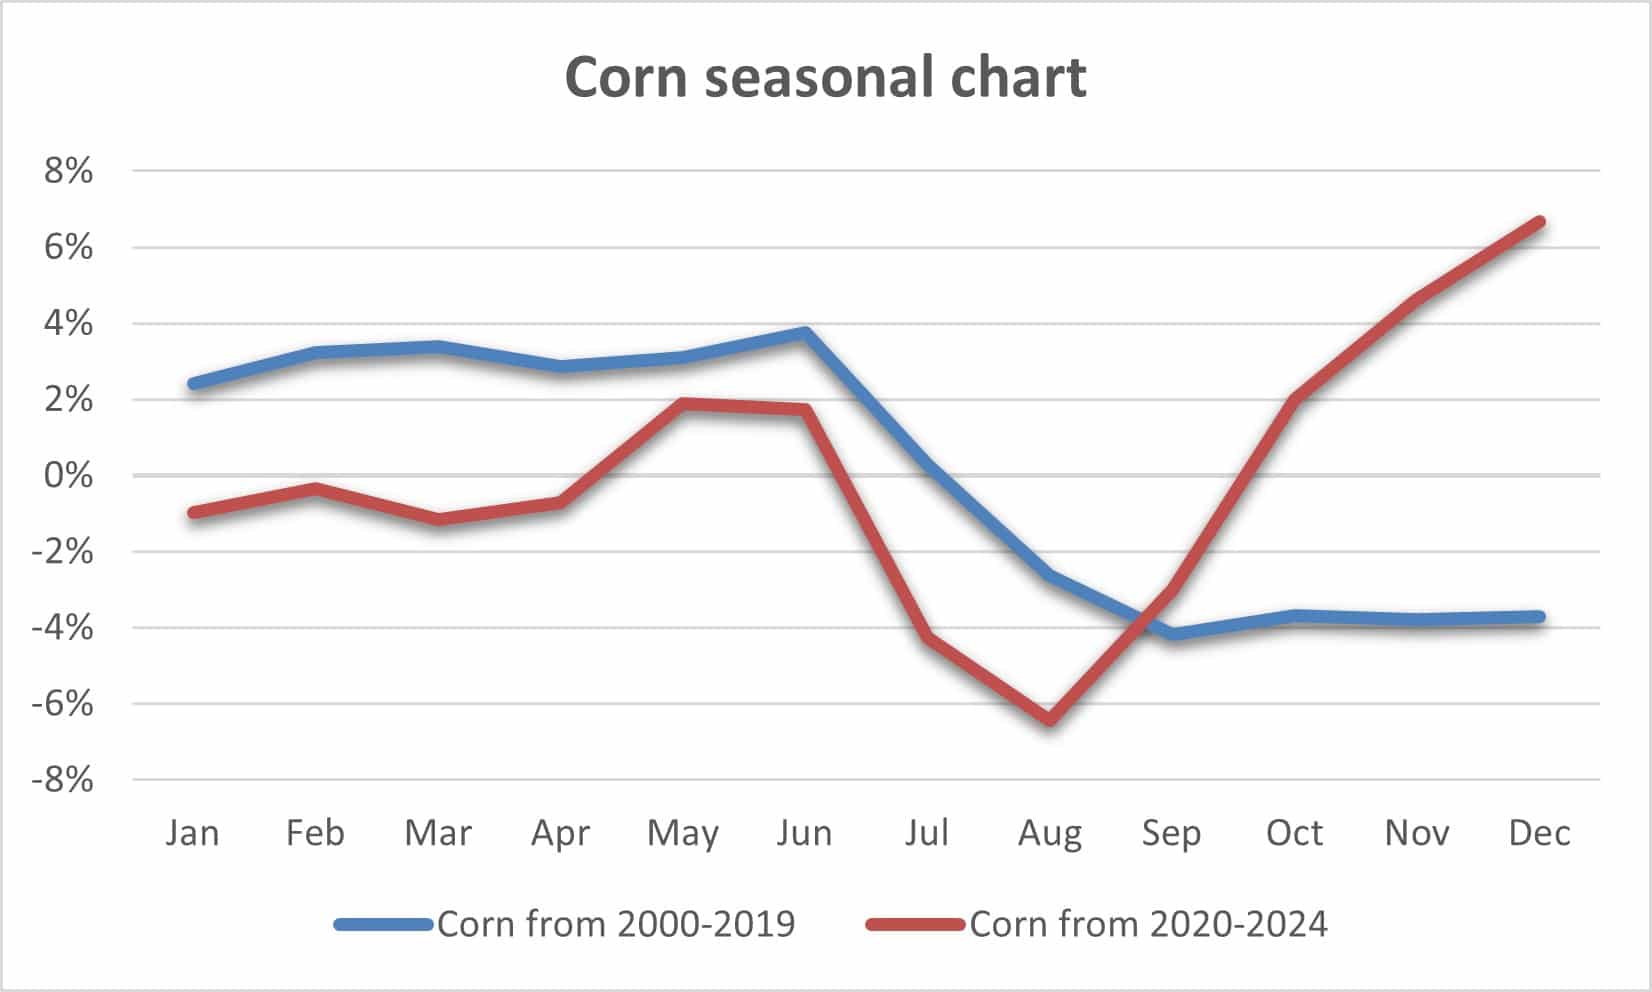
Chart 1. Corn seasonality.
Typically, harvest time shows the lowest prices. U.S. grains are harvested only once each year, generally in September and October, as shown by the blue line (2000-2019). But recently prices have rallied sharply after harvest. If it was a poor harvest, then the red line would not have dipped to -6%, below the blue line. Then we had a good harvest and yet prices rallied. What happened?
The obvious reasons, and probably the main reason, would be demand, the U.S. dollar, and inflation. I’ll let you figure that out, but we’re going to see the same phenomenon in most of the examples that are shown below. In Chart 2, showing corn prices only for 2024, we see the drop at harvest followed by an unusual rally.
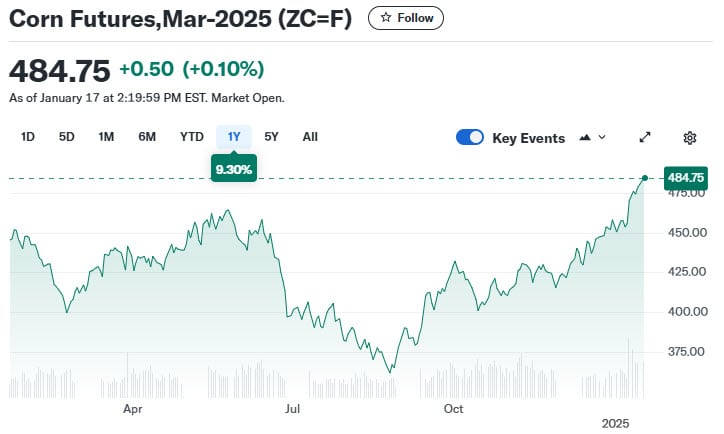
Chart 2. Corn futures, 2024. Selling off at harvest, then rallying sharply.
Seasonal Strategy
Most seasonal traders will buy in the first quarter, sell mid-summer when crop scares are moving the market, then cover their shorts at harvest. When prices begin the year at the lower end of the range, we have a high probability of profits on a rally during the summer.
In the past, a higher price at the beginning of the year forecasted declining prices for the planting, growing, and harvest months. The rally that we see mid-summer can be severe but infrequent. The best strategy is to look for any move higher and sell short (usually in June or July), exiting at harvest.
Soybeans
The soybean seasonality shown in Chart 3 is more extreme than corn. It shows the mid-summer rally, followed by a dip at harvest, generally in September. But the last 5 years show the low in August followed by a strong rally. If you figured out why corn rallied, you’ll figure this one out. This is clearly not the normal pattern.

Chart 3. Soybean seasonality.
Even with the 5-year pattern being odd, Chart 4 for 2024 soybeans is what I consider “normal.” It starts at $12/bbl, rallies in June, then drops to its lows at harvest, in September. It stays low after that. It will rally in the new year based on consumption. While corn has other uses, mostly for sweeteners and ethanol, soybeans are mostly animal feed and cooking oil.
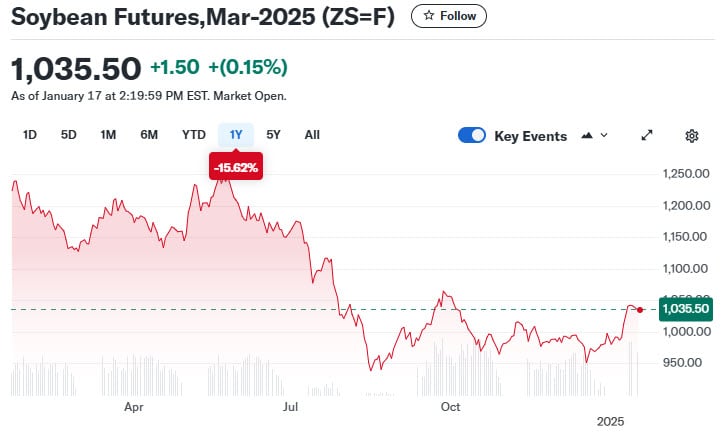
Chart 4. Soybeans in 2024.
Cotton
Another big U.S. crop is cotton, even though we import lots from Asia. Cotton is showing a “normal” pattern compared to corn. While harvest lows are in July, prices are not rallying as they have for the past 20 years (see Chart 5). Still, a seasonal trade, selling in February and buying back in July looks promising.
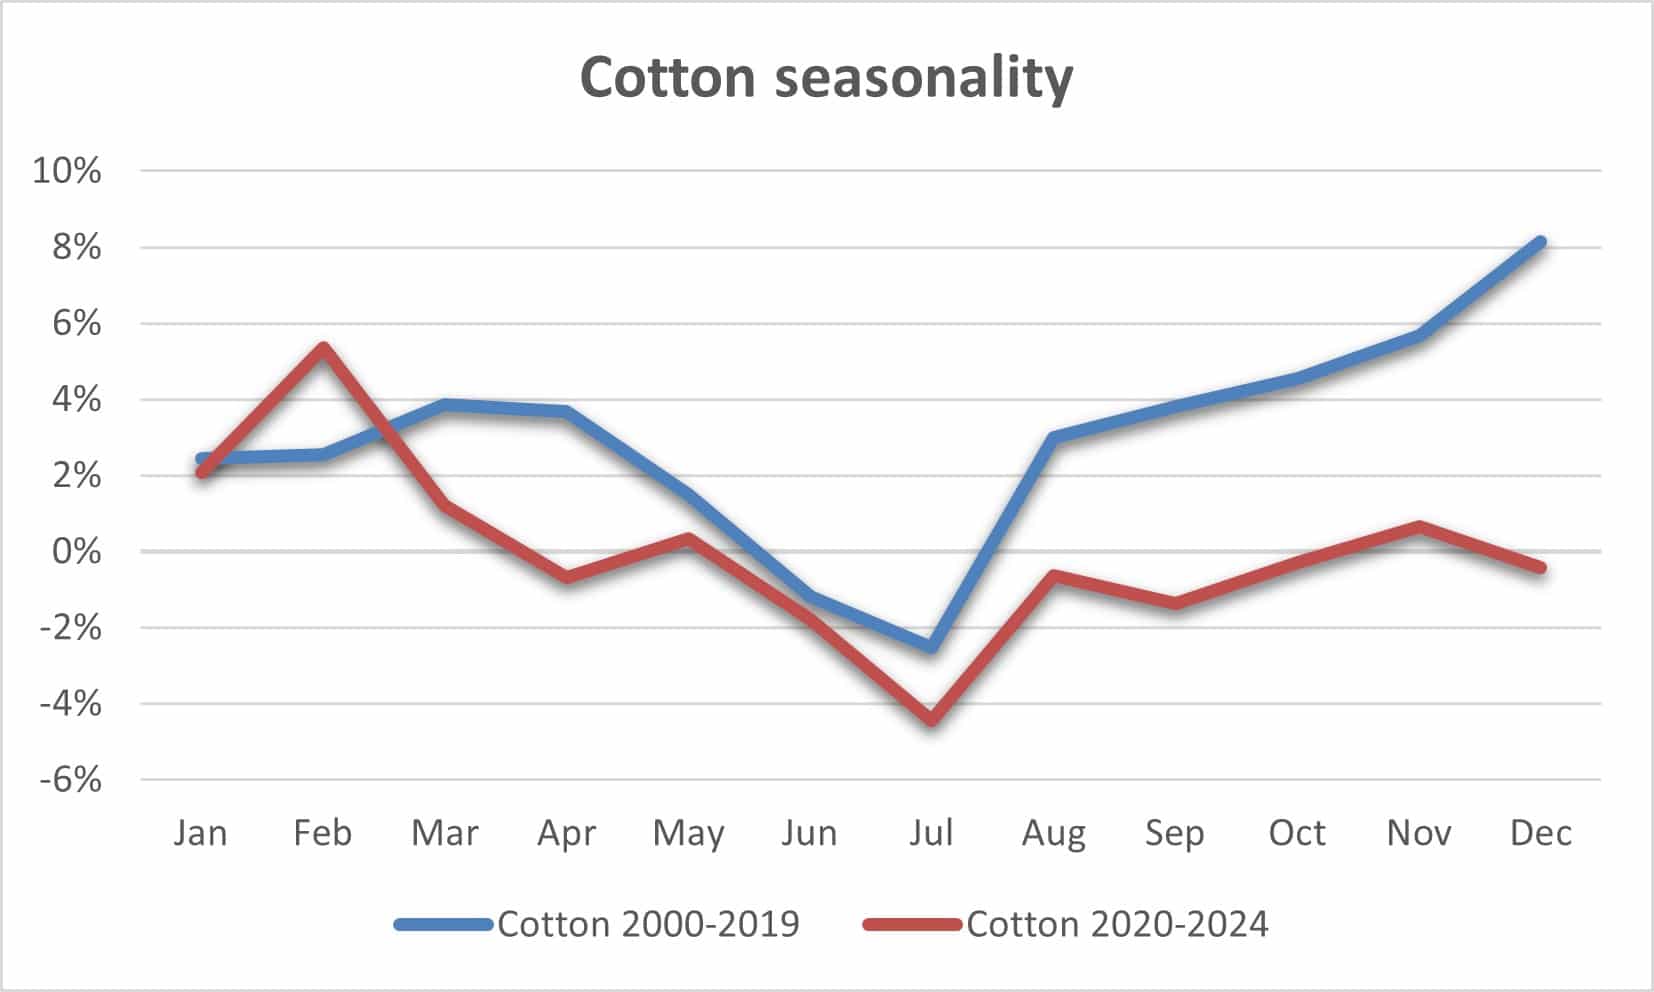
Chart 5. Cotton seasonality.
2024 shows a low in July and no recovery. That leads us to a bullish position in 2025.
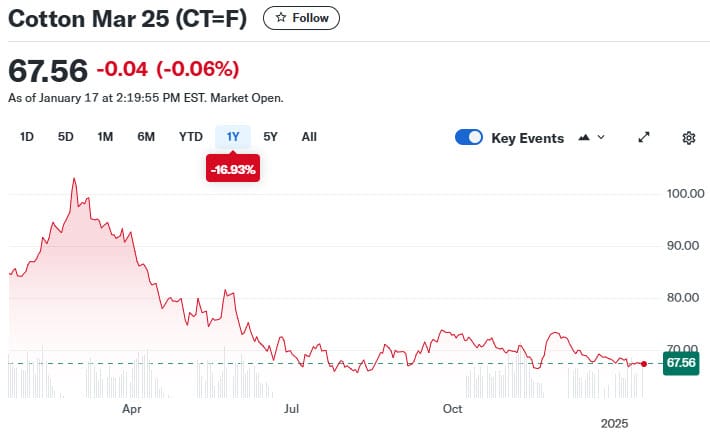
Chart 6. Cotton futures, 2024.
Orange Juice
When I traded orange juice in the late 80’s, a winter freeze in Florida would drive up prices. But then we started importing frozen OJ from Brazil. Everyone thought that was sacrilegious, but consumers wanted their orange juice. Between 1978 and last year, prices seem to have had a cap. But not this year. Brazil has had a drought and there is a bacterial disease in both Brazil and Florida. And the cost of production is higher. Combine that with a sudden freeze in January. I haven’t seen the reports, but the oranges on the trees must freeze, and farmers need to process them quickly, or not at all. Put all that together and we have a rally, shown in Chart 7.
As a note, the on-line news says that Florida produces 85% of our OJ, but that Brazil exports 75% to 80% of its OJ to the U.S. Those numbers don’t make sense to me, but the chart does.
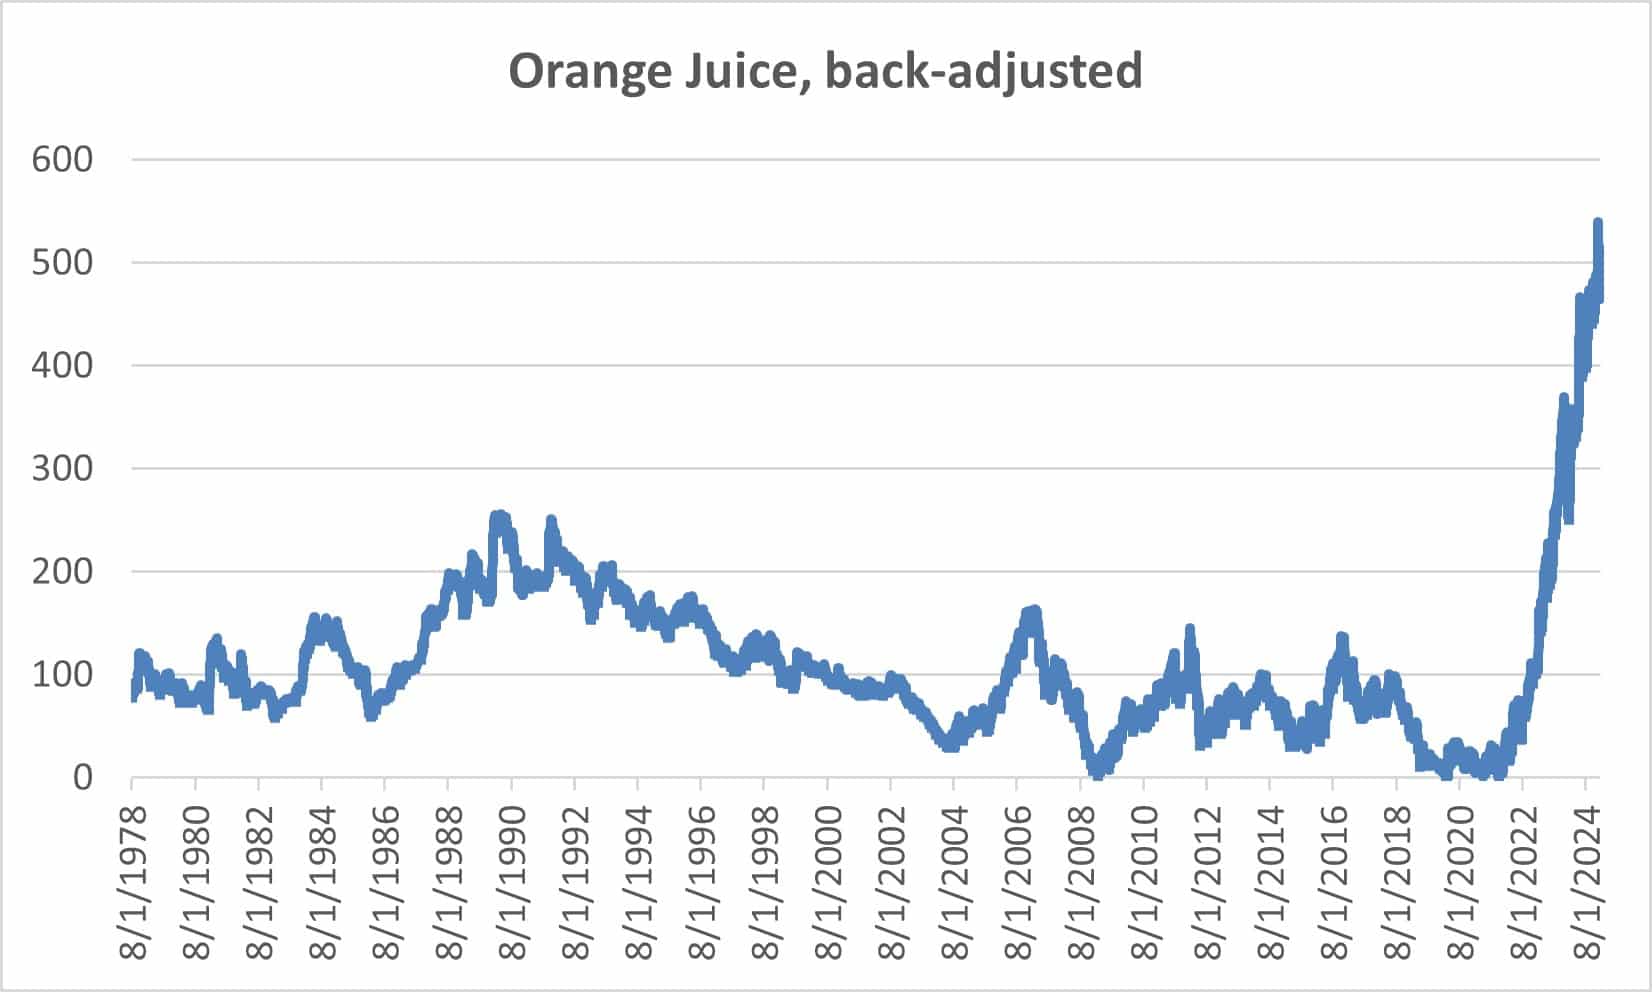
Chart 7. Orange juice futures, back-adjusted.
The recent 5 years shows a typical seasonal pattern. Orange juice is harvest mostly from December to May, so the lows on the recent 5-year chart are in February, shown in Chart 8. After that, demand depletes the supply and prices rise. That’s the way it works for any crop harvested once each year. The recent rise from March through September has some seasonal qualities but varies from the long-term pattern.
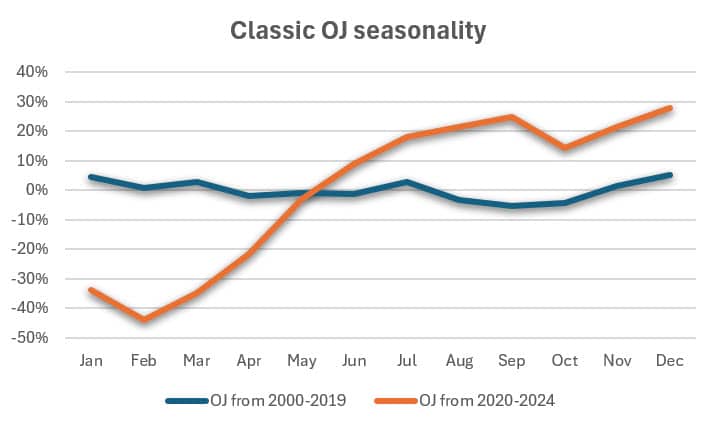
Chart 8. Orange juice seasonality.
More Seasonality
I’ve always liked seasonal trades. I like trades that are based on something real, rather than patterns uncovered by a computer search. Nature tends to be reliable, even if a bit volatile.
Cocoa
The other big movers in 2024 were cocoa and coffee, again due to weather and disease.
Cocoa started the year under $5,000/metric ton and ended at $11,000, a gain of 120%. We normally figure commodity margin at about 10%, that would be a gain of $55,000 on a $25,000 investment. Of course, the 2024 pattern does not lend itself to trend following as you can see in Chart 9.
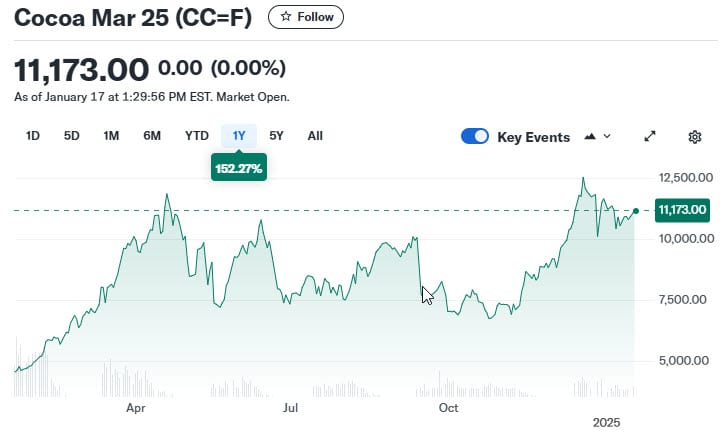
Figure 9. Cocoa futures, 2024.
But that doesn’t tell the story. Cocoa consumption has been increasing for the past 25 years, maybe longer. In Chart 10 (on the left) we see the steady climb each year. The past 5 years have been much quieter, yet still moving higher (Chart 10 on the right). We can see the price stalling during the main harvest, starting in September and ending in January. Then prices take off again.
Trading seasonality in cocoa seems to be simply taking a long position and holding on. You can use the harvest period as a way to get out, but then there are years when there is no pullback.
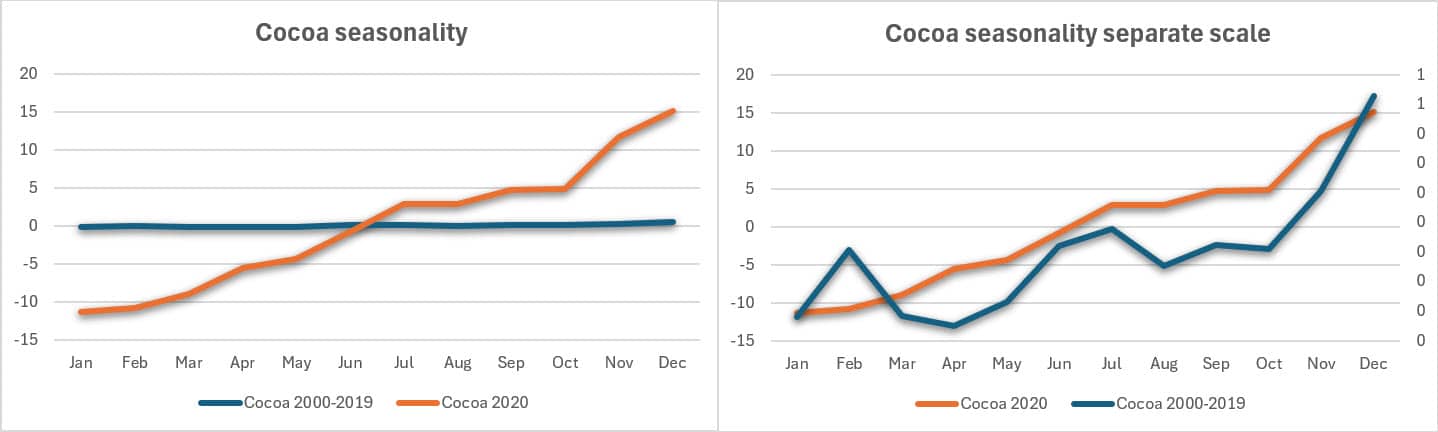
Chart 10. Cocoa seasonality. (Left) on the same scale, (right) recent 5 years on the right scale.
Coffee
Coffee prices had a nice trend. The reasons seem to be the same as cocoa: weather and demand, the usual suspects. Last year it ran up from $200/lb to $325, another good gain given margin. Main harvest is October through February and a secondary harvest from March to June. We should expect lower prices ending in June, as shown in blue in Chart 11 below.
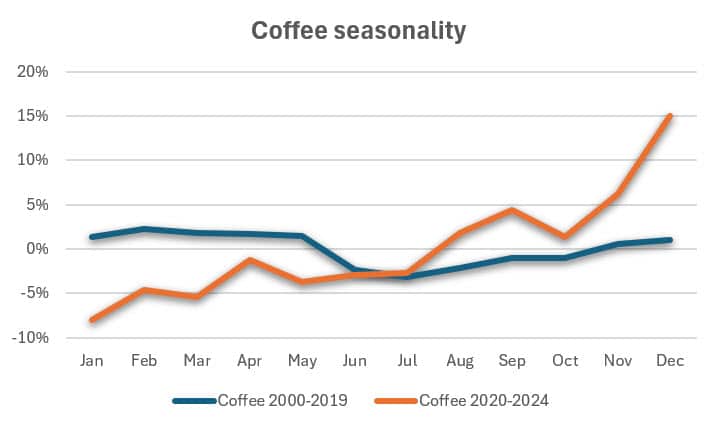
Chart 11. Coffee seasonal comparison.
Similar to other commodities, we have an unusual gain after harvest. I have found that, when all markets move the same, there is a global influence. I doubt that consumers are buying as much as the price shows, so it is more likely to be inflation and the increase in the cost of production. It could also be weather. The southern hemisphere is as hot as we are cold! Chart 12 shows a steady rise in 2024.
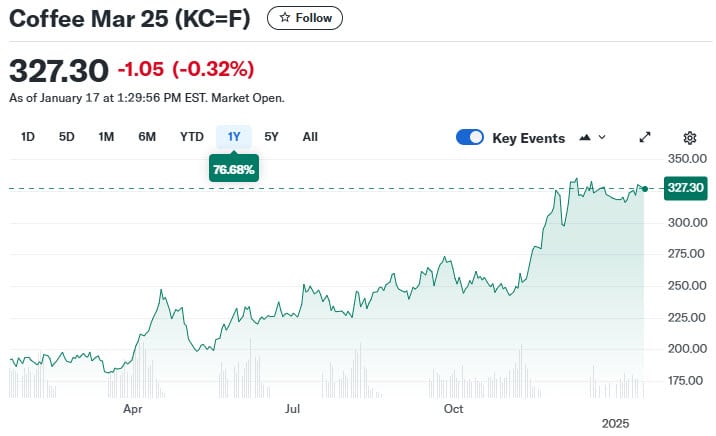
Chart 12. Coffee futures, 2024.
Trading Cocoa and Coffee
I try to be flexible in applying a trading strategy. The grains still show typical seasonal moves, although I would expect increased costs to move prices higher.
However, I think that using a trend to trade cocoa and coffee makes sense. Perhaps only a 20-day trend, and not more than 43 days (a trading quarter). Prices have not shown a seasonal pattern, only steady increases. Using a trend will let you capitalize on a big move, but also give you a way to exit. Keep your eye on harvest times. A small decline is likely, but the trend should keep you in the trade.
Seasonality
For the past few years, seasonal patterns have been stressed. Most markets want to go up. While grains seem to be holding to seasonal patterns, nothing else is.
We’re going to put aside the seasonal patterns and look to be long commodities for this year, wherever possible. Well, maybe not cotton.
A Standing Note on Short Sales
Note that the “All Signals” reports show short sales in stocks and ETFs, even though short positions are not executed in the equity portfolios. Our work over the years shows that downturns in the stock market are most often short-lived and it is difficult to capture with a longer-term trend. The upwards bias also works against shorter-term systems unless using futures, which allows leverage. Our decision has been to take only long positions in equities and control the risk by exiting many of the portfolios when there is extreme volatility and/or an indication of a severe downturn.
PORTFOLIO METHODOLOGY IN BRIEF
Both equity and futures programs use the same basic portfolio technology. They all exploit the persistence of performance, that is, they seek those markets with good long-term and short-term returns on the specific system, rank them, then choose the best, subject to liquidity, an existing current signal, with limitations on how many can be chosen from each sector. If there are not enough stocks or futures markets that satisfy all the conditions, then the portfolio holds fewer assets. In general, these portfolios are high beta, showing higher returns and higher risk, but have had a history of consistently outperforming the broad market index in all traditional measures.
PERFORMANCE BY GROUP
NOTE that the charts show below represent performance “tracking,” that is, the oldest results since are simulated but the returns from 2013 are the systematic daily performance added day by day. Any changes to the strategies do not affect the past performance, unless noted. The system assumes 100% investment and stocks are executed on the open, futures on the close of the trading day following the signals. From time to time we make logic changes to the strategies and show how the new model performs.
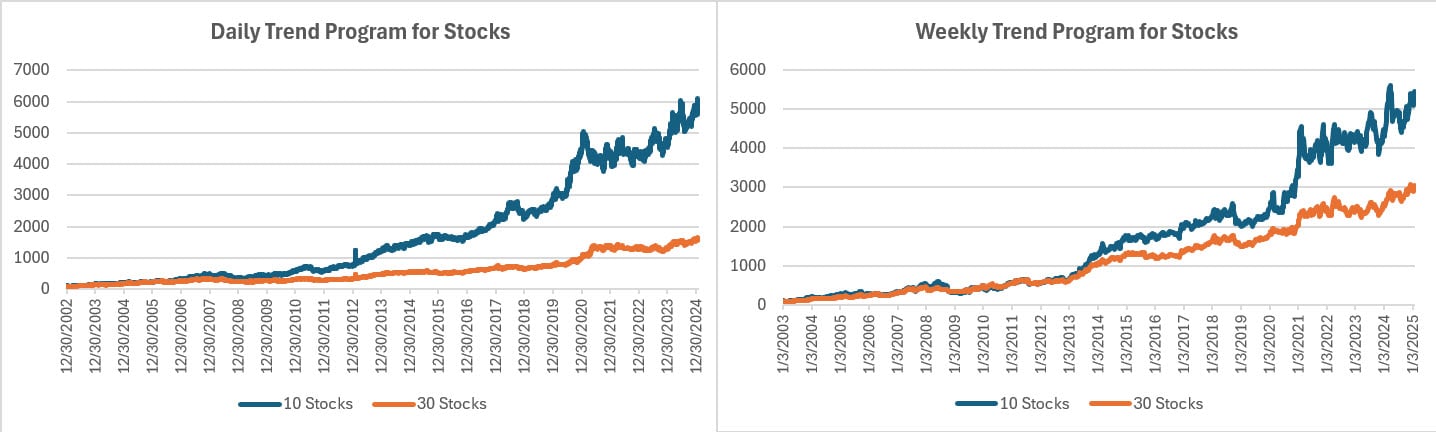
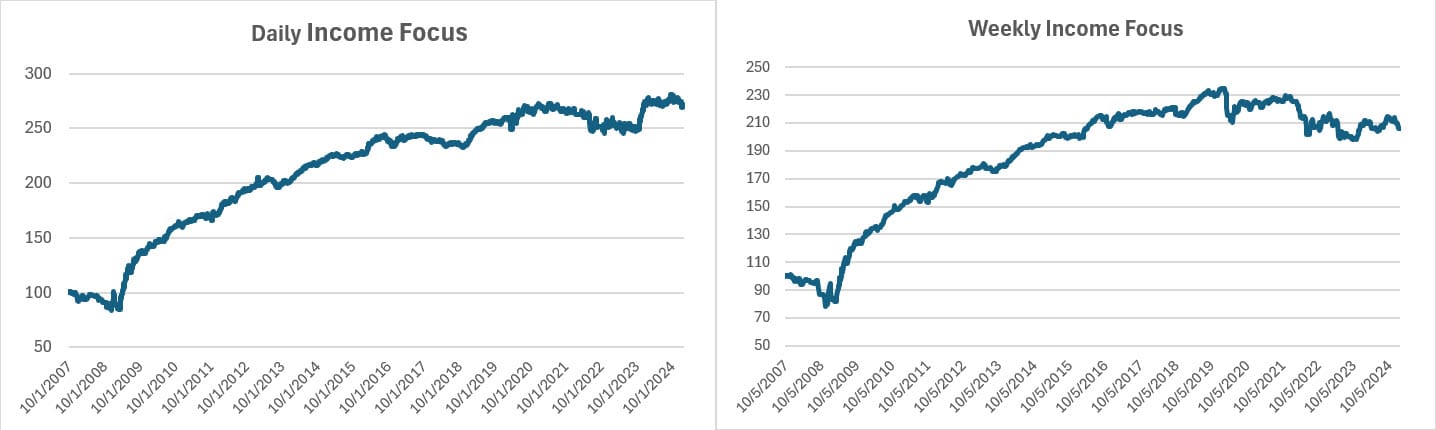
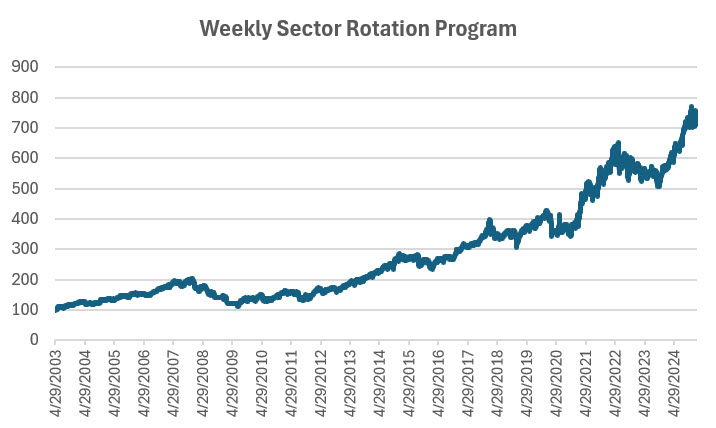
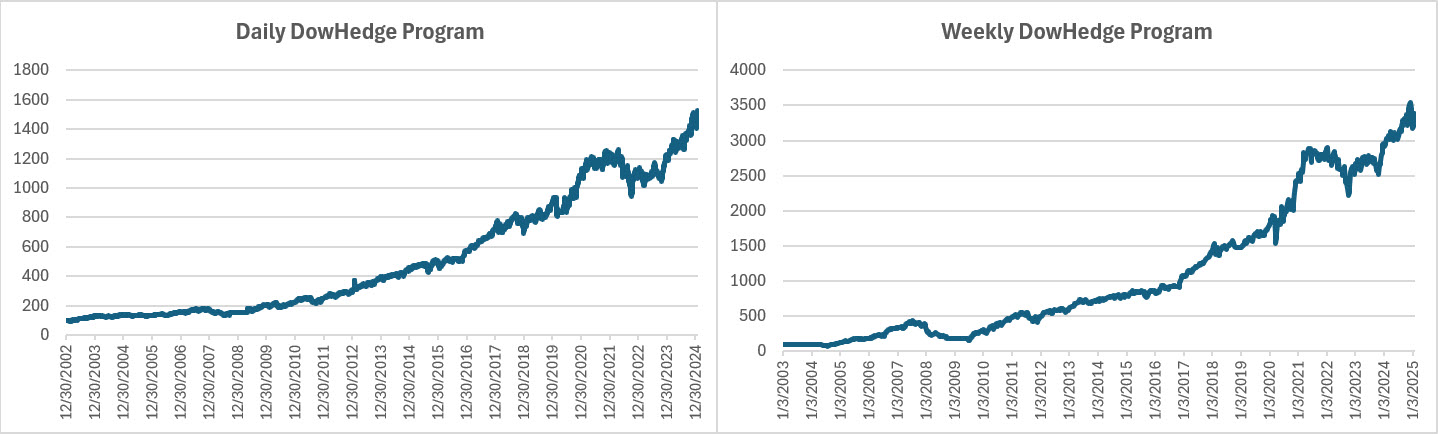
Groups DE1 and WE1: Daily and Weekly Trend Program for Stocks, including Income Focus, DowHedge, Sector Rotation, and the New High-Risk Portfolio
The Trend program seeks long-term directional changes in markets and the portfolios choose stocks that have realized profitable performance over many years combined with good short-term returns. It will hold fewer stocks when they do not meet our condition and exit the entire portfolio when there is extreme risk or a significant downturn.
Equity Trend
The DeepSeek sell-off took about 7% of our gains in January, leaving us with profits of 2% in the daily program and marginal gains in the weekly portfolio. The extreme volatility also caused us to exit the market for both the daily and weekly portfolios. We’ll reenter later this week unless the market continues lower.
Income Focus and Sector Rotation
This is starting to look like 2024, with rates jumping back and forth, first lower as inflation falls, then higher as tariffs and other economic news surfaces. While risk is low in this program, serious profits won’t happen until rates decline.
Weekly Sector Rotation
The Sector Rotation program is starting out as the best portfolio in our group. After holding energy (XKE) it just switched to Staples. It now holds Financials and Utilities as well. It doesn’t switch often, so expect to hold these positions for a while.
DowHedge Programs
The Dow index did better than the other index markets, a rare occurrence. Our DowHedge programs also did well, gaining 5.4% in the daily and 3.9% in the weekly. This program continues to do well given the uncertainty in the market.
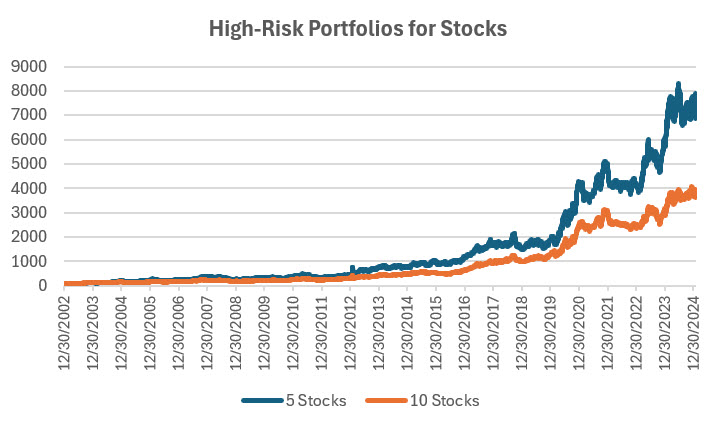
High-Risk Portfolios
The DeepSeek announcement affected this program the most, yet the smaller 5-stock portfolio finished higher by about 2% while the larger portfolio ended flat in January. This program has mostly high-tech and biomedical, both of which are likely to rally but with high volatility.
Group DE2: Divergence Program for Stocks
The Divergence program looks for patterns where price and momentum diverge, then takes a position in anticipation of the pattern resolving itself in a predictable direction, often the way prices had moved before the period of uncertainty.
Another over-achiever this month was the Equity Divergence program, higher by 8.5% and 2.7%. This program looks for pullbacks in a trending market. In this case, it must have been AI and software stocks, which were beaten up before rallying.

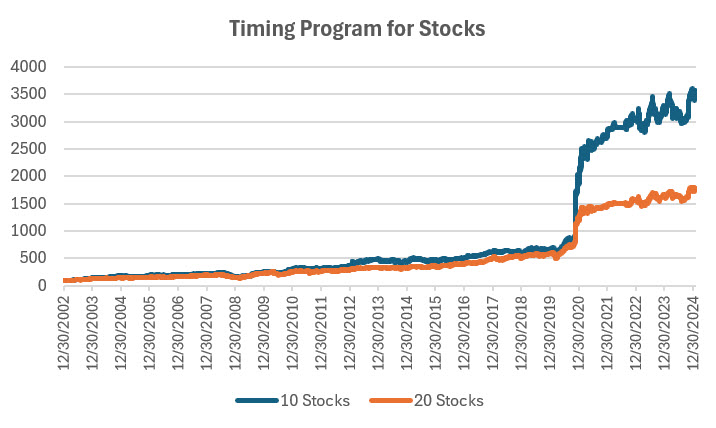
Group DE3: Timing Program for Stocks
The Timing program is a relative-value arbitrage, taking advantage of undervalued stocks relative to its index. It first finds the index that correlates best with a stock, then waits for an oversold indicator within an upwards trend. It exits when the stock price normalizes relative to the index, or the trend turns down. These portfolios are long-only because the upwards bias in stocks and that they are most often used in retirement accounts.
Not exciting but still profitable in January, higher by nearly 3% and 2% in the smaller and larger portfolios. It looks as though it wants to move higher and has shown very small risk.
Futures Programs
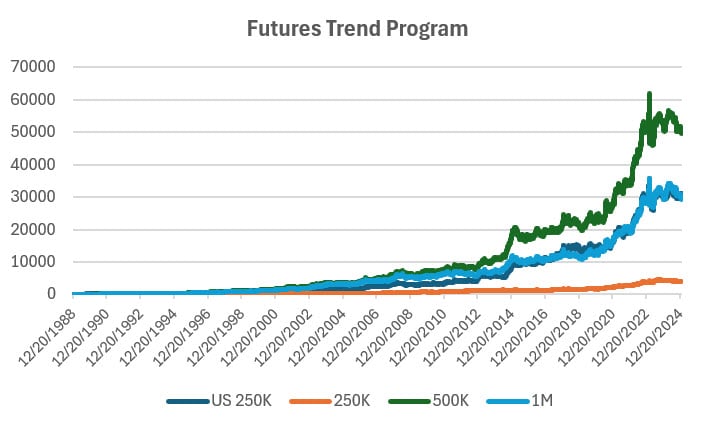
Groups DF1: Daily Trend Programs for Futures
Futures allow both high leverage and true diversification. The larger portfolios, such as $1million, are diversified into both commodities and world index and interest rate markets, in addition to foreign exchange. Its performance is not expected to track the U.S. stock market and is a hedge in every sense because it is uncorrelated. As the portfolio becomes more diversified its returns are more stable.
The leverage available in futures markets allows us to manage the risk in the portfolio, something not possible to the same degree with stocks. This portfolio targets 14% volatility. Investors interested in lower leverage can simply scale down all positions equally in proportion to their volatility preference. Note that these portfolios do not trade Asian futures, which we believe are more difficult for U.S. investors to execute. The “US 250K” portfolio trades only U.S. futures.
Holding steady but with small losses in January. Some of the profits usually made in interest rates seem to be switching to commodities. In our “Close-Up” we think that weather and higher costs will drive prices for the next few months.
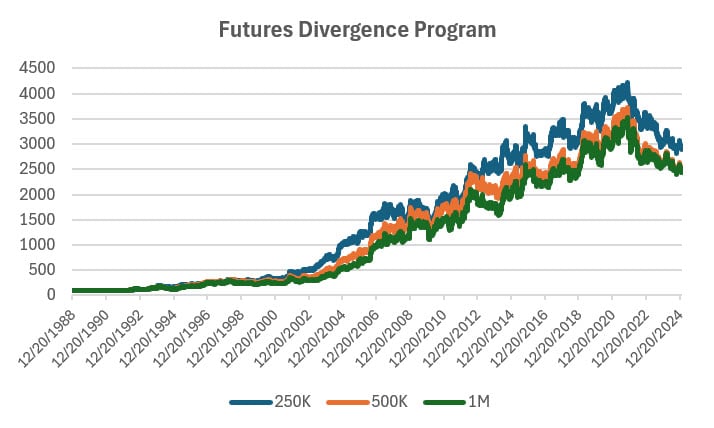
Group DF2: Divergence Portfolio for Futures
Fractional losses continue the pattern from last year. Not pleasant, but this program can recover when there are trends in the market. So far, not yet.
Blogs and Recent Publications
Perry’s books are all available on Amazon or through our website, www.kaufmansignals.com.
February 2025
Another article, “Chasing the Market” appeared in the February issue of Technical Analysis of Stocks & Commodities. It answers the question, “Can you make money entering the market after a big move?”
Perry will be giving a “Fireside Chat” at the Society of Technical Analysts (STA) in London on Tuesday, February 11 at 6:30. Join him if you can.
December 2024
“Overlooked Strategy Rules” appeared in the December issue of Technical Analysis of Stocks & Commodities. We tend to overlook certain rules that can make a big difference to results. This article looks at scaling in and scaling out of a position, delayed entries, correlations, and other simple but important rules.
October 2024
“Trading a Breakout System” was published in Technical Analysis of Stocks & Commodities. It looks at whether it’s better to enter on the bullish breakout, wait for confirmation, or buy ahead of the breakout. It’s a practical look at improving breakout results.
September 2024
Two articles posted by Perry, “The N-Day or the Swing Breakout,” (Technical Analysis of Stocks & Commodities) looking to see which is better. You would be surprised.
A look at deleveraging Artificial Intelligence stocks, a shorter version of the article posted in our “Close-Up” section. It appeared in Seeking Alpha earlier in September.
August 2024
“Theory Versus Reality” was published in the August issue of Technical Analysis of Stocks & Commodities. It discusses price shocks, diversification, predicting performance, and more.
July 2024
Perry posted a new article on Seeking Alpha, “Capturing Fund Flows.” It a good strategy for someone that wants to add some diversification. It only trades 3 days each month!
June 2024
Perry was interviewed on June 27th by Simon Mansell and Richard Brennan at QuantiveAlpha (Queensland, Australia), a website heavy into technical trading. It should be posted in a week or so.
“Trading Extreme Gaps and Extreme Closes” looks at daily patterns in stocks, published in the June edition of Technical Analysis.
May 2024
In the April edition of Technical Analysis, Perry again deals with risk in “How Professional Assign Risk.” It is another chapter in how to protect yourself.
April 2024
Another article in the April edition of Technical Analysis, “Determining Risk Before It Happens.” Perry thinks this is an article everyone should read.
March 2024
In the 2024 Bonus Issue of Technical Analysis, Perry has an article, “Pros and Cons of Daily Versus Weekly Trend Following.” There is also a quote by him in the “Retrospective: Interviews” going back to April 1988.
Perry also posted an article on Seeking Alpha, “How To Exit a Trade.” A good reminder of the choices.
Older Items of Interest
On April 18th, 2023, Perry gave a webinar to the Society of Technical Analysts (London) on how to develop and test a successful trading system. Check their website for more details, https://www.technicalanalysts.com..
Perry’s webinar on risk, given to the U.K. Society of Technical Analysts, can be seen using the following link: https://vimeo.com/708691362/04c8fb70ea
For older articles please scan the websites for Technical Analysis of Stocks & Commodities, Modern Trader, Seeking Alpha, ProActive Advisor Magazine, and Forbes. You will also find recorded presentations given by Mr. Kaufman at BetterSystemTrader.com, TalkingTrading.com, FXCM.com, systemtrade.pl, the website for Alex Gerchik, Michael Covel’s website, TrendFollowing.com, and Talking Trading.com.
You will also find up to six months of back copies of our “Close-Up” reports on our website, www.kaufmansignals.com. You can address any questions to perry@kaufmansignalsdaily.com.
© January 2025, Etna Publishing, LLC. All Rights Reserved.